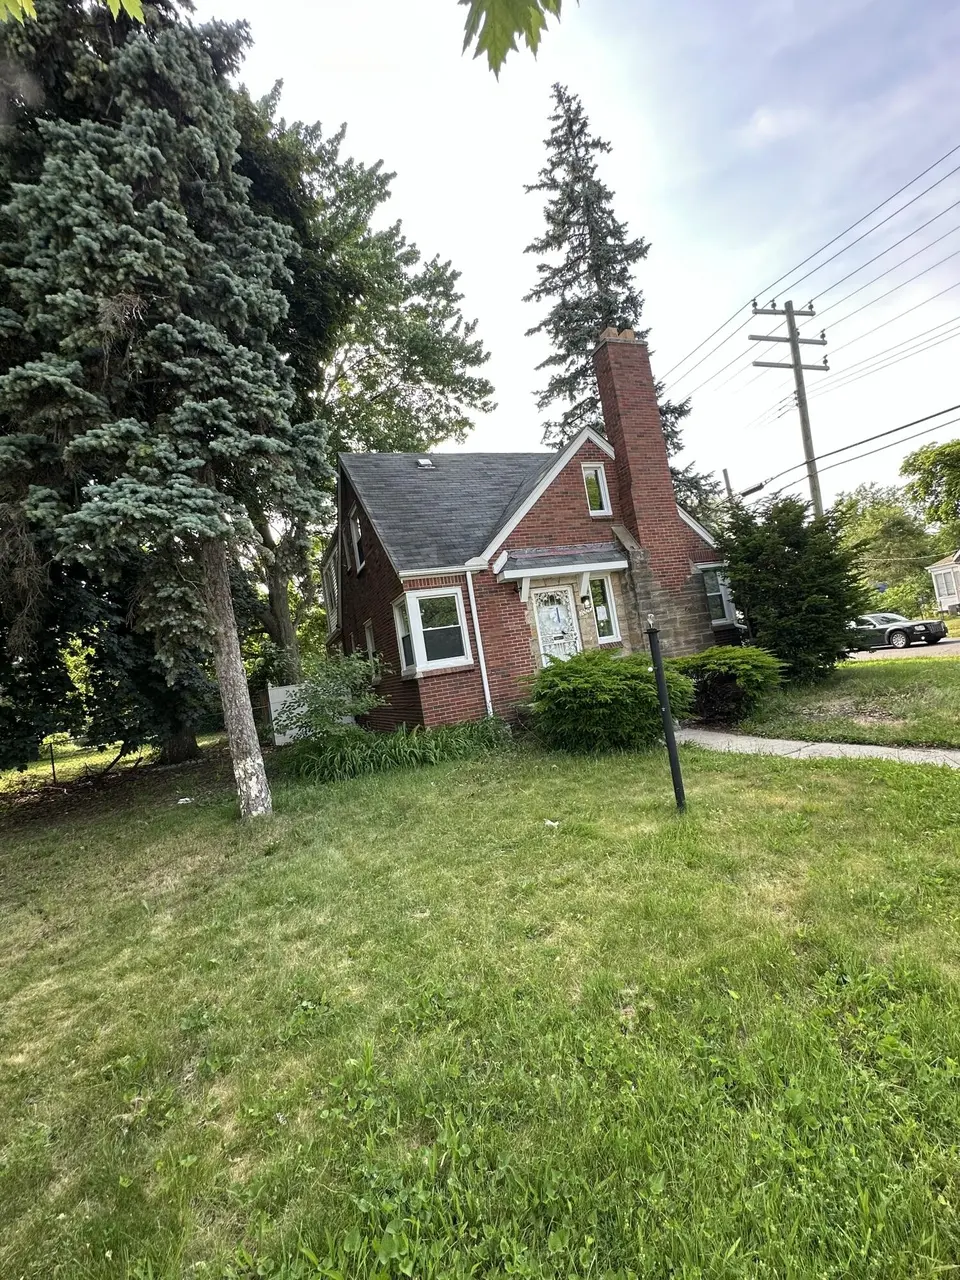
20045 Ward Ave · Detroit, MI
Flood risk 3/10 · Minor
- FEMA flood zone
- X (unshaded)
- Chance of flooding over 30 yrs
- 0.2%
- Est. flood insurance / yr
- $473 – $860
Fire risk 1/10 · Minimal
- Est. fire insurance / yr
- $784 – $1,456
Heat risk 3/10 · Minor
- Hot days now (above 97°F)
- 7 days/yr
- Hot days in 30 yrs
- 15 days/yr
Wind risk 2/10 · Minimal
- Chance of severe wind over 30 yrs
- —
Air-quality risk 3/10 · Minor
- Unhealthy air days now
- 2 days/yr
- Unhealthy air days in 30 yrs
- 5 days/yr
Risk factors via First Street. Map © Google.
Why this score? — see what drove the D- grade
The composite is a weighted blend of 9 inputs, each scored 0–100. Each bar is that input's sub-score; the figure is the points it added to the 100-point composite (weight × sub-score).
- Cash flow +15.6/30.0
- DSCR +4.8/10.0
- 1% rule +4.4/10.0
- Livability +3.7/5.0
- Rent growth +3.3/5.0
- Condition / age +2.5/5.0
- Schools +1.3/10.0
- ARV discount +0.0/15.0
- Appreciation +0.0/10.0
$159,900
🖨 Deal sheet (PDF) 📄 Offer letter ✓ Due diligence
Listing remarks MLS
Amazing Brick 4 Bedrooms, 2 Bathrooms With Finish basement And a detached 2 car Garage, complete renovation, New floors, Fresh Paints, NEW Kitchen, New Bathrooms, A complete Finish Basement with Open space . corner house with fenced backyard . A lot to mention , Must see will not last in market.
Key facts
- New kitchen
- Finish basement
- Complete renovation
Tags
Property features AI
Exterior
- Parking: Detached 2-car garage; Detached parking
- Utilities: Public water; Natural gas water heater
- Home design: Colonial style; Single-family residence; Residential property
- Construction: Built in 1940; Brick construction; Shingle roof
- Exterior features: Corner lot
Interior
- Kitchen: Disposal; Microwave; Kitchen (8 x 10)
- Bedrooms: Primary bedroom (12 x 13); Bedroom 2 (12 x 11); Bedroom 3 (12 x 10); Bedroom 4 (12 x 11)
- Bathrooms: 2 full bathrooms (primary bath ~4 x 3; second bath ~4 x 3)
- Heating & cooling: Forced air heating; Has heating
- Interior features: Disposal; Microwave; Fireplace; Insulated windows; 7 total rooms; Full basement
- Laundry & utility: Utility room (5 x 6)
Neighborhood map
What this means for you Summary
Snapshot
- This is a 4-bed/1.0-bath single-family listed at $160k.
Deal economics
- At list price, monthly cash flow is $67 ($807/yr) — positive.
- The deal already cash-flows at list — no discount required.
- To meet the 1% rule (rent ≥ 1% of price), the offer needs to be $150k (5.9% below list).
- Recommended offer: $150k (5.9% below list) — sets the bar for 1% rule.
- Cap rate 6.8% vs local median 10.0% in Detroit — below-typical yield; the buyer is paying a premium for something (appreciation thesis, condition, location) that the cap rate doesn't capture.
Location & tenants
- Location reads 73/100 on livability (#218 in MI) — a middle-class / working-renter tenant base. Strengths: amenities A+, commute A+, cost of living A+; Watch: crime F, employment F.
- Detroit Public Schools Community District (urban): math 10% / reading 24% proficiency, ranked #499 of 540 in MI (top 92%) — low school quality limits family demand, transient renter base, plan for 1-2y turnover; 90% free/reduced lunch — lower-income household profile, screen leases tightly.
- Zoned schools: Vernor Elementary School (math 24% / reading 24%, grade F, #980 of 1,397 statewide, top 74%, 328 students, 87% FRL); Mumford High School (math 24% / reading 24%, grade F, #481 of 713 statewide, top 81%, 889 students, 86% FRL) — zoned schools at 87% FRL track the district average.
- Market conditions: Rents rising (+3.2%/yr); 291 active listings in the ZIP; 20 comparable units currently listed for rent nearby; rentals at typical pace (median 20d on market — plan ~3-4 weeks tenant-placement turnaround); lower-income renter base — watch delinquency; 2,639 units permitted in Wayne County in 2024 (1,216 in 5+ unit buildings).
- At $1,504/mo this rent would consume 46% of the median local household income ($39k/yr) (locally 3064% of renters already pay >50% of income on rent) — very limited rent-growth headroom before tenants either downsize or default.
Forward outlook
- Local home prices are declining (-3.0%/yr); year-one equity from $1k of loan paydown is wiped out by about $5k of value loss. Plan a longer hold.
- Wayne County population projected at -17% by 2050 — secular population decline; favor cash flow + early exit over multi-decade hold.
Negotiation context
- Only 13 days on market — expect competitive offers; lowballing is unlikely to land.
- 6 sale attempts since 23y ago with the ask held roughly flat each time — persistent listings suggest the price (not the market) is what's stuck; bring a comps-based counter.
Risks & watch-outs
- Watch-outs: built in 1940 — expect roof / HVAC / electrical / plumbing capex.
Questions for the listing agent
- Built in 1940 — when were the roof, HVAC, electrical panel, plumbing, and water heater last replaced?
- Is there a deadline driving the sale (1031 exchange, divorce, estate, relocation)? That informs how much negotiation room exists.
- Schools are F-rated, which usually means shorter tenancies and higher turnover. Who's the typical renter profile here, and what's been the actual vacancy rate?
- Crime grade is F in this area — have there been break-ins, vandalism, or insurance claims at this property in the last 3 years? What carrier currently insures it and at what premium?
- The area grade is low — what's the realistic commute time and amenity access for the typical tenant pool here? Any planned neighborhood developments (good or bad) we should know about?
- What's the average days-on-market for RENTAL listings here right now (not sales)? A rising rental-DOM trend means longer vacancies and softer asking-rent achievability than the comps imply.
- What's the recent tenant-quality profile in this submarket — average credit score on applications, eviction rate, late-payment / NSF rate, and stable-employment percentage? A property-management company in the area should have these aggregated.
- How much new for-sale + rental construction is in the pipeline within 1–3 miles? Heavy new supply typically softens prices + rents 12–24 months out; constrained supply supports both.
Investment metrics
- 1% rule
- 0.94% ✗
- Cap rate
- 6.80%
- Cash-on-cash
- 1.80%
- DSCR
- 1.08
- GRM
- 8.9
CMA / ARV
- ARV (on-the-fly)
- $113,760
- Comps found
- 12
Show comp detail 12 sales within ~0.75 mi
| Address | Dist | Beds/Ba | Sqft | Sold | Price | $/sf | Match |
|---|---|---|---|---|---|---|---|
| 20100 Appoline St | 0.20mi | 3/1.5 (-1) | 1,500 (+4%) | 2mo | $90,000 | $60 | 76 |
| 20164 Tracey St | 0.33mi | 3/1.5 (-1) | 1,461 (+2%) | 2mo | $115,000 | $79 | 74 |
| 13517 Pembroke Ave | 0.28mi | 3/1.5 (-1) | 1,386 (-4%) | 4mo | $92,000 | $66 | 71 |
| 20126 Steel St | 0.15mi | 3/1.0 (-1) | 1,297 (-10%) | 5mo | $65,625 | $51 | 67 |
| 19775 Ward St | 0.19mi | 3/1.5 (-1) | 1,337 (-7%) | 6mo | $110,000 | $82 | 67 |
| 20184 Ward St | 0.10mi | 4/2.5 | 1,589 (+10%) | 7mo | $218,000 | $137 | 66 |
| 19440 Hartwell St | 0.39mi | 3/1.5 (-1) | 1,538 (+7%) | 6mo | $95,000 | $62 | 59 |
| 19209 Hartwell St | 0.58mi | 3/1.5 (-1) | 1,406 (-2%) | 6mo | $190,000 | $135 | 57 |
| 18945 Littlefield St | 0.72mi | 3/1.5 (-1) | 1,473 (+2%) | 4mo | $180,000 | $122 | 52 |
| 20466 Stansbury St | 0.50mi | 3/1.5 (-1) | 1,243 (-14%) | 1mo | $67,000 | $54 | 46 |
| 19758 Freeland St | 0.59mi | 3/1.0 (-1) | 1,580 (+10%) | 9mo | $109,000 | $69 | 43 |
| 18953 Littlefield St | 0.72mi | 3/1.0 (-1) | 1,575 (+9%) | 5mo | $206,500 | $131 | 42 |
Match score weights: distance 35% · size 25% · config 20% · recency 20%. Top-matched comps best support the ARV.
Projected returns pro-forma
-3.0% appreciation · 3.25% rent growth · sell at horizon
- IRR
- -13.1%
- Equity multiple
- 0.53×
- Total profit
- $-21,214
- Equity at exit
- $23,842
- IRR
- -3.7%
- Equity multiple
- 0.75×
- Total profit
- $-11,259
- Equity at exit
- $13,825
Cash invested: $44,772 (down + closing). Projections, not guarantees.
Landlord ↔ Tenant lean methodology
- Overall (STATE)
- 62 Landlord-Friendly
- State Michigan
- 62 Landlord-Friendly · EVEN
- County
- — inherits STATE
- City
- — inherits STATE
ZIP-level market 48235
- Rents YoY
- 3.2%
- Active inventory
- 291
- Price-to-rent
- 8.9×
Monthly cashflow live
- Estimated rent
- $1,504 high interval (Pro) →
- Mortgage (P&I)
- −$839
- Tax from tax record
- −$216 /mo · $2,593/yr
- Insurance
- −$67
- HOA
- −$0
- Vacancy / Maint / Mgmt
- −$316
- Net cashflow
- $67
Break-even live
Sensitivity live
| Price | -10% $158 | -5% $113 | +0% $67 | +5% $22 | +10% $-23 |
|---|---|---|---|---|---|
| Rent | -10% $-52 | -5% $8 | +0% $67 | +5% $127 | +10% $186 |
| Rate | -1.0pp $148 | -0.5pp $108 | base $67 | +0.5pp $26 | +1.0pp $-16 |
UW: 25.0% down · 7.5% · 30yr · 1.5% tax · 5.0% vac · 8.0% maint · 8.0% mgmt
Financing live
Cash to close
- Down payment
- $39,975
- Closing costs
- $4,797
- Reserves months
- —
- Total cash needed
- —
Loan-product check · same deal, 3 products live
Conventional
25% down · 7.5% · 30yr
- Down + closing
- —
- Monthly P&I
- —
- Monthly cashflow
- —
- DSCR
- —
- Eligible?
- —
Personal DTI + credit; lowest rate.
DSCR
20% down · 8.5% · 30yr
- Down + closing
- —
- Monthly P&I
- —
- Monthly cashflow
- —
- DSCR
- —
- Eligible?
- —
No personal income docs; deal must DSCR.
Hard money
10% down · 12.0% · 12mo
- Down + closing
- —
- Monthly P&I
- —
- Monthly cashflow
- —
- DSCR
- —
- Eligible?
- —
Short-term bridge; refi at stabilization.
Rent comps 20 comps
| Address | Beds | Baths | Sqft | Rent | $/sqft | DOM | Units | Dist |
|---|---|---|---|---|---|---|---|---|
| 20122 Manor St Detroit, MI | 3.0 | 1.0 | 1028 | $1,200 | $1.17 | 45d | 1 | 0.33mi |
| 20245 Manor Detroit, MI | 3.0 | 1.0 | 1018 | $1,400 | $1.38 | 4d | 1 | 0.35mi |
| 20426 Tracey St Detroit, MI | 3.0 | 1.0 | 1200 | $1,200 | $1.00 | 26d | 1 | 0.38mi |
| 20032 Monte Vista St Detroit, MI | 3.0 | 1.0 | 1000 | $1,294 | $1.29 | 22d | 1 | 0.38mi |
| 20042 Freeland St Detroit, MI | 3.0 | 1.5 | 1445 | $1,300 | $0.90 | 0d | 1 | 0.54mi |
| 20515 Ilene St Detroit, MI | 3.0 | 1.0 | 891 | $1,450 | $1.63 | 45d | 1 | 0.70mi |
| 20445 Kentucky St Detroit, MI | 3.0 | 1.0 | 1046 | $1,200 | $1.15 | 26d | 1 | 0.83mi |
| 20009 Wisconsin St Detroit, MI | 3.0 | 1.5 | 1051 | $1,400 | $1.33 | 19d | 1 | 0.91mi |
| 20458 Indiana St Detroit, MI | 3.0 | 1.0 | 1049 | $1,300 | $1.24 | 19d | 1 | 0.91mi |
| 19986 Cherrylawn St Detroit, MI | 4.0 | 1.5 | 1144 | $1,700 | $1.49 | 19d | 1 | 1.05mi |
| 21374 Ithaca Ave Ferndale, MI | 3.0 | 1.0 | 996 | $1,775 | $1.78 | 26d | 1 | 1.05mi |
| 21850 Coolidge Hwy #203 Oak Park, MI | 3.0 | 2.0 | 1100 | $1,700 | $1.55 | 7d | 1 | 1.10mi |
| 18935 Indiana St Detroit, MI | 3.0 | 1.0 | 1248 | $1,523 | $1.22 | 7d | 1 | 1.10mi |
| 20110 Northlawn St Detroit, MI | 3.0 | 1.0 | 1100 | $1,350 | $1.23 | 19d | 1 | 1.11mi |
| 18964 Coyle St Detroit, MI | 3.0 | 1.0 | 1300 | $1,350 | $1.04 | 4d | 1 | 1.19mi |
| 20045 Greenlawn St Detroit, MI | 3.0 | 1.0 | 925 | $1,350 | $1.46 | 45d | 1 | 1.21mi |
| 18257 Mark Twain St Detroit, MI | 3.0 | 1.0 | 1185 | $1,507 | $1.27 | 18d | 1 | 1.23mi |
| 18010 Lesure St Detroit, MI | 3.0 | 1.0 | 1010 | $1,500 | $1.49 | 0d | 1 | 1.27mi |
| 17540 Pinehurst St Detroit, MI | 3.0 | 1.0 | 1200 | $1,395 | $1.16 | 45d | 1 | 1.39mi |
| 22811 Rosewood St Oak Park, MI | 3.0 | 1.0 | 1000 | $1,600 | $1.60 | 26d | 1 | 1.46mi |
Listing history 9 events
-
2026-06-21days on market $159,900 Active 13 DOM
-
2026-06-18days on market $159,900 Active 10 DOM
-
2026-06-17days on market $159,900 Active 9 DOM
-
2026-06-16days on market $159,900 Active 8 DOM
-
2026-06-15days on market $159,900 Active 7 DOM
-
2026-06-13days on market $159,900 Active 5 DOM
-
2026-06-13days on market $159,900 Active 4 DOM
-
2026-06-09remarks 296-char remark
-
2026-06-09$159,900 Active 1 DOM
ⓘ Source: listings_history table (triggers on properties + properties_extension) + one-shot
backfill from property_details.listing_events for pre-trigger history.
Tax reassessment forecast MI · Partial reset (capped growth)
- Current annual tax
- $2,593 · $216/mo
- Projected year-2 tax
- $2,593 · $216/mo
- Expected delta
- $0/yr ($0/mo · -0.0%)
ⓘ Screening estimate from a state-policy table — verify with the county assessor before closing.
Climate risk First Street
- Flood 3/10 Moderate FEMA zone X (unshaded) · 20% chance over 30 yrs
- Wildfire 1/10 Low
- Heat 3/10 Moderate 7 d/yr ≥97°F today · 15 d/yr by 30 yrs out
- Wind 2/10 Low
- Air quality 3/10 Moderate 2 unhealthy d/yr today · 5 by 30 yrs out
Nearby sold comps map
Loading sold comps map…
Walkable amenities ~0.75 mi
Loading nearby amenities…
Taxation est. · year 1
- Rental income
- $18,053
- − Mortgage interest
- −$8,957
- − Property taxes
- −$2,593
- − Insurance
- −$800
- − Repairs & maintenance
- −$1,444
- − Management
- −$1,444
- − Depreciation
- −$4,652
- Taxable loss
- −$1,836
- Est. tax savings @ 24.0%
- +$441
- After-tax cash flow
- $1,248/yr
For passive investors: Depreciation is non-cash, so a rental often shows a tax loss while cash-flowing — sheltering income. Rental losses are passive: they offset passive income freely, and up to $25,000/yr can offset ordinary (W-2) income if you actively participate and your MAGI is under $100k (phasing out to $0 by $150k); unused losses carry forward. On sale, claimed depreciation is recaptured at up to 25%, and gains may owe capital-gains tax (a 1031 exchange can defer both). Figures are a year-1 estimate at your 24.0% rate — not tax advice; consult a CPA.
Schools (NCES district)
- District
- Detroit Public Schools Community District
- NCES district ID
- 2601103
- Math proficiency
- 10% ▼ -2.00%
- Reading proficiency
- 24% ▲ 6.00%
- Median HH income
- $25,815
- Composite
- 13.06/100
- National rank
- #9564
- State rank
- #499 of 540 in MI
Livability — Detroit
- Score
- 73/100
- State rank
- #218
- US rank
- #5427
Category grades
Schools grade is shown separately in the Schools card above.
Census & demographics
- Census place
- Detroit, MI
- County
- Wayne County · 1,562,939 people
- City population
- 572,865
- Metro
- Detroit-Warren-Dearborn, MI
- Population (ZIP)
- 45,600
- Household income
- $39,265
- Rent vs Own
- Severe rent burden
- 3064.0
Population outlook (Wayne County) Hauer SSP2
- Today (2025)
- 1,675,273 people
- By 2030
- 1,620,300 · -3.3%
- By 2040
- 1,502,341 · -10.3%
- By 2050
- 1,384,039 · -17.4%
- By 2075
- 1,124,592 · -32.9%
- By 2100
- 881,193 · -47.4%
Race, ethnicity, and origin ACS 2023
- Neighborhood character
- Predominantly Black (94%)
- Race & ethnicity
- Black 94% White 3% Two or more races 2% Hispanic / Latino 1%
- Foreign-born
- 1% · Canada
- Languages at home
- 98% English-only · Spanish 1%
Political lean MEDSL · Wayne
- 2024 margin
- Strong D (+29.0) · D 62.7% · R 33.7% · Other 3.6%
- 2008→2024 swing
- -20.5pp toward R · 2008: 49.5pp · 2024: 29.0pp
- All cycles
- 2024: D+29.0 2020: D+38.1 2016: D+37.3 2012: D+46.9 2008: D+49.5
Not yet ingested
- Civics
- —
Market trends
- HPI YoY
- ▼ -153.02%
- Current HPI
- 263.6326
- Rent YoY
- ▲ 3.25%
- Metro
- Detroit-Warren-Dearborn, MI
- State GDP YoY
- ▲ 1.37%
- F500 in state
- 28
Industry mix (Fortune 500 HQ in MI)
| Industry | F500 HQs | Revenue |
|---|---|---|
| Automotive Parts | 3 | $48B |
|
||
| Automotive | 2 | $372B |
|
||
| Chemicals | 1 | $45B |
|
||
| Automotive Retail | 1 | $29B |
|
||
| Healthcare / Medical Devices | 1 | $23B |
|
||
| Automotive Technology | 1 | $20B |
|
||
Price history
+116.1% since first listed12 events — show timeline
- 2026-06-08 Listed $159,900 REALCOMP
- 2026-06-08 Listed $159,900 MiRealSource-MiMLS
- 2026-06-08 Listed $159,900 SW Michigan MLS
- 2004-05-25 Sold (Public Records) $148,500 Public Records
- 2003-12-12 Sold (MLS) $150,000 MiRealSource-MiMLS
- 2003-12-12 Sold (MLS) $150,000 REALCOMP
- 2003-11-10 Listing Removed — MiRealSource-MiMLS
- 2003-10-07 Listed $150,000 MiRealSource-MiMLS
- 2003-10-07 Listed $150,000 REALCOMP
- 2003-04-28 Listing Removed — REALCOMP
- 2003-02-04 Listed $125,000 REALCOMP
- 2002-11-11 Sold (Public Records) $74,000 Public Records
Property tax history
+2.2%/yrLatest (2025): $2,593 · +0.4% YoY. Source: county tax records.
Cash-flow waterfall
monthlySold comps — $/sqft
last 12 mo · ≤1 miLoading sold comps…