2611 Powderhorn Ln · Caldwell, ID
Flood risk No data
- FEMA flood zone
- —
- Chance of flooding over 30 yrs
- —
- Est. flood insurance / yr
- —
Fire risk No data
- Est. fire insurance / yr
- —
Heat risk No data
- Hot days now (above threshold)
- —
- Hot days in 30 yrs
- —
Wind risk No data
- Chance of severe wind over 30 yrs
- —
Air-quality risk No data
- Unhealthy air days now
- —
- Unhealthy air days in 30 yrs
- —
Risk factors via First Street. Map © Google.
Why this score? — see what drove the B grade
The composite is a weighted blend of 9 inputs, each scored 0–100. Each bar is that input's sub-score; the figure is the points it added to the 100-point composite (weight × sub-score).
- Cash flow +30.0/30.0
- ARV discount +12.7/15.0
- 1% rule +10.0/10.0
- DSCR +10.0/10.0
- Livability +3.4/5.0
- Rent growth +3.2/5.0
- Condition / age +2.5/5.0
- Schools +2.0/10.0
- Appreciation +0.0/10.0
$84,900
🖨 Deal sheet (PDF) 📄 Offer letter ✓ Due diligence
Listing remarks MLS
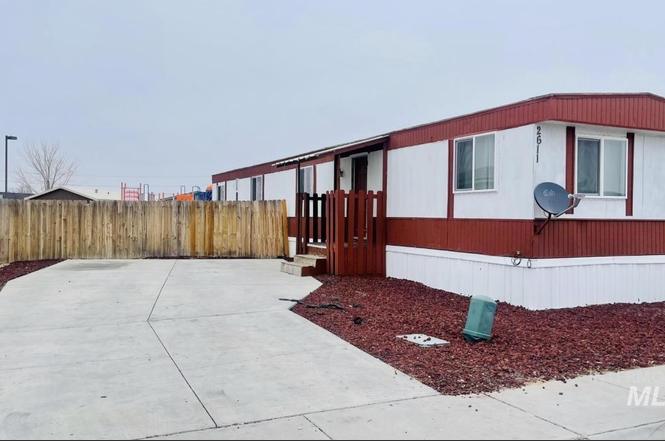
Manufactured home in Indian Creek Estates. Brand new furnace, new A/C, new windows, new weather stripping, fully fenced yard and split bedroom floor plan. Community playground right behind home. Great location close to shopping, restaurants, and minutes away from the freeway. Low lot rent at $360 per month. Sold as-is. Owner Carry option available.
Key facts
- Functional kitchen
- Spacious living area
- Community playground
Tags
Property features AI
Finance
- Other: Subdivision: Indian Creek Su; Directions: From Cleveland Blvd, NE on Linden, Right on Powderhorn Lane
- Financial info: Annual taxes reported
Exterior
- Home design: Mobile/manufactured home on a rented lot; Built in 1979
- Construction: Manufactured home construction
- Exterior features: Full wood fencing; Located in a mobile home park
Interior
- Kitchen: Refrigerator
- Bedrooms: 3 bedrooms, all on the main level
- Bathrooms: 2 bathrooms
- Heating & cooling: Electric heating; Central air conditioning
- Interior features: Central air
Neighborhood map
What this means for you Summary
Snapshot
- This is a 3-bed/2.0-bath manufactured listed at $85k.
Deal economics
- At list price, monthly cash flow is $742 ($9k/yr) — positive.
- The deal already cash-flows at list — no discount required.
- Meets the 1% rule at list price ($2k rent vs $85k).
- Recommended offer: $80k (6.0% below list) — sets the bar for market timing.
- Cap rate 16.8% vs local median 3.1% in Caldwell — top-decile yield for the area; either an underpriced asset or a hidden risk that comps aren't pricing in. Stress-test before assuming the spread holds.
Location & tenants
- Location reads 67/100 on livability (#88 in ID) — a middle-class / working-renter tenant base. Strengths: cost of living A+, housing A+; Watch: crime C-, employment D+, amenities F.
- Caldwell District (suburban): math 17% / reading 31% proficiency, ranked #90 of 92 in ID (top 98%) — low school quality limits family demand, transient renter base, plan for 1-2y turnover; 72% free/reduced lunch — lower-income household profile, screen leases tightly.
- Zoned schools: Van Buren Elementary School (math 23% / reading 28%, grade F, #330 of 357 statewide, top 92%, 561 students, 90% FRL); Caldwell Senior High School (math 16% / reading 38%, grade F, #131 of 169 statewide, top 77%, 1,474 students, 76% FRL).
- Market conditions: Rents rising (+2.7%/yr); 341 active listings in the ZIP; 17 comparable units currently listed for rent nearby; rentals leasing fast (median 13d on market — plan ~1-2 weeks tenant-placement turnaround); 3,620 units permitted in Canyon County in 2024 (196 in 5+ unit buildings).
Forward outlook
- Local home prices are declining (-3.0%/yr); year-one equity from $587 of loan paydown is wiped out by about $3k of value loss. Plan a longer hold.
- Canyon County population projected at +41% by 2050 — long-run rental-demand tailwind backs the buy-and-hold thesis.
- At projected returns (-3.0% appreciation + 2.7% rent growth), your $24k cash investment doubles in ~4 years — after that, you're playing with house money.
Negotiation context
- It's been on market 68 days — a 6% lower offer ($80k) is reasonable based on typical stale-listing flexibility.
- 4 sale attempts since 3y ago with the ask held roughly flat each time — persistent listings suggest the price (not the market) is what's stuck; bring a comps-based counter.
Questions for the listing agent
- It's been on market 68 days. Have you received any prior offers? Is the seller open to a 6% concession, seller financing, or rate buy-down credit?
- Built in 1979 — when were the roof, HVAC, electrical panel, plumbing, and water heater last replaced?
- Why hasn't it sold? Are there any deal-killer items the seller is aware of (foundation, flood, title, zoning, code violations)?
- Is there a deadline driving the sale (1031 exchange, divorce, estate, relocation)? That informs how much negotiation room exists.
- Schools are D-rated, which usually means shorter tenancies and higher turnover. Who's the typical renter profile here, and what's been the actual vacancy rate?
- What's the average days-on-market for RENTAL listings here right now (not sales)? A rising rental-DOM trend means longer vacancies and softer asking-rent achievability than the comps imply.
- What's the recent tenant-quality profile in this submarket — average credit score on applications, eviction rate, late-payment / NSF rate, and stable-employment percentage? A property-management company in the area should have these aggregated.
- How much new for-sale + rental construction is in the pipeline within 1–3 miles? Heavy new supply typically softens prices + rents 12–24 months out; constrained supply supports both.
Investment metrics
- 1% rule
- 1.85% ✓
- Cap rate
- 16.78%
- Cash-on-cash
- 37.47%
- DSCR
- 2.67
- GRM
- 4.5
CMA / ARV
- ARV (on-the-fly)
- $96,096
- Comps found
- 4
Show comp detail 4 sales within ~0.75 mi
| Address | Dist | Beds/Ba | Sqft | Sold | Price | $/sf | Match |
|---|---|---|---|---|---|---|---|
| 2611 Powderhorn Ln | 0.00mi | 3/2.0 | 924 (0%) | 0mo | $84,900 | $92 | 100 |
| 3104 Sage Dr | 0.17mi | 3/2.0 | 960 (+4%) | 5mo | $100,000 | $104 | 82 |
| 3601 Powderhorn Dr | 0.08mi | 3/2.0 | 1,040 (+13%) | 3mo | $124,900 | $120 | 73 |
| 2819 S Georgia Ave #64 | 0.75mi | 2/2.0 (-1) | 924 (0%) | 13mo | $75,000 | $81 | 50 |
Match score weights: distance 35% · size 25% · config 20% · recency 20%. Top-matched comps best support the ARV.
Projected returns pro-forma
-3.0% appreciation · 2.69% rent growth · sell at horizon
- IRR
- 33.1%
- Equity multiple
- 2.39×
- Total profit
- $32,999
- Equity at exit
- $12,659
- IRR
- 39.9%
- Equity multiple
- 4.68×
- Total profit
- $87,493
- Equity at exit
- $7,341
Cash invested: $23,772 (down + closing). Projections, not guarantees.
Landlord ↔ Tenant lean methodology
- Overall (STATE)
- 91 Strongly Landlord-Friendly
- State Idaho
- 91 Strongly Landlord-Friendly · R+18
- County
- — inherits STATE
- City
- — inherits STATE
ZIP-level market 83605
- Home prices YoY
- -27.0%
- Rents YoY
- 2.7%
- Active inventory
- 341
- Price-to-rent
- 4.5×
Monthly cashflow live
- Estimated rent
- $1,568 high interval (Pro) →
- Mortgage (P&I)
- −$445
- Tax from tax record
- −$16 /mo · $192/yr
- Insurance
- −$35
- HOA
- −$0
- Vacancy / Maint / Mgmt
- −$329
- Net cashflow
- $742
Break-even live
Sensitivity live
| Price | -10% $790 | -5% $766 | +0% $742 | +5% $718 | +10% $694 |
|---|---|---|---|---|---|
| Rent | -10% $618 | -5% $680 | +0% $742 | +5% $804 | +10% $866 |
| Rate | -1.0pp $785 | -0.5pp $764 | base $742 | +0.5pp $720 | +1.0pp $698 |
UW: 25.0% down · 7.5% · 30yr · 1.5% tax · 5.0% vac · 8.0% maint · 8.0% mgmt
Financing live
Cash to close
- Down payment
- $21,225
- Closing costs
- $2,547
- Reserves months
- —
- Total cash needed
- —
Loan-product check · same deal, 3 products live
Conventional
25% down · 7.5% · 30yr
- Down + closing
- —
- Monthly P&I
- —
- Monthly cashflow
- —
- DSCR
- —
- Eligible?
- —
Personal DTI + credit; lowest rate.
DSCR
20% down · 8.5% · 30yr
- Down + closing
- —
- Monthly P&I
- —
- Monthly cashflow
- —
- DSCR
- —
- Eligible?
- —
No personal income docs; deal must DSCR.
Hard money
10% down · 12.0% · 12mo
- Down + closing
- —
- Monthly P&I
- —
- Monthly cashflow
- —
- DSCR
- —
- Eligible?
- —
Short-term bridge; refi at stabilization.
Rent comps 17 comps
| Address | Beds | Baths | Sqft | Rent | $/sqft | DOM | Units | Dist |
|---|---|---|---|---|---|---|---|---|
| 3304 S Florida Ave Caldwell, ID | 3.0 | 1.0 | 1000 | $1,395 | $1.40 | 24d | 1 | 0.71mi |
| 2609 Red Robin Way Caldwell, ID | 3.0 | 2.0 | 936 | $1,650 | $1.76 | 12d | 1 | 0.79mi |
| 4612 Lexington Sky Ln Caldwell, ID | 2.0 | 2.0 | 985 | $1,445 | $1.47 | 3d | 1 | 0.85mi |
| 2100 E Maple St Caldwell, ID | 1.0–3.0 | 1.0–1.5 | 930 | $1,350 | $1.45 | 3d | 1 | 1.06mi |
| 4617 Lexington Sky Ln Caldwell, ID | 2.0 | 2.0 | 932 | $1,420 | $1.52 | 3d | 1 | 1.08mi |
| 4703 Lexington Sky Ln Caldwell, ID | 1.0–2.0 | 1.0–2.0 | 838 | $1,445 | $1.72 | 3d | 4 | 1.08mi |
| 2106 Ison Ct Unit 1460907P Caldwell, ID | 2.0 | 2.0 | 957 | $3,066 | $3.20 | 12d | 1 | 1.10mi |
| 2003 E Linden St Unit 2 Caldwell, ID | 2.0 | 1.0 | 930 | $1,250 | $1.34 | 15d | 1 | 1.11mi |
| 1007 Rigby Ln Unit M102 Caldwell, ID | 2.0 | 2.0 | 959 | $1,447 | $1.51 | 24d | 1 | 1.34mi |
| 1002 Wilford Ln Unit V201 Caldwell, ID | 3.0 | 2.0 | 1123 | $1,767 | $1.57 | 4d | 1 | 1.35mi |
| 5109 Farnum Ln Unit G102 Caldwell, ID | 2.0 | 2.0 | 959 | $1,447 | $1.51 | 24d | 1 | 1.36mi |
| 4209 Saylor Ln Caldwell, ID | 2.0 | 2.0 | 1040 | $1,925 | $1.85 | 22d | 1 | 1.40mi |
| 3919 Thatcher Ln Caldwell, ID | 1.0–3.0 | 1.0–2.0 | 1074 | $1,895 | $1.76 | 3d | 41 | 1.42mi |
| 516 Rooster Ln Caldwell, ID | 2.0 | 2.0 | 940 | $1,450 | $1.54 | 3d | 1 | 1.42mi |
| 511 Rooster Ln Caldwell, ID | 2.0 | 2.0 | 940 | $1,450 | $1.54 | 3d | 1 | 1.43mi |
| 3114 Iowa Ave Unit 1 Caldwell, ID | 3.0 | 1.0 | 1020 | $1,500 | $1.47 | 15d | 1 | 1.43mi |
| 2720 Blackfoot Ln Caldwell, ID | 2.0 | 2.0 | 940 | $1,425 | $1.52 | 20d | 1 | 1.49mi |
Listing history 10 events
-
2026-05-08status Pending
-
2026-04-11price $84,900
-
2026-03-06status Active
-
2026-03-03status Pending
-
2026-02-26$85,000 Active
-
2023-04-28soldstatus Sold 350-char remark
Show marketing remark (350 chars)
Manufactured home in Indian Creek Estates. Brand new furnace, new A/C, new windows, new weather stripping, fully fenced yard and split bedroom floor plan. Community playground right behind home. Great location close to shopping, restaurants, and minutes away from the freeway. Low lot rent at $360 per month. Sold as-is. Owner Carry option available.
-
2023-04-17status Pending 350-char remark
Show marketing remark (350 chars)
Manufactured home in Indian Creek Estates. Brand new furnace, new A/C, new windows, new weather stripping, fully fenced yard and split bedroom floor plan. Community playground right behind home. Great location close to shopping, restaurants, and minutes away from the freeway. Low lot rent at $360 per month. Sold as-is. Owner Carry option available.
-
2023-04-06$75,000 Active 350-char remark
Show marketing remark (350 chars)
Manufactured home in Indian Creek Estates. Brand new furnace, new A/C, new windows, new weather stripping, fully fenced yard and split bedroom floor plan. Community playground right behind home. Great location close to shopping, restaurants, and minutes away from the freeway. Low lot rent at $360 per month. Sold as-is. Owner Carry option available.
-
2023-03-30historical
-
2023-03-30$75,000 Active
ⓘ Source: listings_history table (triggers on properties + properties_extension) + one-shot
backfill from property_details.listing_events for pre-trigger history.
Tax reassessment forecast ID · Resets to sale price
- Current annual tax
- $192 · $16/mo
- Projected year-2 tax
- $586 · $49/mo
- Expected delta
- +$394/yr (+$33/mo · 205.0%)
ⓘ Screening estimate from a state-policy table — verify with the county assessor before closing.
Nearby sold comps map
Loading sold comps map…
Walkable amenities ~0.75 mi
Loading nearby amenities…
Taxation est. · year 1
- Rental income
- $18,819
- − Mortgage interest
- −$4,756
- − Property taxes
- −$192
- − Insurance
- −$424
- − Repairs & maintenance
- −$1,505
- − Management
- −$1,505
- − Depreciation
- −$2,470
- Taxable income
- $7,965
- Est. tax owed @ 24.0%
- −$1,912
- After-tax cash flow
- $6,996/yr
For passive investors: Depreciation is non-cash, so a rental often shows a tax loss while cash-flowing — sheltering income. Rental losses are passive: they offset passive income freely, and up to $25,000/yr can offset ordinary (W-2) income if you actively participate and your MAGI is under $100k (phasing out to $0 by $150k); unused losses carry forward. On sale, claimed depreciation is recaptured at up to 25%, and gains may owe capital-gains tax (a 1031 exchange can defer both). Figures are a year-1 estimate at your 24.0% rate — not tax advice; consult a CPA.
Schools (NCES district)
- District
- Caldwell District
- NCES district ID
- 1600510
- Math proficiency
- 17% ▼ -11.00%
- Reading proficiency
- 31% ▼ -4.00%
- Median HH income
- $36,116
- Composite
- 19.85/100
- National rank
- #8694
- State rank
- #90 of 92 in ID
Livability — Caldwell
- Score
- 67/100
- State rank
- #88
- US rank
- #10145
Category grades
Schools grade is shown separately in the Schools card above.
Census & demographics
- Census place
- Caldwell, ID
- County
- Canyon County · 235,358 people
- City population
- 76,816
- Metro
- Boise City, ID
- Population (ZIP)
- 41,325
- Household income
- $68,427
- Rent vs Own
- Severe rent burden
- 719.0
Population outlook (Canyon County) Hauer SSP2
- Today (2025)
- 248,853 people
- By 2030
- 269,596 · +8.3%
- By 2040
- 311,081 · +25.0%
- By 2050
- 350,809 · +41.0%
- By 2075
- 441,884 · +77.6%
- By 2100
- 505,641 · +103.2%
Race, ethnicity, and origin ACS 2023
- Neighborhood character
- Diverse neighborhood (Simpson 0.56)
- Race & ethnicity
- White 51% Hispanic / Latino 42% Two or more races 15% Native American 1%
- Hispanic origin (detail)
- Mexican 36%
- Common ancestry
- Lithuanian 3% Slovak 2% Italian 2%
- Foreign-born
- 13% · Canada
- Languages at home
- 71% English-only · Spanish 27% Russian/Polish/Slavic 1%
Political lean MEDSL · Canyon
- 2024 margin
- Solid R (+46.6) · D 25.4% · R 72.0% · Other 2.5%
- 2008→2024 swing
- -11.4pp toward R · 2008: -35.2pp · 2024: -46.6pp
- All cycles
- 2024: R+46.6 2020: R+39.7 2016: R+41.8 2012: R+37.1 2008: R+35.2
Not yet ingested
- Civics
- —
Market trends
- HPI YoY
- ▼ -135.47%
- Current HPI
- 366.7896
- Rent YoY
- ▲ 2.69%
- Metro
- Boise City, ID
- State GDP YoY
- ▲ 4.51%
- F500 in state
- 6
Industry mix (Fortune 500 HQ in ID)
| Industry | F500 HQs | Revenue |
|---|---|---|
| Retail | 1 | $79B |
|
||
| Technology | 1 | $25B |
|
||
| Food / Agriculture | 1 | $6B |
|
||
Price history
+13.2% since first listed10 events — show timeline
- 2026-05-08 Pending — IMLS
- 2026-04-11 Price Changed $84,900 IMLS
- 2026-03-06 Relisted — IMLS
- 2026-03-03 Pending — IMLS
- 2026-02-26 Listed $85,000 IMLS
- 2023-04-28 Sold (MLS) — IMLS
- 2023-04-17 Pending — IMLS
- 2023-04-06 Listed $75,000 IMLS
- 2023-03-30 Listing Removed — IMLS
- 2023-03-30 Listed $75,000 IMLS
Property tax history
+0.4%/yrLatest (2025): $192 · +26.3% YoY. Source: county tax records.
Cash-flow waterfall
monthlySold comps — $/sqft
last 12 mo · ≤1 miLoading sold comps…