2618 N Tustin Unit D/34 · Santa Ana, CA
Flood risk No data
- FEMA flood zone
- —
- Chance of flooding over 30 yrs
- —
- Est. flood insurance / yr
- —
Fire risk No data
- Est. fire insurance / yr
- —
Heat risk No data
- Hot days now (above threshold)
- —
- Hot days in 30 yrs
- —
Wind risk No data
- Chance of severe wind over 30 yrs
- —
Air-quality risk No data
- Unhealthy air days now
- —
- Unhealthy air days in 30 yrs
- —
Risk factors via First Street. Map © Google.
Why this score? — see what drove the C grade
The composite is a weighted blend of 9 inputs, each scored 0–100. Each bar is that input's sub-score; the figure is the points it added to the 100-point composite (weight × sub-score).
- Cash flow +18.2/30.0
- ARV discount +11.3/15.0
- 1% rule +7.7/10.0
- DSCR +5.7/10.0
- Schools +4.5/10.0
- Condition / age +3.8/5.0
- Rent growth +3.4/5.0
- Livability +2.8/5.0
- Appreciation +0.0/10.0
$320,500
🖨 Deal sheet 📄 Offer letter ✓ Due diligence
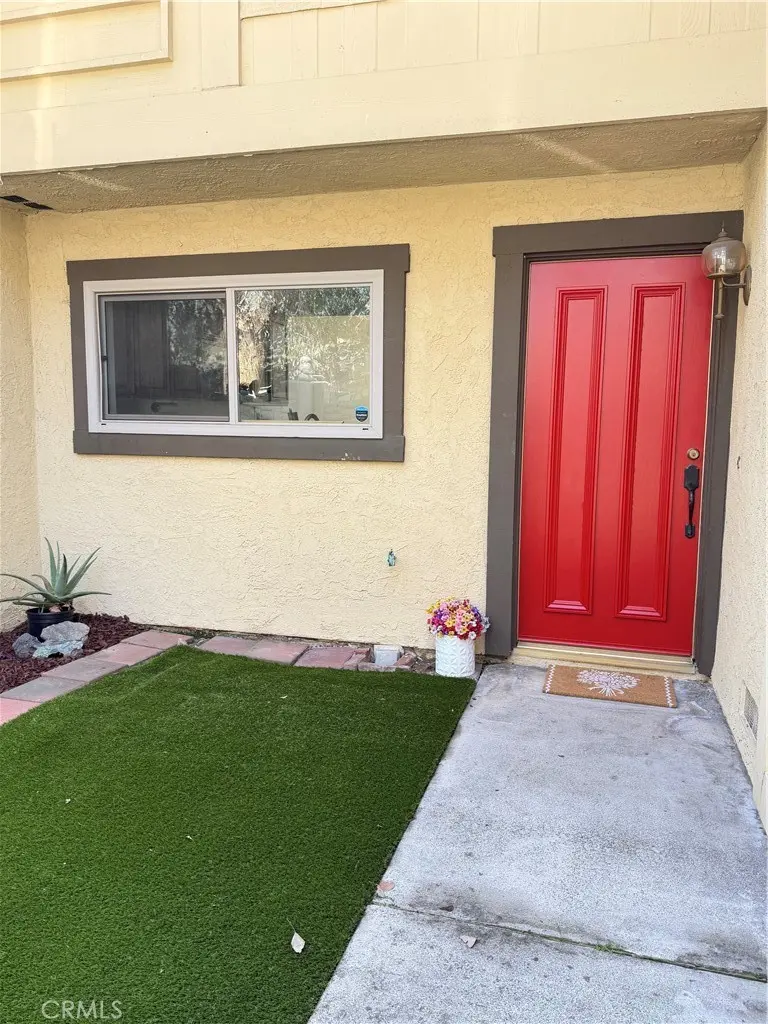
Listing remarks
Nicely Gated Community in the heart of Santa Ana. Yes, this property is on a Land Lease! Come see for yourself. ShadyHollow Community give your privacy and comfort of a family setting. Enjoy this 2-story home with a cozy front enclosed patio that takes you right into your new home ready for your new ideas and changes. definitely ready to move in. Open floor plan with high beam ceilings. Formal dining area big and spacious for entertaining family and friends. Lots of natural light coming through this home. The stairs take you to all 3 bedrooms, large. with Primary having their own suite bathroom. 2 bathrooms upstairs and 1.2 Downstairs for guest. Enjoy your large back patio with lots of roo
Key facts
- Gated community
- Open floor plan
- Natural light
Tags
Property features AI
Finance
- Other: Lot features: 0-1 Unit/Acre; Lot size source: Assessor's data; Year built source: Assessor
- Financial info: Land lease: $1,809 with renewal date December 1, 2049; Special assessments
- HOA & community: Part of association (Kendra; secondary: TSG); Association amenities: Pool, Spa; Association fee $550 monthly (primary); Secondary association fee $155 monthly; Community features: Gutters, Sidewalks; Community size: 150 units
Exterior
- Parking: Attached garage with direct garage access; 2 garage spaces (2 total parking spaces)
- Security: Gated community
- Utilities: Public/district water; Public sewer; Standard electric; Natural gas available; Electricity available; Water available
- Home design: Condominium (attached property); House structure type; Two stories; Entry level: 1; Has a view; One common wall
- Construction: Shingle roof; Concrete and drywall construction; Concrete slab foundation; Block wall and wood fencing
- Exterior features: Front porch; Brick and concrete porch/patio; Patio (slab); See remarks (exterior); Community pool
Interior
- Kitchen: Gas range; Breakfast nook; Tile countertops
- Bedrooms: Two levels with all bedrooms up; Two main-level bedrooms
- Bathrooms: 2 full bathrooms; 1 half bathroom; 1 main-level bathroom
- Heating & cooling: Central furnace heating; Central cooling
- Interior features: Panel doors; Copper plumbing (partial); Ceiling fan; Pantry; Storage space; Tile counters; Wood frame windows; Gated community; Community spa (association)
- Laundry & utility: Laundry area in garage
Neighborhood map
What this means for you Summary
Snapshot
- This is a 3-bed/2.5-bath condo listed at $320k. Condition is rated good.
Deal economics
- At list price, monthly cash flow is $287 ($3k/yr) — positive.
- The deal already cash-flows at list — no discount required.
- Meets the 1% rule at list price ($4k rent vs $320k).
- Recommended offer: $311k (3.0% below list) — sets the bar for market timing.
- Cap rate 7.4% vs local median 2.5% in Santa Ana — top-decile yield for the area; either an underpriced asset or a hidden risk that comps aren't pricing in. Stress-test before assuming the spread holds.
Location & tenants
- Location reads 55/100 on livability (#871 in CA) — a working-class tenant base; expect higher turnover. Strengths: employment A; Watch: schools D, crime D-, amenities F.
- Orange Unified (urban): math 39% / reading 60% proficiency, ranked #127 of 517 in CA (top 25%) — families likely to look elsewhere, expect single-tenant / working-renter base with shorter leases.
- Market conditions: Rents rising (+3.7%/yr); 100 active listings in the ZIP; 33 comparable units currently listed for rent nearby; rentals at typical pace (median 17d on market — plan ~3-4 weeks tenant-placement turnaround); high-income renter base; 6,974 units permitted in Orange County in 2024 (3,839 in 5+ unit buildings).
- This rent runs 38% of the median local income ($129k/yr) — at the standard rent-burdened threshold; future hikes will face affordability resistance.
Forward outlook
- Local home prices are declining (-3.0%/yr); year-one equity from $2k of loan paydown is wiped out by about $10k of value loss. Plan a longer hold.
- Orange County population projected at +14% by 2050 — modest demand growth; plan on rents tracking national, not racing it.
Negotiation context
- It's been on market 48 days — a 3% lower offer ($311k) is reasonable based on typical stale-listing flexibility.
Questions for the listing agent
- It's been on market 48 days. Have you received any prior offers? Is the seller open to a 3% concession, seller financing, or rate buy-down credit?
- Built in 1974 — when were the roof, HVAC, electrical panel, plumbing, and water heater last replaced?
- What does the HOA fee cover, when was the last increase, and are there any pending special assessments or reserve-fund shortfalls?
- Any open or pending special assessments — roof, HVAC, plumbing, elevator, façade? What's the per-unit balance and payoff schedule, and is the seller paying it off at close or rolling it to the buyer?
- Is there a deadline driving the sale (1031 exchange, divorce, estate, relocation)? That informs how much negotiation room exists.
- Schools are D-rated, which usually means shorter tenancies and higher turnover. Who's the typical renter profile here, and what's been the actual vacancy rate?
- Crime grade is D in this area — have there been break-ins, vandalism, or insurance claims at this property in the last 3 years? What carrier currently insures it and at what premium?
- What's the average days-on-market for RENTAL listings here right now (not sales)? A rising rental-DOM trend means longer vacancies and softer asking-rent achievability than the comps imply.
- What's the recent tenant-quality profile in this submarket — average credit score on applications, eviction rate, late-payment / NSF rate, and stable-employment percentage? A property-management company in the area should have these aggregated.
- How much new apartment / multifamily construction is in the pipeline within 1–3 miles? Heavy new supply (>2% of stock underway) typically softens rents 12–24 months out; light construction supports rent growth.
Investment metrics
- 1% rule
- 1.27% ✓
- Cap rate
- 7.37%
- Cash-on-cash
- 3.83%
- DSCR
- 1.17
- GRM
- 6.6
CMA / ARV
- ARV (median comp)
- $350,316
- List price
- $320,500
- Delta
- -8.51%
- Verdict
- FAIR
- Comps
- 20 within 1.0 mi
Projected returns pro-forma
-3.0% appreciation · 3.72% rent growth · sell at horizon
- IRR
- -9.1%
- Equity multiple
- 0.66×
- Total profit
- $-30,229
- Equity at exit
- $47,788
- IRR
- 1.7%
- Equity multiple
- 1.13×
- Total profit
- $11,517
- Equity at exit
- $27,711
Cash invested: $89,740 (down + closing). Projections, not guarantees.
Landlord ↔ Tenant lean methodology
- Overall (STATE)
- 18 Strongly Tenant-Friendly
- State California
- 18 Strongly Tenant-Friendly · D+13
- County
- — inherits STATE
- City
- — inherits STATE
ZIP-level market 92705
- Rents YoY
- 3.7%
- Active inventory
- 100
- Price-to-rent
- 6.6×
Monthly cashflow live
- Estimated rent
- $4,059 high interval (Pro) →
- Mortgage (P&I)
- −$1,681
- Tax est. 1.5%
- −$401 /mo · $4,808/yr
- Insurance
- −$134
- HOA
- −$705
- Vacancy / Maint / Mgmt
- −$852
- Net cashflow
- $287
Break-even live
UW: 25.0% down · 7.5% · 30yr · 1.5% tax · 5.0% vac · 8.0% maint · 8.0% mgmt
Financing live
Cash to close
- Down payment
- $80,125
- Closing costs
- $9,615
- Reserves months
- —
- Total cash needed
- —
Loan-product check · same deal, 3 products live
Conventional
25% down · 7.5% · 30yr
- Down + closing
- —
- Monthly P&I
- —
- Monthly cashflow
- —
- DSCR
- —
- Eligible?
- —
Personal DTI + credit; lowest rate.
DSCR
20% down · 8.5% · 30yr
- Down + closing
- —
- Monthly P&I
- —
- Monthly cashflow
- —
- DSCR
- —
- Eligible?
- —
No personal income docs; deal must DSCR.
Hard money
10% down · 12.0% · 12mo
- Down + closing
- —
- Monthly P&I
- —
- Monthly cashflow
- —
- DSCR
- —
- Eligible?
- —
Short-term bridge; refi at stabilization.
Rent comps 33 comps
| Address | Beds | Baths | Sqft | Rent | $/sqft | DOM | Units | Dist |
|---|---|---|---|---|---|---|---|---|
| 819 S Ponderosa St Orange, CA | 2.0 | 2.0 | 1300 | $2,980 | $2.29 | 43d | 1 | 0.22mi |
| 2243 E Santa Clara Ave Santa Ana, CA | 1.0–2.0 | 1.0–2.0 | 991 | $2,925 | $2.95 | 24d | 3 | 0.45mi |
| 2215 E Avalon Ave Santa Ana, CA | 3.0 | 2.0 | 1315 | $1,400 | $1.06 | 43d | 1 | 0.52mi |
| 2210 E Avalon Ave Unit 2210 Santa Ana, CA | 3.0 | 2.0 | 1325 | $3,800 | $2.87 | 43d | 1 | 0.54mi |
| 1300 Fairhaven Ave Santa Ana, CA | 1.0–2.0 | 1.0–2.0 | 900 | $2,879 | $3.20 | 7d | 5 | 0.85mi |
| 1920 Sherry Ln Santa Ana, CA | 2.0 | 2.0 | 1080 | $2,995 | $2.77 | 24d | 1 | 0.86mi |
| 817 E Palmyra Ave Orange, CA | 2.0 | 2.0 | 1656 | $3,000 | $1.81 | 22d | 1 | 0.91mi |
| 478 S Grand St Orange, CA | 3.0 | 1.0 | 1066 | $4,195 | $3.94 | 15d | 1 | 0.99mi |
| 478 S Grand St Orange, CA | 3.0 | 1.0 | 1066 | $3,995 | $3.75 | 10d | 1 | 0.99mi |
| 480 S Grand St Unit 478 Orange, CA | 3.0 | 1.0 | 1066 | $3,995 | $3.75 | 5d | 1 | 1.00mi |
| 1600 Mabury St Santa Ana, CA | 3.0 | 2.0 | 1480 | $3,595 | $2.43 | 43d | 1 | 1.07mi |
| 2737 Burly Ave Orange, CA | 4.0 | 3.0 | 2062 | $5,750 | $2.79 | 43d | 1 | 1.17mi |
| 181 N Waverly St Orange, CA | 3.0 | 2.0 | 1522 | $4,900 | $3.22 | 43d | 1 | 1.18mi |
| 166 N Cambridge St Orange, CA | 3.0 | 2.0 | 1100 | $3,995 | $3.63 | 17d | 1 | 1.19mi |
| 336 W La Veta Ave Unit D Orange, CA | 2.0 | 2.0 | 1080 | $2,750 | $2.55 | 43d | 1 | 1.21mi |
| 408 W La Veta Ave Orange, CA | 3.0 | 2.0 | 1439 | $4,000 | $2.78 | 43d | 1 | 1.24mi |
| 401 W La Veta Ave Orange, CA | 2.0–3.0 | 2.0–2.5 | 1152 | $3,695 | $3.21 | 10d | 6 | 1.26mi |
| 345 N Shattuck Pl Orange, CA | 3.0 | 1.5 | 1434 | $5,195 | $3.62 | 17d | 1 | 1.33mi |
| 345 N Shattuck Pl Orange, CA | 3.0 | 2.0 | 1421 | $5,195 | $3.66 | 12d | 1 | 1.33mi |
| 227 N Cleveland St Orange, CA | 3.0 | 2.0 | 1200 | $5,495 | $4.58 | 12d | 1 | 1.33mi |
| 250 N Cleveland St Orange, CA | 3.0 | 1.0 | 1280 | $4,500 | $3.52 | 19d | 1 | 1.37mi |
| 191 N Grand St Orange, CA | 4.0 | 2.0 | 1591 | $5,500 | $3.46 | 12d | 1 | 1.39mi |
| 850 W Town and Country Rd Orange, CA | 3.0 | 1.0–2.0 | 1008 | $4,410 | $4.38 | 2d | 27 | 1.39mi |
| 367 N Waverly St Unit 367 Orange, CA | 4.0 | 4.0 | 1578 | $5,995 | $3.80 | 12d | 1 | 1.40mi |
| 243 N Grand St Orange, CA | 3.0 | 2.0 | 1934 | $4,950 | $2.56 | 24d | 1 | 1.44mi |
| 1710 E Fruit St Santa Ana, CA | 3.0 | 2.0 | 2000 | $4,200 | $2.10 | 24d | 1 | 1.45mi |
| 390 N Cambridge St Orange, CA | 4.0 | 3.5 | 2205 | $5,995 | $2.72 | 43d | 1 | 1.46mi |
| 306 N Shaffer St Orange, CA | 3.0 | 2.0 | 1343 | $5,495 | $4.09 | 6d | 1 | 1.46mi |
| 268 N Grand St Orange, CA | 3.0 | 2.0 | 1671 | $4,795 | $2.87 | 2d | 1 | 1.48mi |
| 281 N Grand St Orange, CA | 3.0 | 2.0 | 1200 | $3,500 | $2.92 | 43d | 1 | 1.48mi |
| 264 N Grand St Unit 268N Orange, CA | 3.0 | 2.0 | 1166 | $4,995 | $4.28 | 7d | 1 | 1.48mi |
| 1000 W Town and Country Rd Orange, CA | 3.0 | 1.0–2.0 | 1008 | $4,523 | $4.49 | 2d | 27 | 1.49mi |
| 1055 W Town and Country Rd Orange, CA | 1.0–3.0 | 1.0–2.0 | 1053 | $4,300 | $4.08 | 2d | 5 | 1.49mi |
HOA detail condo
- Monthly dues
- $705 · $8,460/yr
- Likely covers
- security
- Assessments
- None detected in remarks — confirm with the listing agent.
Listing history 15 events
-
2026-06-18days on market $320,500 Active 48 DOM
-
2026-06-17days on market $320,500 Active 47 DOM
-
2026-06-16days on market $320,500 Active 46 DOM
-
2026-06-15days on market $320,500 Active 45 DOM
-
2026-06-13days on market $320,500 Active 43 DOM
-
2026-06-13days on market $320,500 Active 42 DOM
-
2026-06-09days on market $320,500 Active 39 DOM
-
2026-06-08days on market $320,500 Active 38 DOM
-
2026-06-07days on market $320,500 Active 37 DOM
-
2026-06-04days on market $320,500 Active 34 DOM
-
2026-06-03days on market $320,500 Active 33 DOM
-
2026-06-02days on market $320,500 Active 32 DOM
-
2026-06-01days on market $320,500 Active 31 DOM
-
2026-05-31days on market $320,500 Active 30 DOM
-
2026-05-01$335,000 Active 728-char remark
ⓘ Source: listings_history table (triggers on properties + properties_extension) + one-shot
backfill from property_details.listing_events for pre-trigger history.
Nearby sold comps map
Loading sold comps map…
Walkable amenities ~0.75 mi
Loading nearby amenities…
Taxation est. · year 1
- Rental income
- $48,705
- − Mortgage interest
- −$17,953
- − Property taxes
- −$4,808
- − Insurance
- −$1,602
- − Repairs & maintenance
- −$3,896
- − Management
- −$3,896
- − HOA
- −$8,460
- − Depreciation
- −$9,324
- Taxable loss
- −$1,234
- Est. tax savings @ 24.0%
- +$296
- After-tax cash flow
- $3,735/yr
For passive investors: Depreciation is non-cash, so a rental often shows a tax loss while cash-flowing — sheltering income. Rental losses are passive: they offset passive income freely, and up to $25,000/yr can offset ordinary (W-2) income if you actively participate and your MAGI is under $100k (phasing out to $0 by $150k); unused losses carry forward. On sale, claimed depreciation is recaptured at up to 25%, and gains may owe capital-gains tax (a 1031 exchange can defer both). Figures are a year-1 estimate at your 24.0% rate — not tax advice; consult a CPA.
Condition & rehab AI · 10 photos
This 2-story townhouse is in good condition with a good rehab level, ready for cosmetic updates to enhance its resale and rental value.
Value-add opportunities
- Both paint exterior — enhances curb appeal and value
- Both replace window screens — improves energy efficiency and aesthetics
- Both update kitchen cabinets — modernizes the space and adds value
- Both update bathrooms — modernizes the space and adds value
Renovation cost estimate screening
Value-add ROI direction
- Both paint exterior — enhances curb appeal and value ↑
- Both replace window screens — improves energy efficiency and aesthetics ↑
- Both update kitchen cabinets — modernizes the space and adds value ↑
- Both update bathrooms — modernizes the space and adds value ↑
ⓘ Cost ranges are severity-bucket heuristics (US national rule-of-thumb). Get contractor quotes + a written scope before underwriting a rehab budget.
Schools (NCES district)
- District
- Orange Unified
- NCES district ID
- 0628650
- Math proficiency
- 39% ▼ -6.00%
- Reading proficiency
- 60% ▲ 3.00%
- Median HH income
- $83,557
- Composite
- 45.5/100
- National rank
- #2609
- State rank
- #127 of 517 in CA
Livability — Santa Ana
- Score
- 55/100
- State rank
- #871
- US rank
- #23502
Category grades
Schools grade is shown separately in the Schools card above.
Census & demographics
- Census place
- Santa Ana, CA
- County
- Orange County · 3,096,323 people
- City population
- 288,255
- Metro
- Los Angeles-Long Beach-Anaheim, CA
- Population (ZIP)
- 48,781
- Household income
- $129,331
- Rent vs Own
- Severe rent burden
- 1962.0
Population outlook (Orange County) Hauer SSP2
- Today (2025)
- 3,477,456 people
- By 2030
- 3,613,117 · +3.9%
- By 2040
- 3,835,945 · +10.3%
- By 2050
- 3,968,736 · +14.1%
- By 2075
- 4,097,053 · +17.8%
- By 2100
- 3,903,633 · +12.3%
Race, ethnicity, and origin ACS 2023
- Neighborhood character
- Diverse neighborhood (Simpson 0.64)
- Race & ethnicity
- Hispanic / Latino 48% White 34% Two or more races 17% Asian 11% Black 1%
- Hispanic origin (detail)
- Mexican 42%
- Common ancestry
- Lithuanian 2% Italian 1% Romanian 1%
- Foreign-born
- 25% · Canada, Vietnam, China
- Languages at home
- 53% English-only · Spanish 36% Other Indo-European 3% Chinese 2%
Political lean MEDSL · Orange
- 2024 margin
- Toss-up / Even · D 49.7% · R 47.1% · Other 3.2%
- 2008→2024 swing
- +5.2pp toward D · 2008: -2.6pp · 2024: 2.6pp
- All cycles
- 2024: D+2.6 2020: D+9.0 2016: D+7.7 2012: R+8.3 2008: R+2.6
Not yet ingested
- Civics
- —
Market trends
- HPI YoY
- ▼ -831.43%
- Current HPI
- 453.5303
- Rent YoY
- ▲ 3.72%
- Metro
- Los Angeles-Long Beach-Anaheim, CA
- State GDP YoY
- ▲ 3.21%
- F500 in state
- 116
Industry mix (Fortune 500 HQ in CA)
| Industry | F500 HQs | Revenue |
|---|---|---|
| Technology | 27 | $1,492B |
|
||
| Financial Services | 3 | $174B |
|
||
| Retail | 3 | $44B |
|
||
| Insurance | 3 | $26B |
|
||
| Media / Entertainment | 2 | $115B |
|
||
| Pharmaceuticals / Biotech | 2 | $62B |
|
||
Price history
-4.3% since first listed2 events — show timeline
- 2026-05-27 Price Changed $320,500 CRMLS
- 2026-05-01 Listed $335,000 CRMLS
Cash-flow waterfall
monthlySold comps — $/sqft
last 12 mo · ≤1 miLoading sold comps…