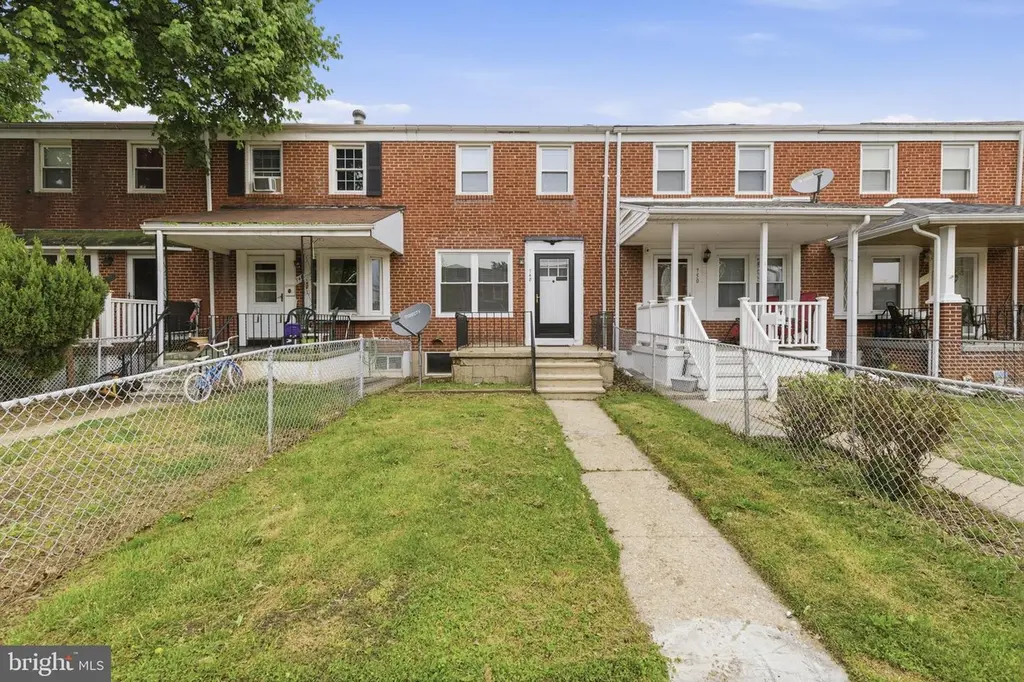
748 Arncliffe Rd · Essex, MD
Flood risk 1/10 · Minimal
- FEMA flood zone
- X (unshaded)
- Chance of flooding over 30 yrs
- 0.0%
- Est. flood insurance / yr
- $473 – $860
Fire risk 1/10 · Minimal
- Est. fire insurance / yr
- $755 – $1,403
Heat risk 8/10 · Major
- Hot days now (above 104°F)
- 7 days/yr
- Hot days in 30 yrs
- 15 days/yr
Wind risk 6/10 · Moderate
- Chance of severe wind over 30 yrs
- 27.0%
Air-quality risk 5/10 · Moderate
- Unhealthy air days now
- 6 days/yr
- Unhealthy air days in 30 yrs
- 8 days/yr
Risk factors via First Street. Map © Google.
Why this score? — see what drove the C grade
The composite is a weighted blend of 9 inputs, each scored 0–100. Each bar is that input's sub-score; the figure is the points it added to the 100-point composite (weight × sub-score).
- Cash flow +24.8/30.0
- DSCR +8.1/10.0
- ARV discount +7.3/15.0
- 1% rule +6.3/10.0
- Livability +4.0/5.0
- Rent growth +2.8/5.0
- Condition / age +2.5/5.0
- Schools +2.3/10.0
- Appreciation +0.0/10.0
$175,000
🖨 Deal sheet 📄 Offer letter ✓ Due diligence
Listing remarks
Welcome to 748 Arncliffe Rd—an incredible opportunity to own an affordable home for under $200K! This charming traditional home offers a functional and inviting layout, perfect for comfortable everyday living. The main level features a spacious living area and a well-appointed kitchen complete with stainless steel appliances, including a dishwasher and electric range. Upstairs, you’ll find two generously sized bedrooms and a full bathroom. The finished basement adds valuable extra living space—ideal for a family room, home office, or guest area. Recent updates include durable LVP flooring, and the home is equipped with gas heat and 100-amp electrical service. Enjoy relaxin
Key facts
- Built 1954
- Listed 48 days
Property features AI
Finance
- Other: Below-grade area: 448 total; Above-grade finished area: 896; Below-grade finished area: 120; Below-grade unfinished area: 328; Year built source: Assessor
- Financial info: Fee simple ownership
Exterior
- Parking: On-street parking (public)
- Utilities: Public water; Public sewer
- Home design: Interior townhouse/rowhouse
- Construction: Brick construction; Brick/mortar foundation; Asphalt roof; Double-pane energy-efficient windows
- Exterior features: Sidewalks
Interior
- Kitchen: Dishwasher; Gas oven/range; Refrigerator; Stainless steel appliances; Exhaust fan; Water heater
- Bedrooms: 2 bedrooms on the first upper level
- Flooring: Fully carpeted; Luxury vinyl plank
- Bathrooms: 1 full bathroom
- Heating & cooling: 90% forced air heating; Natural gas heat; Natural gas hot water
- Interior features: Attic; Tub with shower; Ceiling fans; Dining area; Traditional floor plan; Plaster walls
- Laundry & utility: Washer and dryer in unit; Basement laundry; Full, heated, improved basement with interior access
Neighborhood map
What this means for you Summary
Snapshot
- This is a 2-bed/1.0-bath townhouse listed at $175k.
Deal economics
- At list price, monthly cash flow is $372 ($4k/yr) — positive.
- The deal already cash-flows at list — no discount required.
- Meets the 1% rule at list price ($2k rent vs $175k).
- Recommended offer: $170k (3.0% below list) — sets the bar for market timing.
- Cap rate 8.8% vs local median 4.8% in Essex — top-decile yield for the area; either an underpriced asset or a hidden risk that comps aren't pricing in. Stress-test before assuming the spread holds.
Location & tenants
- Location reads 79/100 on livability (#60 in MD, #2,277 nationally) — a middle-class / working-renter tenant base. Strengths: commute A+, housing A+, health & safety A; Watch: amenities D+, schools D, crime F.
- Baltimore County Public Schools (suburban): math 15% / reading 34% proficiency, ranked #11 of 24 in MD (top 46%) — low school quality limits family demand, transient renter base, plan for 1-2y turnover.
- Market conditions: Rents rising (+1.1%/yr); 138 active listings in the ZIP; 30 comparable units currently listed for rent nearby; rentals at typical pace (median 22d on market — plan ~3-4 weeks tenant-placement turnaround); 1,511 units permitted in Baltimore County in 2024 (643 in 5+ unit buildings).
- This rent runs 35% of the median local income ($67k/yr) — at the standard rent-burdened threshold; future hikes will face affordability resistance.
Forward outlook
- Local home prices are declining (-3.0%/yr); year-one equity from $1k of loan paydown is wiped out by about $5k of value loss. Plan a longer hold.
- Baltimore County population projected at +12% by 2050 — modest demand growth; plan on rents tracking national, not racing it.
Negotiation context
- It's been on market 49 days — a 3% lower offer ($170k) is reasonable based on typical stale-listing flexibility.
- 2 sale attempts since 23y ago; this cycle's ask has dropped $13k (7%) from the opening price — seller is motivated, your offer sets the floor, not the list.
- Current owner paid $64k; list at $175k implies a 173% gain — meaningful room to come down on a strong offer.
Risks & watch-outs
- Watch-outs: built in 1954 — expect roof / HVAC / electrical / plumbing capex.
- Climate carrying-cost: major wind risk, 27% chance of damaging wind over 30y; extreme-heat days projected 7→15/yr by 2055 (HVAC capex compounding) — expect insurance premiums to compound above CPI over the hold.
Questions for the listing agent
- It's been on market 49 days. Have you received any prior offers? Is the seller open to a 3% concession, seller financing, or rate buy-down credit?
- Built in 1954 — when were the roof, HVAC, electrical panel, plumbing, and water heater last replaced?
- Is there a deadline driving the sale (1031 exchange, divorce, estate, relocation)? That informs how much negotiation room exists.
- Schools are D-rated, which usually means shorter tenancies and higher turnover. Who's the typical renter profile here, and what's been the actual vacancy rate?
- Crime grade is F in this area — have there been break-ins, vandalism, or insurance claims at this property in the last 3 years? What carrier currently insures it and at what premium?
- What's the average days-on-market for RENTAL listings here right now (not sales)? A rising rental-DOM trend means longer vacancies and softer asking-rent achievability than the comps imply.
- What's the recent tenant-quality profile in this submarket — average credit score on applications, eviction rate, late-payment / NSF rate, and stable-employment percentage? A property-management company in the area should have these aggregated.
- How much new for-sale + rental construction is in the pipeline within 1–3 miles? Heavy new supply typically softens prices + rents 12–24 months out; constrained supply supports both.
Investment metrics
- 1% rule
- 1.13% ✓
- Cap rate
- 8.84%
- Cash-on-cash
- 9.11%
- DSCR
- 1.41
- GRM
- 7.4
CMA / ARV
- ARV (median comp)
- $174,076
- List price
- $175,000
- Delta
- 0.53%
- Verdict
- FAIR
- Comps
- 20 within 1.0 mi
Show comp detail 12 sales within ~0.75 mi
| Address | Dist | Beds/Ba | Sqft | Sold | Price | $/sf | Match |
|---|---|---|---|---|---|---|---|
| 738 Arncliffe Rd | 0.02mi | 2/1.0 | 1,016 (0%) | 8mo | $180,000 | $177 | 92 |
| 724 Middlesex | 0.06mi | 2/1.5 | 1,016 (0%) | 7mo | $170,000 | $167 | 89 |
| 647 Dunwich Way | 0.09mi | 3/1.5 (+1) | 1,024 (+1%) | 1mo | $147,000 | $144 | 86 |
| 922 Middlesex Rd | 0.19mi | 2/1.0 | 1,046 (+3%) | 10mo | $190,000 | $182 | 78 |
| 1110 N Marlyn Ave | 0.40mi | 2/2.0 | 1,016 (0%) | 11mo | $213,000 | $210 | 68 |
| 417 Torner Rd | 0.10mi | 3/1.0 (+1) | 1,144 (+13%) | 3mo | $207,000 | $181 | 67 |
| 559 Welbrook Rd | 0.30mi | 3/1.0 (+1) | 1,124 (+11%) | 4mo | $175,000 | $156 | 60 |
| 303 Leeanne Rd | 0.64mi | 3/1.0 (+1) | 1,024 (+1%) | 5mo | $182,000 | $178 | 59 |
| 606 Middlesex Rd | 0.19mi | 3/2.0 (+1) | 1,152 (+13%) | 1mo | $252,000 | $219 | 59 |
| 624 Dunwich Way | 0.13mi | 3/1.0 (+1) | 1,152 (+13%) | 10mo | $200,000 | $174 | 58 |
| 1100 N Marlyn Ave | 0.39mi | 3/1.5 (+1) | 1,144 (+13%) | 2mo | $215,000 | $188 | 52 |
| 329 Leeanne Rd | 0.59mi | 3/1.5 (+1) | 1,152 (+13%) | 2mo | $206,000 | $179 | 42 |
Match score weights: distance 35% · size 25% · config 20% · recency 20%. Top-matched comps best support the ARV.
Projected returns pro-forma
-3.0% appreciation · 1.08% rent growth · sell at horizon
- IRR
- -4.7%
- Equity multiple
- 0.83×
- Total profit
- $-8,377
- Equity at exit
- $26,093
- IRR
- 2.7%
- Equity multiple
- 1.17×
- Total profit
- $8,533
- Equity at exit
- $15,131
Cash invested: $49,000 (down + closing). Projections, not guarantees.
Landlord ↔ Tenant lean methodology
- Overall (STATE)
- 27 Tenant-Leaning
- State Maryland
- 27 Tenant-Leaning · D+14
- County
- — inherits STATE
- City
- — inherits STATE
ZIP-level market 21221
- Rents YoY
- 1.1%
- Active inventory
- 138
- Price-to-rent
- 7.4×
Monthly cashflow live
- Estimated rent
- $1,971 high interval (Pro) →
- Mortgage (P&I)
- −$918
- Tax from tax record
- −$194 /mo · $2,333/yr
- Insurance
- −$73
- HOA
- −$0
- Vacancy / Maint / Mgmt
- −$414
- Net cashflow
- $372
Break-even live
UW: 25.0% down · 7.5% · 30yr · 1.5% tax · 5.0% vac · 8.0% maint · 8.0% mgmt
Financing live
Cash to close
- Down payment
- $43,750
- Closing costs
- $5,250
- Reserves months
- —
- Total cash needed
- —
Loan-product check · same deal, 3 products live
Conventional
25% down · 7.5% · 30yr
- Down + closing
- —
- Monthly P&I
- —
- Monthly cashflow
- —
- DSCR
- —
- Eligible?
- —
Personal DTI + credit; lowest rate.
DSCR
20% down · 8.5% · 30yr
- Down + closing
- —
- Monthly P&I
- —
- Monthly cashflow
- —
- DSCR
- —
- Eligible?
- —
No personal income docs; deal must DSCR.
Hard money
10% down · 12.0% · 12mo
- Down + closing
- —
- Monthly P&I
- —
- Monthly cashflow
- —
- DSCR
- —
- Eligible?
- —
Short-term bridge; refi at stabilization.
Rent comps 30 comps
| Address | Beds | Baths | Sqft | Rent | $/sqft | DOM | Units | Dist |
|---|---|---|---|---|---|---|---|---|
| 421 Torner Rd Essex, MD | 3.0 | 2.0 | 1024 | $2,050 | $2.00 | 21d | 1 | 0.10mi |
| 832 N Marlyn Ave Essex, MD | 3.0 | 2.0 | 1416 | $2,300 | $1.62 | 43d | 1 | 0.12mi |
| 153 Bennett Rd Unit Labs Essex, MD | 2.0 | 2.0 | 1196 | $1,800 | $1.51 | 4d | 1 | 0.38mi |
| 233 Orville Rd Essex, MD | 3.0 | 2.0 | 1144 | $1,850 | $1.62 | 43d | 1 | 0.39mi |
| 201 Middleway Rd Middle River, MD | 1.0–2.0 | 1.0 | 750 | $1,571 | $2.09 | 2d | 24 | 0.68mi |
| 54 Stemmers Run Rd Essex, MD | 3.0 | 2.5 | 1260 | $1,950 | $1.55 | 43d | 1 | 0.72mi |
| 4 Essex Ave Unit A Essex, MD | 2.0 | 1.0 | 800 | $1,250 | $1.56 | 23d | 1 | 0.86mi |
| 47 S Hawthorne Rd Middle River, MD | 3.0 | 1.0 | 1024 | $1,900 | $1.86 | 23d | 1 | 0.99mi |
| 60 S Hawthorne Rd Middle River, MD | 3.0 | 1.0 | 1234 | $2,250 | $1.82 | 43d | 1 | 0.99mi |
| 42 Holcumb Ct Middle River, MD | 3.0 | 1.5 | 1452 | $2,200 | $1.52 | 43d | 1 | 1.00mi |
| 2125 Hawthorne Rd Middle River, MD | 3.0 | 2.0 | 1299 | $2,100 | $1.62 | 43d | 1 | 1.06mi |
| 1516 Becklow Ave Middle River, MD | 3.0 | 1.0 | 1144 | $2,100 | $1.84 | 21d | 1 | 1.08mi |
| 120 Kingston Rd Middle River, MD | 3.0 | 2.0 | 1024 | $1,950 | $1.90 | 23d | 1 | 1.11mi |
| 439 Hopkins Landing Dr Essex, MD | 2.0 | 2.0 | 1485 | $1,795 | $1.21 | 10d | 1 | 1.12mi |
| 303 Endsleigh Ave Middle River, MD | 3.0 | 2.0 | 1144 | $1,950 | $1.70 | 21d | 1 | 1.14mi |
| 303 Holly Dr Middle River, MD | 1.0–2.0 | 1.0 | 740 | $1,510 | $2.04 | 2d | 9 | 1.25mi |
| 2202 Firethorn Rd Middle River, MD | 3.0 | 2.5 | 1324 | $2,300 | $1.74 | 43d | 1 | 1.25mi |
| 433 Grovethorn Rd Middle River, MD | 3.0 | 2.0 | 1024 | $2,000 | $1.95 | 21d | 1 | 1.29mi |
| 2203 Redthorn Rd Middle River, MD | 3.0 | 2.0 | 1144 | $2,200 | $1.92 | 10d | 1 | 1.31mi |
| 22 Nakota Ct Middle River, MD | 3.0 | 1.5 | 1194 | $2,000 | $1.68 | 43d | 1 | 1.31mi |
| 2 Chelmsford Ct Middle River, MD | 3.0 | 1.5 | 1122 | $2,100 | $1.87 | 1d | 1 | 1.32mi |
| 28 Ebbing Ct Essex, MD | 3.0 | 2.5 | 1464 | $2,195 | $1.50 | 10d | 1 | 1.33mi |
| 2167 Graythorn Rd Middle River, MD | 3.0 | 1.5 | 1324 | $1,900 | $1.44 | 23d | 1 | 1.38mi |
| 846 Brunswick Rd Essex, MD | 1.0–2.0 | 1.0–2.0 | 500 | $1,241 | $2.48 | 2d | 49 | 1.43mi |
| 846 Brunswick Rd Essex, MD | 2.0 | 1.0 | 500 | $1,272 | $2.54 | 43d | 42 | 1.43mi |
| 706 Seawall Rd Essex, MD | 3.0 | 1.0 | 1114 | $1,900 | $1.71 | 4d | 1 | 1.44mi |
| 2242 Graythorn Rd Middle River, MD | 3.0 | 1.5 | 1024 | $2,195 | $2.14 | 43d | 1 | 1.46mi |
| 1402 Nicolay Way Unit 1 Essex, MD | 3.0 | 1.5 | 1432 | $1,925 | $1.34 | 4d | 1 | 1.48mi |
| 1402 Nicolay Way Essex, MD | 3.0 | 2.0 | 1432 | $1,925 | $1.34 | 3d | 1 | 1.48mi |
| 511 Riverside Rd Essex, MD | 3.0 | 2.0 | 1332 | $2,700 | $2.03 | 16d | 1 | 1.49mi |
Listing history 20 events
-
2026-06-18days on market $175,000 Active 49 DOM
-
2026-06-17days on market $175,000 Active 48 DOM
-
2026-06-16days on market $175,000 Active 47 DOM
-
2026-06-15days on market $175,000 Active 46 DOM
-
2026-06-13pricedays on market $175,000 Active 44 DOM
-
2026-06-09days on market $179,000 Active 40 DOM
-
2026-06-08days on market $179,000 Active 39 DOM
-
2026-06-07days on market $179,000 Active 38 DOM
-
2026-06-04days on market $179,000 Active 35 DOM
-
2026-06-03days on market $179,000 Active 34 DOM
-
2026-06-02days on market $179,000 Active 33 DOM
-
2026-06-01days on market $179,000 Active 32 DOM
-
2026-05-31days on market $179,000 Active 31 DOM
-
2026-05-01$187,890 Active 1121-char remark
-
2026-04-25historical $187,890 1121-char remark
-
2003-12-29soldstatus $64,000
-
2003-12-04soldstatus $64,000
-
2003-11-22historical
-
2003-07-11$74,900
-
1954-08-09soldstatus $9,000
ⓘ Source: listings_history table (triggers on properties + properties_extension) + one-shot
backfill from property_details.listing_events for pre-trigger history.
Tax reassessment forecast MD · Partial reset (capped growth)
- Current annual tax
- $2,333 · $194/mo
- Projected year-2 tax
- $2,333 · $194/mo
- Expected delta
- $0/yr ($0/mo · 0.0%)
ⓘ Screening estimate from a state-policy table — verify with the county assessor before closing.
Climate risk First Street
- Flood 1/10 Low FEMA zone X (unshaded) · 0% chance over 30 yrs
- Wildfire 1/10 Low
- Heat 8/10 Severe 7 d/yr ≥104°F today · 15 d/yr by 30 yrs out
- Wind 6/10 Major 27% chance of damaging wind over 30 yrs
- Air quality 5/10 Major 6 unhealthy d/yr today · 8 by 30 yrs out
Nearby sold comps map
Loading sold comps map…
Walkable amenities ~0.75 mi
Loading nearby amenities…
Taxation est. · year 1
- Rental income
- $23,653
- − Mortgage interest
- −$9,803
- − Property taxes
- −$2,333
- − Insurance
- −$875
- − Repairs & maintenance
- −$1,892
- − Management
- −$1,892
- − Depreciation
- −$5,091
- Taxable income
- $1,767
- Est. tax owed @ 24.0%
- −$424
- After-tax cash flow
- $4,042/yr
For passive investors: Depreciation is non-cash, so a rental often shows a tax loss while cash-flowing — sheltering income. Rental losses are passive: they offset passive income freely, and up to $25,000/yr can offset ordinary (W-2) income if you actively participate and your MAGI is under $100k (phasing out to $0 by $150k); unused losses carry forward. On sale, claimed depreciation is recaptured at up to 25%, and gains may owe capital-gains tax (a 1031 exchange can defer both). Figures are a year-1 estimate at your 24.0% rate — not tax advice; consult a CPA.
Schools (NCES district)
- District
- Baltimore County Public Schools
- NCES district ID
- 2400120
- Math proficiency
- 15% ▼ -16.00%
- Reading proficiency
- 34% ▼ -5.00%
- Median HH income
- $66,746
- Composite
- 23.17/100
- National rank
- #7948
- State rank
- #11 of 24 in MD
Livability — Essex
- Score
- 79/100
- State rank
- #60
- US rank
- #2277
Category grades
Schools grade is shown separately in the Schools card above.
Census & demographics
- Census place
- Essex, MD
- County
- Baltimore County · 769,527 people
- City population
- 43,487
- Metro
- Baltimore-Columbia-Towson, MD
- Population (ZIP)
- 43,487
- Household income
- $67,340
- Rent vs Own
- Severe rent burden
- 1757.0
Population outlook (Baltimore County) Hauer SSP2
- Today (2025)
- 885,518 people
- By 2030
- 909,272 · +2.7%
- By 2040
- 951,547 · +7.5%
- By 2050
- 990,955 · +11.9%
- By 2075
- 1,086,411 · +22.7%
- By 2100
- 1,135,078 · +28.2%
Race, ethnicity, and origin ACS 2023
- Neighborhood character
- Diverse neighborhood (Simpson 0.60)
- Race & ethnicity
- White 54% Black 32% Two or more races 7% Hispanic / Latino 7% Asian 1%
- Hispanic origin (detail)
- Mexican 2% Puerto Rican 1% Dominican 1%
- Common ancestry
- Romanian 5% Lithuanian 1% Slovak 1%
- Foreign-born
- 8% · Canada, China
- Languages at home
- 89% English-only · Spanish 6% French/Haitian/Cajun 1%
Political lean MEDSL · Baltimore
- 2024 margin
- Strong D (+24.5) · D 61.0% · R 36.5% · Other 2.5%
- 2008→2024 swing
- +9.9pp toward D · 2008: 14.6pp · 2024: 24.5pp
- All cycles
- 2024: D+24.5 2020: D+27.0 2016: D+17.4 2012: D+16.4 2008: D+14.6
Not yet ingested
- Civics
- —
Market trends
- HPI YoY
- ▼ -232.14%
- Current HPI
- 237.1069
- Rent YoY
- ▲ 1.08%
- Metro
- Baltimore-Columbia-Towson, MD
- State GDP YoY
- ▲ 2.97%
- F500 in state
- 12
Industry mix (Fortune 500 HQ in MD)
| Industry | F500 HQs | Revenue |
|---|---|---|
| Aerospace / Defense | 1 | $71B |
|
||
| Utilities | 1 | $25B |
|
||
| Hotels | 1 | $24B |
|
||
| Consumer Goods | 1 | $7B |
|
||
| Real Estate | 1 | $6B |
|
||
| Chemicals | 1 | $2B |
|
||
Price history
+1844.4% since first listed9 events — show timeline
- 2026-06-11 Price Changed $175,000 BRIGHT MLS
- 2026-05-26 Price Changed $179,000 BRIGHT MLS
- 2026-05-01 Listed $187,890 BRIGHT MLS
- 2026-04-25 Coming Soon $187,890 BRIGHT MLS
- 2003-12-29 Sold (Public Records) $64,000 Public Records
- 2003-12-04 Sold (MLS) $64,000 MRIS
- 2003-11-22 Delisted — MRIS
- 2003-07-11 Listed $74,900 MRIS
- 1954-08-09 Sold (Public Records) $9,000 Public Records
Property tax history
+2.5%/yrLatest (2025): $2,333 · -3.1% YoY. Source: county tax records.
Cash-flow waterfall
monthlySold comps — $/sqft
last 12 mo · ≤1 miLoading sold comps…