413 NE 7th St · Trenton, FL
Flood risk 4/10 · Minor
- FEMA flood zone
- X
- Chance of flooding over 30 yrs
- 0.2%
- Est. flood insurance / yr
- $507 – $1,088
Fire risk 7/10 · Major
- Est. fire insurance / yr
- $947 – $1,759
Heat risk 8/10 · Major
- Hot days now (above 108°F)
- 7 days/yr
- Hot days in 30 yrs
- 20 days/yr
Wind risk 9/10 · Severe
- Chance of severe wind over 30 yrs
- 99.0%
Air-quality risk 3/10 · Minor
- Unhealthy air days now
- 2 days/yr
- Unhealthy air days in 30 yrs
- 3 days/yr
Risk factors via First Street. Map © Google.
Why this score? — see what drove the D grade
The composite is a weighted blend of 9 inputs, each scored 0–100. Each bar is that input's sub-score; the figure is the points it added to the 100-point composite (weight × sub-score).
- ARV discount +15.0/15.0
- Appreciation +10.0/10.0
- Schools +5.3/10.0
- Livability +3.9/5.0
- Cash flow +3.0/30.0
- Rent growth +2.5/5.0
- Condition / age +2.5/5.0
- 1% rule +0.0/10.0
- DSCR +0.0/10.0
$515,000
🖨 Deal sheet (PDF) 📄 Offer letter ✓ Due diligence
Listing remarks MLS
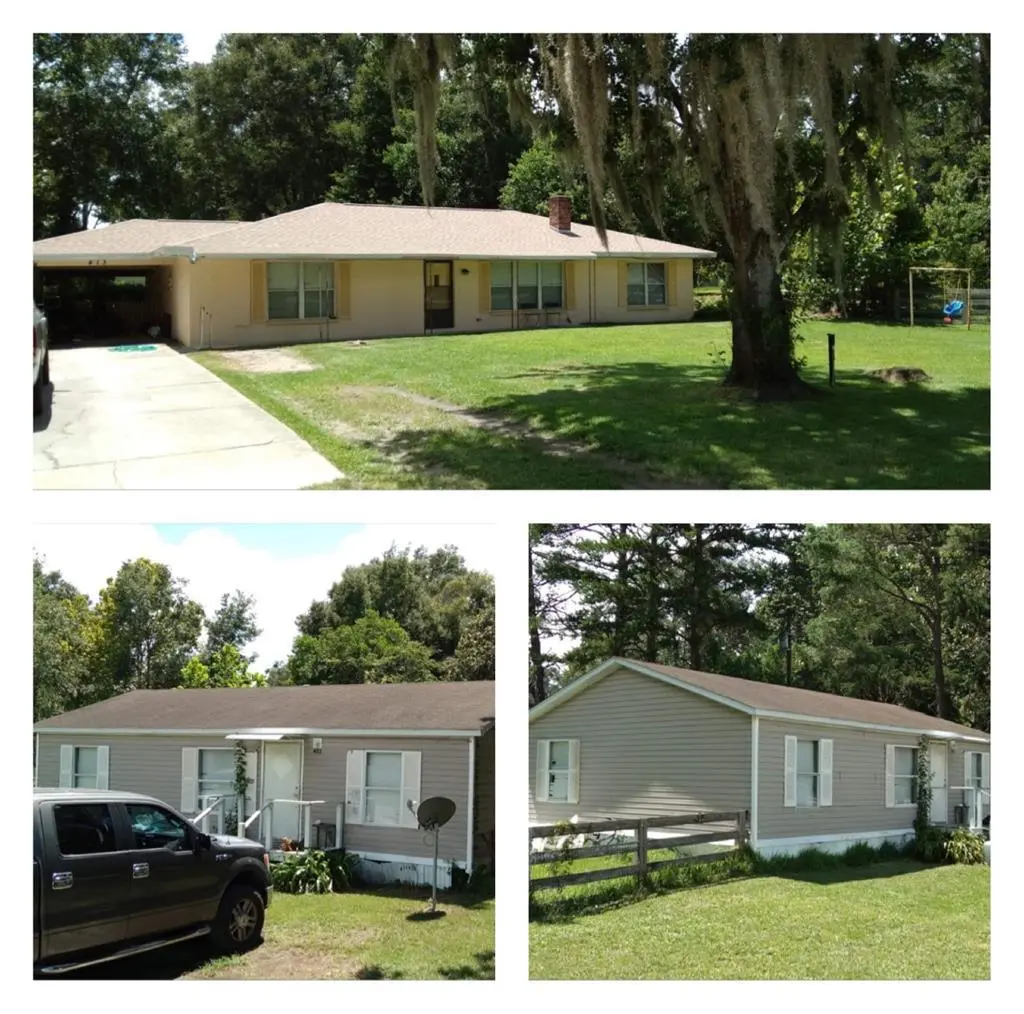
INVESTMENT ALERT - TRENTON FLORIDA! 3 homes in the heart of town! Two 3/2 DW mobile homes and a 4/2 CB home sitting on just over an acre in a beautiful neighborhood. The mobile homes were both manufactured in 2003 and consist of 828 sq ft with an open floor plan. 3 large bedrooms perfect for a small family. The CB home sits in the back of the property and boasts 4 large bedrooms and a bonus room that could easily be used for an office or an additional family room/den. Huge living room with a wood burning fireplace, spacious kitchen and a separate dining room. Long term rental histories and each home is currently occupied. This is a prime turnkey investment opportunity. Call today to schedule a tour!
Key facts
- 1.16 acre lot
- Built 1977
- Listed 1186 days
Neighborhood map
What this means for you Summary
Snapshot
- This is a 3-bed/2.0-bath single-family listed at $515k.
Deal economics
- At list price, monthly cash flow is $-2k ($-20k/yr) — negative.
- To cash-flow at today's rent, offer at most $222k (57.0% below list).
- To meet the 1% rule (rent ≥ 1% of price), the offer needs to be $200k (61.2% below list).
- Recommended offer: $200k (61.2% below list) — sets the bar for 1% rule.
- Cap rate 2.4% vs local median 4.9% in Trenton — below-typical yield; the buyer is paying a premium for something (appreciation thesis, condition, location) that the cap rate doesn't capture.
Location & tenants
- Location reads 77/100 on livability (#207 in FL, #3,078 nationally) — a middle-class / working-renter tenant base. Strengths: crime A+, cost of living A+, housing A+; Watch: amenities F, commute F, employment F.
- Gilchrist (rural): math 66% / reading 61% proficiency, ranked #9 of 73 in FL (top 12%) — acceptable for families but not a draw, mixed tenant base, ~2y average lease.
- Zoned schools: Trenton Elementary School (math 71% / reading 59%, grade B+, #514 of 2,144 statewide, top 24%, 809 students, 58% FRL).
- Market conditions: 198 active listings in the ZIP; 1 comparable units currently listed for rent nearby; 94 units permitted in Gilchrist County in 2024 (0 in 5+ unit buildings).
Forward outlook
- In year one you build about $55k of equity ($4k loan paydown + $52k appreciation (10.0% local appreciation)).
- Gilchrist County population projected to shrink 6% by 2050 — rents likely to lag national; underwrite the cash flow, not the appreciation.
- By year 2, paydown + projected appreciation supports a ~$89k cash-out refi (75% LTV) — recoverable capital for the next deal without selling this one.
Negotiation context
- It's been on market 1186 days — a 12% lower offer ($453k) is reasonable based on typical stale-listing flexibility.
- 6 sale attempts since 26y ago with the ask held roughly flat each time — persistent listings suggest the price (not the market) is what's stuck; bring a comps-based counter.
Risks & watch-outs
- Climate carrying-cost: severe wind risk, 99% chance of damaging wind over 30y; major wildfire risk; extreme-heat days projected 7→20/yr by 2055 (HVAC capex compounding) — expect insurance premiums to compound above CPI over the hold.
Questions for the listing agent
- What do current leases actually rent for vs. the listed asking? Can we see a recent rent roll and the last 12 months of T-12 income?
- It's been on market 1186 days. Have you received any prior offers? Is the seller open to a 61% concession, seller financing, or rate buy-down credit?
- Built in 1977 — when were the roof, HVAC, electrical panel, plumbing, and water heater last replaced?
- Why hasn't it sold? Are there any deal-killer items the seller is aware of (foundation, flood, title, zoning, code violations)?
- Is there a deadline driving the sale (1031 exchange, divorce, estate, relocation)? That informs how much negotiation room exists.
- Schools are B-rated — typically a magnet for longer-tenancy family renters. What's the average tenant stay here, and is there a school-zone premium baked into asking?
- The area grade is low — what's the realistic commute time and amenity access for the typical tenant pool here? Any planned neighborhood developments (good or bad) we should know about?
- What's the average days-on-market for RENTAL listings here right now (not sales)? A rising rental-DOM trend means longer vacancies and softer asking-rent achievability than the comps imply.
- What's the recent tenant-quality profile in this submarket — average credit score on applications, eviction rate, late-payment / NSF rate, and stable-employment percentage? A property-management company in the area should have these aggregated.
- How much new for-sale + rental construction is in the pipeline within 1–3 miles? Heavy new supply typically softens prices + rents 12–24 months out; constrained supply supports both.
Investment metrics
- 1% rule
- 0.39% ✗
- Cap rate
- 2.42%
- Cash-on-cash
- -13.82%
- DSCR
- 0.39
- GRM
- 21.5
CMA / ARV
- ARV (median comp)
- $786,249
- List price
- $515,000
- Delta
- -34.50%
- Verdict
- UNDERPRICED
- Comps
- 2 within 1.0 mi
Show comp detail 5 sales within ~0.75 mi
| Address | Dist | Beds/Ba | Sqft | Sold | Price | $/sf | Match |
|---|---|---|---|---|---|---|---|
| 304 NE 2nd St | 0.29mi | 3/1.0 | 1,806 (-7%) | 2mo | $35,000 | $19 | 68 |
| 310 NE 2nd Ave | 0.28mi | 4/3.0 (+1) | 2,075 (+7%) | 21mo | $233,000 | $112 | 50 |
| 407 SW First St | 0.61mi | 3/2.0 | 1,756 (-10%) | 22mo | $217,600 | $124 | 37 |
| 632 S Main St | 0.64mi | 4/2.0 (+1) | 1,777 (-9%) | 18mo | $315,000 | $177 | 36 |
| 509 NW 5th Ave | 0.71mi | 3/2.0 | 1,740 (-11%) | 22mo | $247,000 | $142 | 31 |
Match score weights: distance 35% · size 25% · config 20% · recency 20%. Top-matched comps best support the ARV.
Projected returns pro-forma
10.0% appreciation · 3.0% rent growth · sell at horizon
- IRR
- 14.6%
- Equity multiple
- 2.21×
- Total profit
- $174,571
- Equity at exit
- $463,953
- IRR
- 14.5%
- Equity multiple
- 5.14×
- Total profit
- $596,912
- Equity at exit
- $1,000,532
Cash invested: $144,200 (down + closing). Projections, not guarantees.
Landlord ↔ Tenant lean methodology
- Overall (STATE)
- 87 Strongly Landlord-Friendly
- State Florida
- 87 Strongly Landlord-Friendly · R+3
- County
- — inherits STATE
- City
- — inherits STATE
ZIP-level market 32693
- Home prices YoY
- 14.8%
- Active inventory
- 198
- Price-to-rent
- 21.5×
Monthly cashflow live
- Estimated rent
- $2,000 medium interval (Pro) →
- Mortgage (P&I)
- −$2,701
- Tax from tax record
- −$325 /mo · $3,900/yr
- Insurance
- −$215
- HOA
- −$0
- Vacancy / Maint / Mgmt
- −$420
- Net cashflow
- $-1,660
Break-even live
Sensitivity live
| Price | -10% $-1,369 | -5% $-1,515 | +0% $-1,660 | +5% $-1,806 | +10% $-1,952 |
|---|---|---|---|---|---|
| Rent | -10% $-1,818 | -5% $-1,739 | +0% $-1,660 | +5% $-1,581 | +10% $-1,502 |
| Rate | -1.0pp $-1,401 | -0.5pp $-1,529 | base $-1,660 | +0.5pp $-1,794 | +1.0pp $-1,930 |
UW: 25.0% down · 7.5% · 30yr · 1.5% tax · 5.0% vac · 8.0% maint · 8.0% mgmt
Financing live
Cash to close
- Down payment
- $128,750
- Closing costs
- $15,450
- Reserves months
- —
- Total cash needed
- —
Loan-product check · same deal, 3 products live
Conventional
25% down · 7.5% · 30yr
- Down + closing
- —
- Monthly P&I
- —
- Monthly cashflow
- —
- DSCR
- —
- Eligible?
- —
Personal DTI + credit; lowest rate.
DSCR
20% down · 8.5% · 30yr
- Down + closing
- —
- Monthly P&I
- —
- Monthly cashflow
- —
- DSCR
- —
- Eligible?
- —
No personal income docs; deal must DSCR.
Hard money
10% down · 12.0% · 12mo
- Down + closing
- —
- Monthly P&I
- —
- Monthly cashflow
- —
- DSCR
- —
- Eligible?
- —
Short-term bridge; refi at stabilization.
Rent comps 1 comps
| Address | Beds | Baths | Sqft | Rent | $/sqft | DOM | Units | Dist |
|---|---|---|---|---|---|---|---|---|
| 407 SW 1st St Trenton, FL | 3.0 | 2.0 | 1508 | $2,000 | $1.33 | 15d | 1 | 0.62mi |
Listing history 25 events
-
2026-06-21days on market $515,000 Active 1186 DOM
-
2026-06-18days on market $515,000 Active 1183 DOM
-
2026-06-17days on market $515,000 Active 1182 DOM
-
2026-06-16days on market $515,000 Active 1181 DOM
-
2026-06-15days on market $515,000 Active 1180 DOM
-
2026-06-14days on market $515,000 Active 1178 DOM
-
2026-06-13days on market $515,000 Active 1177 DOM
-
2026-06-10days on market $515,000 Active 1175 DOM
-
2026-06-09days on market $515,000 Active 1174 DOM
-
2026-06-08days on market $515,000 Active 1173 DOM
-
2026-06-07days on market $515,000 Active 1172 DOM
-
2026-06-05days on market $515,000 Active 1169 DOM
-
2026-06-02days on market $515,000 Active 1167 DOM
-
2026-06-01days on market $515,000 Active 1166 DOM
-
2026-05-31days on market $515,000 Active 1165 DOM
-
2026-05-30days on market $515,000 Active 1164 DOM
-
2025-03-02status Active 708-char remark
Show marketing remark (708 chars)
INVESTMENT ALERT - TRENTON FLORIDA! 3 homes in the heart of town! Two 3/2 DW mobile homes and a 4/2 CB home sitting on just over an acre in a beautiful neighborhood. The mobile homes were both manufactured in 2003 and consist of 828 sq ft with an open floor plan. 3 large bedrooms perfect for a small family. The CB home sits in the back of the property and boasts 4 large bedrooms and a bonus room that could easily be used for an office or an additional family room/den. Huge living room with a wood burning fireplace, spacious kitchen and a separate dining room. Long term rental histories and each home is currently occupied. This is a prime turnkey investment opportunity. Call today to schedule a tour!
-
2024-09-03status Active 708-char remark
Show marketing remark (708 chars)
INVESTMENT ALERT - TRENTON FLORIDA! 3 homes in the heart of town! Two 3/2 DW mobile homes and a 4/2 CB home sitting on just over an acre in a beautiful neighborhood. The mobile homes were both manufactured in 2003 and consist of 828 sq ft with an open floor plan. 3 large bedrooms perfect for a small family. The CB home sits in the back of the property and boasts 4 large bedrooms and a bonus room that could easily be used for an office or an additional family room/den. Huge living room with a wood burning fireplace, spacious kitchen and a separate dining room. Long term rental histories and each home is currently occupied. This is a prime turnkey investment opportunity. Call today to schedule a tour!
-
2023-09-03status Active 708-char remark
Show marketing remark (708 chars)
INVESTMENT ALERT - TRENTON FLORIDA! 3 homes in the heart of town! Two 3/2 DW mobile homes and a 4/2 CB home sitting on just over an acre in a beautiful neighborhood. The mobile homes were both manufactured in 2003 and consist of 828 sq ft with an open floor plan. 3 large bedrooms perfect for a small family. The CB home sits in the back of the property and boasts 4 large bedrooms and a bonus room that could easily be used for an office or an additional family room/den. Huge living room with a wood burning fireplace, spacious kitchen and a separate dining room. Long term rental histories and each home is currently occupied. This is a prime turnkey investment opportunity. Call today to schedule a tour!
-
2023-08-09historical 708-char remark
Show marketing remark (708 chars)
INVESTMENT ALERT - TRENTON FLORIDA! 3 homes in the heart of town! Two 3/2 DW mobile homes and a 4/2 CB home sitting on just over an acre in a beautiful neighborhood. The mobile homes were both manufactured in 2003 and consist of 828 sq ft with an open floor plan. 3 large bedrooms perfect for a small family. The CB home sits in the back of the property and boasts 4 large bedrooms and a bonus room that could easily be used for an office or an additional family room/den. Huge living room with a wood burning fireplace, spacious kitchen and a separate dining room. Long term rental histories and each home is currently occupied. This is a prime turnkey investment opportunity. Call today to schedule a tour!
-
2022-07-28$515,000 Active 708-char remark
Show marketing remark (708 chars)
INVESTMENT ALERT - TRENTON FLORIDA! 3 homes in the heart of town! Two 3/2 DW mobile homes and a 4/2 CB home sitting on just over an acre in a beautiful neighborhood. The mobile homes were both manufactured in 2003 and consist of 828 sq ft with an open floor plan. 3 large bedrooms perfect for a small family. The CB home sits in the back of the property and boasts 4 large bedrooms and a bonus room that could easily be used for an office or an additional family room/den. Huge living room with a wood burning fireplace, spacious kitchen and a separate dining room. Long term rental histories and each home is currently occupied. This is a prime turnkey investment opportunity. Call today to schedule a tour!
-
2021-12-31historical
-
2021-06-16$349,900
-
2001-04-20historical
-
2000-10-20$94,895
ⓘ Source: listings_history table (triggers on properties + properties_extension) + one-shot
backfill from property_details.listing_events for pre-trigger history.
Tax reassessment forecast FL · Resets to sale price
- Current annual tax
- $3,900 · $325/mo
- Projected year-2 tax
- $4,274 · $356/mo
- Expected delta
- +$374/yr (+$31/mo · 9.6%)
ⓘ Screening estimate from a state-policy table — verify with the county assessor before closing.
Climate risk First Street
- Flood 4/10 Moderate FEMA zone X · 20% chance over 30 yrs
- Wildfire 7/10 Severe
- Heat 8/10 Severe 7 d/yr ≥108°F today · 20 d/yr by 30 yrs out
- Wind 9/10 Extreme 99% chance of damaging wind over 30 yrs
- Air quality 3/10 Moderate 2 unhealthy d/yr today · 3 by 30 yrs out
Nearby sold comps map
Loading sold comps map…
Walkable amenities ~0.75 mi
Loading nearby amenities…
Taxation est. · year 1
- Rental income
- $24,000
- − Mortgage interest
- −$28,848
- − Property taxes
- −$3,900
- − Insurance
- −$2,575
- − Repairs & maintenance
- −$1,920
- − Management
- −$1,920
- − Depreciation
- −$14,982
- Taxable loss
- −$30,145
- Est. tax savings @ 24.0%
- +$7,235
- After-tax cash flow
- $-12,689/yr
For passive investors: Depreciation is non-cash, so a rental often shows a tax loss while cash-flowing — sheltering income. Rental losses are passive: they offset passive income freely, and up to $25,000/yr can offset ordinary (W-2) income if you actively participate and your MAGI is under $100k (phasing out to $0 by $150k); unused losses carry forward. On sale, claimed depreciation is recaptured at up to 25%, and gains may owe capital-gains tax (a 1031 exchange can defer both). Figures are a year-1 estimate at your 24.0% rate — not tax advice; consult a CPA.
Schools (NCES district)
- District
- Gilchrist
- NCES district ID
- 1200630
- Math proficiency
- 66% ▼ -4.00%
- Reading proficiency
- 61% ▼ -5.00%
- Median HH income
- $39,610
- Composite
- 53.01/100
- National rank
- #1522
- State rank
- #9 of 73 in FL
Livability — Trenton
- Score
- 77/100
- State rank
- #207
- US rank
- #3078
Category grades
Schools grade is shown separately in the Schools card above.
Census & demographics
- Census place
- Trenton, FL
- Population (ZIP)
- 11,692
Population outlook (Gilchrist County) Hauer SSP2
- Today (2025)
- 17,730 people
- By 2030
- 17,722 · +-0.0%
- By 2040
- 17,393 · -1.9%
- By 2050
- 16,597 · -6.4%
- By 2075
- 14,300 · -19.3%
- By 2100
- 11,498 · -35.1%
Race, ethnicity, and origin ACS 2023
- Neighborhood character
- Predominantly White (82%)
- Race & ethnicity
- White 82% Hispanic / Latino 8% Two or more races 7% Black 5%
- Hispanic origin (detail)
- Mexican 2% Puerto Rican 3%
- Common ancestry
- Lithuanian 4% Slovak 3% Romanian 1%
- Foreign-born
- 4% · Canada
- Languages at home
- 94% English-only · Spanish 5%
Political lean MEDSL · Gilchrist
- 2024 margin
- Solid R (+68.0) · D 15.6% · R 83.6%
- 2008→2024 swing
- -21.2pp toward R · 2008: -46.8pp · 2024: -68.0pp
- All cycles
- 2024: R+68.0 2020: R+64.0 2016: R+62.8 2012: R+51.0 2008: R+46.8
Not yet ingested
- Civics
- —
Market trends
- HPI YoY
- ▲ 46.81%
- Current HPI
- 363.4299
- Rent YoY
- —
- Metro
- —
- State GDP YoY
- ▲ 3.28%
- F500 in state
- 36
Industry mix (Fortune 500 HQ in FL)
| Industry | F500 HQs | Revenue |
|---|---|---|
| Industrial Technology | 2 | $29B |
|
||
| Insurance | 2 | $17B |
|
||
| Retail | 1 | $60B |
|
||
| Technology Distribution | 1 | $58B |
|
||
| Homebuilding | 1 | $35B |
|
||
| Technology Manufacturing | 1 | $35B |
|
||
Price history
+442.7% since first listed9 events — show timeline
- 2025-03-02 Relisted — DGLMLS
- 2024-09-03 Relisted — DGLMLS
- 2023-09-03 Relisted — DGLMLS
- 2023-08-09 Delisted — DGLMLS
- 2022-07-28 Listed $515,000 DGLMLS
- 2021-12-31 Listing Removed — Stellar MLS as Distributed by MLS Grid
- 2021-06-16 Listed $349,900 Stellar MLS as Distributed by MLS Grid
- 2001-04-20 Listing Removed — Stellar MLS as Distributed by MLS Grid
- 2000-10-20 Listed $94,895 Stellar MLS as Distributed by MLS Grid
Property tax history
+7.2%/yrLatest (2025): $3,900 · +3.9% YoY. Source: county tax records.
Cash-flow waterfall
monthlySold comps — $/sqft
last 12 mo · ≤1 miLoading sold comps…