4540 NW 68th St · Coconut Creek, FL
Flood risk 1/10 · Minimal
- FEMA flood zone
- X (unshaded)
- Chance of flooding over 30 yrs
- 0.0%
- Est. flood insurance / yr
- $507 – $1,088
Fire risk 1/10 · Minimal
- Est. fire insurance / yr
- $947 – $1,759
Heat risk 9/10 · Severe
- Hot days now (above 107°F)
- 7 days/yr
- Hot days in 30 yrs
- 25 days/yr
Wind risk 10/10 · Severe
- Chance of severe wind over 30 yrs
- 99.0%
Air-quality risk 3/10 · Minor
- Unhealthy air days now
- 2 days/yr
- Unhealthy air days in 30 yrs
- 3 days/yr
Risk factors via First Street. Map © Google.
Why this score? — see what drove the B+ grade
The composite is a weighted blend of 9 inputs, each scored 0–100. Each bar is that input's sub-score; the figure is the points it added to the 100-point composite (weight × sub-score).
- Cash flow +30.0/30.0
- 1% rule +10.0/10.0
- DSCR +10.0/10.0
- ARV discount +7.5/15.0
- Appreciation +4.6/10.0
- Livability +4.2/5.0
- Schools +4.1/10.0
- Rent growth +2.9/5.0
- Condition / age +2.2/5.0
$65,000
🖨 Deal sheet 📄 Offer letter ✓ Due diligence
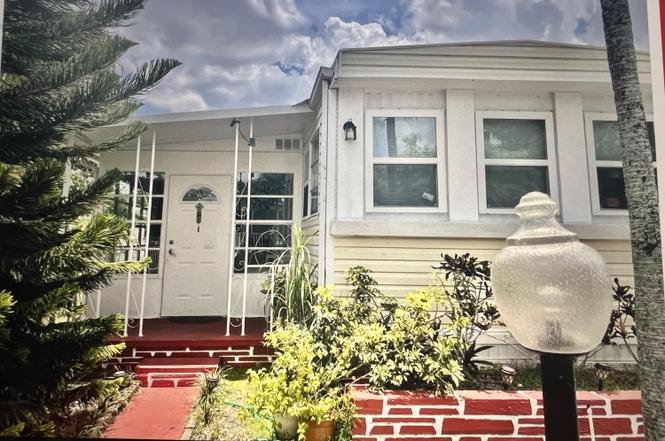
Listing remarks
THIS IS A BEAUTIFUL SINGLE SIZE 2/2 MOBILE HOMES LOCATED IN A GATED COMMUNITY - DEERFIELD LAKE, THE LAND IS NOT INCLUDED AND THE MONTHLY PAYMENT IS $1,170.00, WHICH INCLUDES THE WATER, TRASH REMOVAL, AND LAWN CARE. THE CLUB HOUSE OFFERS LOTS OF ACTIVITIES. THE LOCATION IS JUST 7 MINUTES AWAY FROM DEERFIELD BEACH, MAJOR AIRPORTS, ROADS, SHOPPING CENTS, AND HOSPITALS.
Key facts
- Garage
- Community pool
- Built 1972
Property features AI
Finance
- Other: Pets allowed with possible restrictions (breed, number, and size limits)
- Financial info: Land lease in place (monthly $1,170; expires 2032-06-16)
- HOA & community: Association: DEERFIELD LAKE; Monthly association dues; Association amenities include pool, billiard room, laundry, shuffleboard, and pickleball courts; Association fees cover grounds maintenance, pest control, trash, water, and pool service; Senior community
Exterior
- Parking: 3 open parking spaces; Asphalt, open, detached parking
- Security: Closed-circuit cameras
- Utilities: 100 amp electric service; Public sewer; Water available (other water source); Electricity connected; Sewer connected
- Home design: Mobile home (single wide, model RAMA); One story; Resale condition; Faces north
- Construction: Metal roof; Metal siding and stucco exterior; Aluminum skirting; Mobile home dimensions approximately 56' x 28'; No foundation listed
- Exterior features: Corner lot; Private road frontage; Asphalt road surface; Waterfront (no specific waterfront features); No other structures listed
Interior
- Kitchen: Electric range; Electric cooktop; Microwave; Refrigerator
- Bedrooms: 2 main-level bedrooms
- Flooring: Laminate; Wood
- Bathrooms: 2 full bathrooms (main level)
- Heating & cooling: Electric heating; Central air conditioning
- Interior features: Kitchen island; Blinds
- Laundry & utility: Washer hookup
Neighborhood map
What this means for you Summary
Snapshot
- This is a 2-bed/2.0-bath manufactured listed at $65k. Condition is rated fair.
Deal economics
- At list price, monthly cash flow is $1k ($17k/yr) — positive.
- The deal already cash-flows at list — no discount required.
- Meets the 1% rule at list price ($2k rent vs $65k).
- Cap rate 31.8% vs local median 3.7% in Coconut Creek — top-decile yield for the area; either an underpriced asset or a hidden risk that comps aren't pricing in. Stress-test before assuming the spread holds.
Location & tenants
- Location reads 85/100 on livability (#30 in FL, #617 nationally) — a professional / high-income tenant draw. Strengths: commute A+, housing A+, health & safety A+; Watch: amenities F.
- Broward (suburban): math 42% / reading 53% proficiency, ranked #46 of 73 in FL (top 63%) — families likely to look elsewhere, expect single-tenant / working-renter base with shorter leases.
- Zoned schools: Tradewinds Elementary School (math 49% / reading 55%, grade C-, #990 of 2,144 statewide, top 48%, 972 students, 60% FRL); Lyons Creek Middle School (math 49% / reading 53%, grade C, #237 of 571 statewide, top 43%, 1,757 students, 60% FRL); Monarch High School (math 26% / reading 50%, grade F, #328 of 667 statewide, top 50%, 2,344 students, 54% FRL).
- Market conditions: Rents rising (+1.6%/yr); 150 active listings in the ZIP; 23 comparable units currently listed for rent nearby; rentals leasing fast (median 14d on market — plan ~1-2 weeks tenant-placement turnaround); solid renter incomes; 2,111 units permitted in Broward County in 2024 (1,265 in 5+ unit buildings).
Forward outlook
- Local home prices are declining (-0.8%/yr); year-one equity from $449 of loan paydown is wiped out by about $501 of value loss. Plan a longer hold.
- Broward County population projected at +34% by 2050 — long-run rental-demand tailwind backs the buy-and-hold thesis.
- At projected returns (-0.8% appreciation + 1.6% rent growth), your $18k cash investment doubles in ~2 years — after that, you're playing with house money.
Negotiation context
- Only 2 days on market — expect competitive offers; lowballing is unlikely to land.
Risks & watch-outs
- Climate carrying-cost: severe wind risk, 99% chance of damaging wind over 30y; extreme-heat days projected 7→25/yr by 2055 (HVAC capex compounding) — expect insurance premiums to compound above CPI over the hold.
Questions for the listing agent
- Have any recent inspections been done? Can we get a copy of the seller's disclosures and any deferred-maintenance estimates?
- Built in 1972 — when were the roof, HVAC, electrical panel, plumbing, and water heater last replaced?
- Is there a deadline driving the sale (1031 exchange, divorce, estate, relocation)? That informs how much negotiation room exists.
- Schools are B-rated — typically a magnet for longer-tenancy family renters. What's the average tenant stay here, and is there a school-zone premium baked into asking?
- What's the average days-on-market for RENTAL listings here right now (not sales)? A rising rental-DOM trend means longer vacancies and softer asking-rent achievability than the comps imply.
- What's the recent tenant-quality profile in this submarket — average credit score on applications, eviction rate, late-payment / NSF rate, and stable-employment percentage? A property-management company in the area should have these aggregated.
- How much new for-sale + rental construction is in the pipeline within 1–3 miles? Heavy new supply typically softens prices + rents 12–24 months out; constrained supply supports both.
Investment metrics
- 1% rule
- 3.56% ✓
- Cap rate
- 31.79%
- Cash-on-cash
- 91.07%
- DSCR
- 5.05
- GRM
- 2.3
CMA / ARV
No comps found within radius.
Projected returns pro-forma
-0.77% appreciation · 1.64% rent growth · sell at horizon
- IRR
- 91.6%
- Equity multiple
- 5.43×
- Total profit
- $80,659
- Equity at exit
- $16,407
- IRR
- 93.0%
- Equity multiple
- 10.73×
- Total profit
- $177,163
- Equity at exit
- $17,848
Cash invested: $18,200 (down + closing). Projections, not guarantees.
Landlord ↔ Tenant lean methodology
- Overall (STATE)
- 87 Strongly Landlord-Friendly
- State Florida
- 87 Strongly Landlord-Friendly · R+3
- County
- — inherits STATE
- City
- — inherits STATE
ZIP-level market 33073
- Home prices YoY
- -0.2%
- Rents YoY
- 1.6%
- Active inventory
- 150
- Price-to-rent
- 2.3×
Monthly cashflow live
- Estimated rent
- $2,317 high interval (Pro) →
- Mortgage (P&I)
- −$341
- Tax est. 1.5%
- −$81 /mo · $975/yr
- Insurance
- −$27
- HOA
- −$0
- Vacancy / Maint / Mgmt
- −$487
- Net cashflow
- $1,381
Break-even live
UW: 25.0% down · 7.5% · 30yr · 1.5% tax · 5.0% vac · 8.0% maint · 8.0% mgmt
Financing live
Cash to close
- Down payment
- $16,250
- Closing costs
- $1,950
- Reserves months
- —
- Total cash needed
- —
Loan-product check · same deal, 3 products live
Conventional
25% down · 7.5% · 30yr
- Down + closing
- —
- Monthly P&I
- —
- Monthly cashflow
- —
- DSCR
- —
- Eligible?
- —
Personal DTI + credit; lowest rate.
DSCR
20% down · 8.5% · 30yr
- Down + closing
- —
- Monthly P&I
- —
- Monthly cashflow
- —
- DSCR
- —
- Eligible?
- —
No personal income docs; deal must DSCR.
Hard money
10% down · 12.0% · 12mo
- Down + closing
- —
- Monthly P&I
- —
- Monthly cashflow
- —
- DSCR
- —
- Eligible?
- —
Short-term bridge; refi at stabilization.
Rent comps 23 comps
| Address | Beds | Baths | Sqft | Rent | $/sqft | DOM | Units | Dist |
|---|---|---|---|---|---|---|---|---|
| 5201 W Hillsboro Blvd Coconut Creek, FL | 1.0–3.0 | 1.0–2.0 | 1072 | $2,828 | $2.64 | 1d | 28 | 0.65mi |
| 3600 W Hillsboro Blvd Coconut Creek, FL | 1.0–3.0 | 1.0–2.0 | 1128 | $2,440 | $2.16 | 1d | 13 | 0.77mi |
| 3621 W Hillsboro Blvd Coconut Creek, FL | 1.0–2.0 | 1.0–2.5 | 961 | $2,516 | $2.62 | 1d | 8 | 0.81mi |
| 5500 NW 61st St Unit 13 Coconut Creek, FL | 2.0 | 1.0 | 1015 | $2,075 | $2.04 | 2d | 1 | 1.03mi |
| 5500 NW 61st St Unit 04 402 Coconut Creek, FL | 2.0 | 1.0 | 1015 | $2,075 | $2.04 | 20d | 1 | 1.03mi |
| 6112 N State Road 7 Coconut Creek, FL | 1.0–3.0 | 1.0–2.0 | 1164 | $2,918 | $2.51 | 2d | 34 | 1.03mi |
| 23398 Lyons Rd #309 Boca Raton, FL | 2.0 | 2.0 | 988 | $2,200 | $2.23 | 13d | 1 | 1.08mi |
| 23398 SW 57th Ave Boca Raton, FL | 2.0 | 2.0 | 988 | $2,150 | $2.18 | 4d | 2 | 1.09mi |
| 5580 NW 61st St #627 Coconut Creek, FL | 1.0 | 1.0 | 846 | $1,700 | $2.01 | 20d | 1 | 1.11mi |
| 5400 Lyons Rd Coconut Creek, FL | 1.0–3.0 | 1.0–2.0 | 1072 | $2,384 | $2.22 | 2d | 47 | 1.12mi |
| 5570 NW 61st St #902 Coconut Creek, FL | 2.0 | 1.0 | 1015 | $1,900 | $1.87 | 20d | 1 | 1.12mi |
| 9466 Boca Cove Cir #310 Boca Raton, FL | 2.0 | 2.0 | 770 | $2,000 | $2.60 | 24d | 1 | 1.13mi |
| 5800 NW 74th Pl Coconut Creek, FL | 1.0–2.0 | 1.0–2.0 | 1115 | $2,407 | $2.16 | 2d | 17 | 1.15mi |
| 9503 Boca Cove Cir #603 Boca Raton, FL | 2.0 | 2.0 | 912 | $2,200 | $2.41 | 22d | 1 | 1.16mi |
| 5590 NW 61st St #832 Coconut Creek, FL | 1.0 | 1.0 | 846 | $1,700 | $2.01 | 20d | 1 | 1.17mi |
| 11 NW 45th Ave Deerfield Beach, FL | 1.0–3.0 | 1.0–2.5 | 1097 | $2,645 | $2.41 | 1d | 17 | 1.19mi |
| 5620 NW 61st St #1201 Coconut Creek, FL | 2.0 | 1.0 | 1015 | $2,200 | $2.17 | 24d | 1 | 1.20mi |
| 5851 Holmberg Rd Parkland, FL | 1.0–3.0 | 1.0–2.5 | 1255 | $2,812 | $2.24 | 3d | 32 | 1.24mi |
| 9826 Marina Blvd #1027 Boca Raton, FL | 2.0 | 2.0 | 955 | $2,500 | $2.62 | 24d | 1 | 1.33mi |
| 9780 Marina Blvd #415 Boca Raton, FL | 2.0 | 2.0 | 955 | $2,000 | $2.09 | 24d | 1 | 1.43mi |
| 1620 SW 64th Way Unit H Boca Raton, FL | 2.0 | 2.0 | 1008 | $2,250 | $2.23 | 24d | 1 | 1.47mi |
| 5400 NW 55th Blvd Coconut Creek, FL | 1.0 | 1.0 | 1057 | $2,120 | $2.01 | 4d | 1 | 1.49mi |
| 5400 NW 55th Blvd Coconut Creek, FL | 1.0 | 1.0 | 1057 | $2,102 | $1.99 | 22d | 1 | 1.49mi |
Listing history 3 events
-
2026-06-18days on market $65,000 Active 2 DOM
-
2026-06-17remarks 368-char remark
-
2026-06-17$65,000 Active 1 DOM
ⓘ Source: listings_history table (triggers on properties + properties_extension) + one-shot
backfill from property_details.listing_events for pre-trigger history.
Climate risk First Street
- Flood 1/10 Low FEMA zone X (unshaded) · 0% chance over 30 yrs
- Wildfire 1/10 Low
- Heat 9/10 Extreme 7 d/yr ≥107°F today · 25 d/yr by 30 yrs out
- Wind 10/10 Extreme 99% chance of damaging wind over 30 yrs
- Air quality 3/10 Moderate 2 unhealthy d/yr today · 3 by 30 yrs out
Nearby sold comps map
Loading sold comps map…
Walkable amenities ~0.75 mi
Loading nearby amenities…
Taxation est. · year 1
- Rental income
- $27,804
- − Mortgage interest
- −$3,641
- − Property taxes
- −$975
- − Insurance
- −$325
- − Repairs & maintenance
- −$2,224
- − Management
- −$2,224
- − Depreciation
- −$1,891
- Taxable income
- $16,524
- Est. tax owed @ 24.0%
- −$3,966
- After-tax cash flow
- $12,609/yr
For passive investors: Depreciation is non-cash, so a rental often shows a tax loss while cash-flowing — sheltering income. Rental losses are passive: they offset passive income freely, and up to $25,000/yr can offset ordinary (W-2) income if you actively participate and your MAGI is under $100k (phasing out to $0 by $150k); unused losses carry forward. On sale, claimed depreciation is recaptured at up to 25%, and gains may owe capital-gains tax (a 1031 exchange can defer both). Figures are a year-1 estimate at your 24.0% rate — not tax advice; consult a CPA.
Condition & rehab AI · 1 photo
This manufactured home is in fair condition with good systems and minimal repairs needed. Upgrades to the exterior, landscaping, and interior can significantly enhance its value for both resale and rental.
Value-add opportunities
- Both Paint exterior walls — Fresh paint can enhance curb appeal and the home's overall appearance.
- Both Clean gutters — Clean gutters improve the home's appearance and prevent water damage.
- Both Upgrade landscaping — A more aesthetically pleasing landscape can increase both resale and rental value.
- Both Install new window treatments — New window treatments can improve energy efficiency and add to the home's curb appeal.
- Both Update kitchen appliances — Modern appliances can make the kitchen more functional and appealing to potential buyers/renters.
- Both Install new flooring in bathrooms — Fresh flooring can improve the home's appearance and functionality in the bathrooms.
Renovation cost estimate screening
Value-add ROI direction
- Both Paint exterior walls — Fresh paint can enhance curb appeal and the home's overall appearance. ↑
- Both Clean gutters — Clean gutters improve the home's appearance and prevent water damage. ↑
- Both Upgrade landscaping — A more aesthetically pleasing landscape can increase both resale and rental value. ↑
- Both Install new window treatments — New window treatments can improve energy efficiency and add to the home's curb appeal. ↑
- Both Update kitchen appliances — Modern appliances can make the kitchen more functional and appealing to potential buyers/renters. ↑
- Both Install new flooring in bathrooms — Fresh flooring can improve the home's appearance and functionality in the bathrooms. ↑
ⓘ Cost ranges are severity-bucket heuristics (US national rule-of-thumb). Get contractor quotes + a written scope before underwriting a rehab budget.
Schools (NCES district)
- District
- Broward
- NCES district ID
- 1200180
- Math proficiency
- 42% ▼ -18.00%
- Reading proficiency
- 53% ▼ -5.00%
- Median HH income
- $52,139
- Composite
- 40.88/100
- National rank
- #3621
- State rank
- #46 of 73 in FL
Livability — Coconut Creek
- Score
- 85/100
- State rank
- #30
- US rank
- #617
Category grades
Schools grade is shown separately in the Schools card above.
Census & demographics
- Census place
- Coconut Creek, FL
- County
- Broward County · 1,963,430 people
- City population
- 50,557
- Metro
- Miami-Fort Lauderdale-Pompano Beach, FL
- Population (ZIP)
- 33,838
- Household income
- $97,412
- Rent vs Own
- Severe rent burden
- 1109.0
Population outlook (Broward County) Hauer SSP2
- Today (2025)
- 2,207,033 people
- By 2030
- 2,360,704 · +7.0%
- By 2040
- 2,661,208 · +20.6%
- By 2050
- 2,946,698 · +33.5%
- By 2075
- 3,602,273 · +63.2%
- By 2100
- 3,970,984 · +79.9%
Race, ethnicity, and origin ACS 2023
- Neighborhood character
- Highly diverse neighborhood (Simpson 0.70)
- Race & ethnicity
- White 43% Hispanic / Latino 28% Two or more races 18% Black 17% Asian 3%
- Hispanic origin (detail)
- Mexican 2% Puerto Rican 4% Cuban 4% Dominican 2%
- Common ancestry
- Estonian 6% Hispanic 3% Romanian 2%
- Foreign-born
- 35% · Canada, Jamaica, China
- Languages at home
- 58% English-only · Spanish 23% Other Indo-European 11% French/Haitian/Cajun 4%
Political lean MEDSL · Broward
- 2024 margin
- D (+17.0) · D 58.0% · R 41.0%
- 2008→2024 swing
- -17.8pp toward R · 2008: 34.7pp · 2024: 17.0pp
- All cycles
- 2024: D+17.0 2020: D+29.8 2016: D+35.0 2012: D+34.9 2008: D+34.7
Not yet ingested
- Civics
- —
Market trends
- HPI YoY
- ▼ -0.77%
- Current HPI
- 337.0725
- Rent YoY
- ▲ 1.64%
- Metro
- Miami-Fort Lauderdale-Pompano Beach, FL
- State GDP YoY
- ▲ 3.28%
- F500 in state
- 36
Industry mix (Fortune 500 HQ in FL)
| Industry | F500 HQs | Revenue |
|---|---|---|
| Industrial Technology | 2 | $29B |
|
||
| Insurance | 2 | $17B |
|
||
| Retail | 1 | $60B |
|
||
| Technology Distribution | 1 | $58B |
|
||
| Homebuilding | 1 | $35B |
|
||
| Technology Manufacturing | 1 | $35B |
|
||
Price history
1 event — show timeline
- 2026-06-16 Listed $65,000 Beaches MLS
Cash-flow waterfall
monthlySold comps — $/sqft
last 12 mo · ≤1 miLoading sold comps…