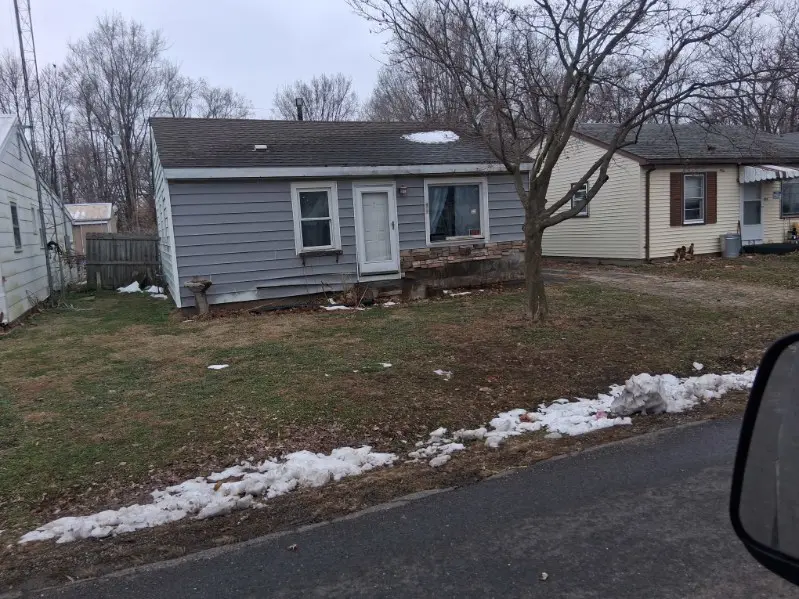
905 N Wesley St · Springfield, IL
Flood risk 1/10 · Minimal
- FEMA flood zone
- X (unshaded)
- Chance of flooding over 30 yrs
- 0.0%
- Est. flood insurance / yr
- $473 – $860
Fire risk 1/10 · Minimal
- Est. fire insurance / yr
- $804 – $1,492
Heat risk 4/10 · Minor
- Hot days now (above 105°F)
- 7 days/yr
- Hot days in 30 yrs
- 20 days/yr
Wind risk 2/10 · Minimal
- Chance of severe wind over 30 yrs
- 1.0%
Air-quality risk 2/10 · Minimal
- Unhealthy air days now
- 1 days/yr
- Unhealthy air days in 30 yrs
- 1 days/yr
Risk factors via First Street. Map © Google.
Why this score? — see what drove the B+ grade
The composite is a weighted blend of 9 inputs, each scored 0–100. Each bar is that input's sub-score; the figure is the points it added to the 100-point composite (weight × sub-score).
- Cash flow +30.0/30.0
- ARV discount +15.0/15.0
- 1% rule +10.0/10.0
- DSCR +10.0/10.0
- Livability +4.0/5.0
- Rent growth +3.7/5.0
- Condition / age +2.5/5.0
- Schools +1.7/10.0
- Appreciation +0.0/10.0
$42,000
🖨 Deal sheet 📄 Offer letter ✓ Due diligence
Listing remarks MLS
Great opportunity in Springfield! This property is perfect for investors or buyers looking to add value. Featuring a solid layout and strong potential, this home is ready for your finishing touches. Whether you're looking for your next flip, rental, or a project to make your own, this property offers plenty of upside. Conveniently located near local amenities, schools, and major roadways. Sold as-is. Don't miss your chance to turn this into a great investment!
Key facts
- Strong potential
- Major roadways
- Solid layout
Tags
Neighborhood map
What this means for you Summary
Snapshot
- This is a 2-bed/1.0-bath single-family listed at $42k.
Deal economics
- At list price, monthly cash flow is $505 ($6k/yr) — positive.
- The deal already cash-flows at list — no discount required.
- Meets the 1% rule at list price ($1k rent vs $42k).
- Recommended offer: $38k (9.0% below list) — sets the bar for market timing.
- Cap rate 20.7% vs local median 4.9% in Springfield — top-decile yield for the area; either an underpriced asset or a hidden risk that comps aren't pricing in. Stress-test before assuming the spread holds.
Location & tenants
- Location reads 79/100 on livability (#122 in IL, #2,138 nationally) — a middle-class / working-renter tenant base. Strengths: amenities A+, commute A+, cost of living A+; Watch: schools D+, crime F.
- Springfield SD 186 (urban): math 17% / reading 22% proficiency, ranked #438 of 620 in IL (top 71%) — low school quality limits family demand, transient renter base, plan for 1-2y turnover; 64% free/reduced lunch — lower-income household profile, screen leases tightly.
- Market conditions: Rents rising fast (+5.0%/yr); 131 active listings in the ZIP; 1 comparable units currently listed for rent nearby; 225 units permitted in Sangamon County in 2024 (48 in 5+ unit buildings).
Forward outlook
- Local home prices are declining (-3.0%/yr); year-one equity from $290 of loan paydown is wiped out by about $1k of value loss. Plan a longer hold.
- Sangamon County population projected to shrink 9% by 2050 — rents likely to lag national; underwrite the cash flow, not the appreciation.
- At projected returns (-3.0% appreciation + 5.0% rent growth), your $12k cash investment doubles in ~3 years — after that, you're playing with house money.
Negotiation context
- It's been on market 92 days — a 9% lower offer ($38k) is reasonable based on typical stale-listing flexibility.
- 2 sale attempts since 30y ago; this cycle's ask has dropped $28k (40%) from the opening price — seller is motivated, your offer sets the floor, not the list.
- Current owner paid $34k; 24% above their basis — modest negotiation headroom, anchor on the comps not their cost.
Risks & watch-outs
- Watch-outs: property tax is 2.8% of price.
Questions for the listing agent
- It's been on market 92 days. Have you received any prior offers? Is the seller open to a 9% concession, seller financing, or rate buy-down credit?
- Property tax is high relative to price — has the assessment been appealed recently, and will the sale trigger a re-assessment?
- Why hasn't it sold? Are there any deal-killer items the seller is aware of (foundation, flood, title, zoning, code violations)?
- Is there a deadline driving the sale (1031 exchange, divorce, estate, relocation)? That informs how much negotiation room exists.
- Schools are D-rated, which usually means shorter tenancies and higher turnover. Who's the typical renter profile here, and what's been the actual vacancy rate?
- Crime grade is F in this area — have there been break-ins, vandalism, or insurance claims at this property in the last 3 years? What carrier currently insures it and at what premium?
- What's the average days-on-market for RENTAL listings here right now (not sales)? A rising rental-DOM trend means longer vacancies and softer asking-rent achievability than the comps imply.
- What's the recent tenant-quality profile in this submarket — average credit score on applications, eviction rate, late-payment / NSF rate, and stable-employment percentage? A property-management company in the area should have these aggregated.
- How much new for-sale + rental construction is in the pipeline within 1–3 miles? Heavy new supply typically softens prices + rents 12–24 months out; constrained supply supports both.
Investment metrics
- 1% rule
- 2.53% ✓
- Cap rate
- 20.71%
- Cash-on-cash
- 51.49%
- DSCR
- 3.29
- GRM
- 3.3
CMA / ARV
- ARV (median comp)
- $66,522
- List price
- $42,000
- Delta
- -36.86%
- Verdict
- UNDERPRICED
- Comps
- 20 within 1.0 mi
Show comp detail 12 sales within ~0.75 mi
| Address | Dist | Beds/Ba | Sqft | Sold | Price | $/sf | Match |
|---|---|---|---|---|---|---|---|
| 3012 Louise Ln | 0.32mi | 2/1.0 | 729 (+4%) | 4mo | $79,900 | $110 | 75 |
| 813 N Stephen Ave | 0.09mi | 2/1.0 | 640 (-9%) | 9mo | $82,000 | $128 | 74 |
| 10 Melody Ln | 0.42mi | 2/1.0 | 712 (+2%) | 7mo | $94,500 | $133 | 71 |
| 2352 E Keys Ave | 0.57mi | 2/1.0 | 718 (+3%) | 2mo | $90,000 | $125 | 68 |
| 2049 E Hamilton Ave | 0.58mi | 2/1.0 | 672 (-4%) | 1mo | $73,001 | $109 | 65 |
| 816 Indiana Ave | 0.70mi | 2/1.0 | 711 (+2%) | 16mo | $31,000 | $44 | 52 |
| 2373 E Keys | 0.59mi | 2/1.0 | 784 (+12%) | 1mo | $85,000 | $108 | 52 |
| 2322 Grandview Ave | 0.45mi | 2/1.0 | 756 (+8%) | 18mo | $77,500 | $103 | 50 |
| 906 N Ohio Ave | 0.62mi | 2/1.0 | 672 (-4%) | 22mo | $50,000 | $74 | 46 |
| 1528 N Wesley St | 0.57mi | 1/1.0 (-1) | 650 (-7%) | 17mo | $67,000 | $103 | 42 |
| 2220 E Grandview Ave | 0.53mi | 2/1.0 | 800 (+14%) | 20mo | $85,000 | $106 | 34 |
| 828 N Ohio St | 0.62mi | 3/2.0 (+1) | 800 (+14%) | 23mo | $110,000 | $138 | 19 |
Match score weights: distance 35% · size 25% · config 20% · recency 20%. Top-matched comps best support the ARV.
Projected returns pro-forma
-3.0% appreciation · 4.95% rent growth · sell at horizon
- IRR
- 51.7%
- Equity multiple
- 3.34×
- Total profit
- $27,502
- Equity at exit
- $6,262
- IRR
- 57.9%
- Equity multiple
- 7.34×
- Total profit
- $74,589
- Equity at exit
- $3,631
Cash invested: $11,760 (down + closing). Projections, not guarantees.
Landlord ↔ Tenant lean methodology
- Overall (STATE)
- 43 Moderately Tenant-Leaning
- State Illinois
- 43 Moderately Tenant-Leaning · D+7
- County
- — inherits STATE
- City
- — inherits STATE
ZIP-level market 62702
- Home prices YoY
- -34.9%
- Rents YoY
- 5.0%
- Active inventory
- 131
- Price-to-rent
- 3.3×
Monthly cashflow live
- Estimated rent
- $1,063 medium interval (Pro) →
- Mortgage (P&I)
- −$220
- Tax from tax record
- −$98 /mo · $1,170/yr
- Insurance
- −$18
- HOA
- −$0
- Vacancy / Maint / Mgmt
- −$223
- Net cashflow
- $505
Break-even live
UW: 25.0% down · 7.5% · 30yr · 1.5% tax · 5.0% vac · 8.0% maint · 8.0% mgmt
Financing live
Cash to close
- Down payment
- $10,500
- Closing costs
- $1,260
- Reserves months
- —
- Total cash needed
- —
Loan-product check · same deal, 3 products live
Conventional
25% down · 7.5% · 30yr
- Down + closing
- —
- Monthly P&I
- —
- Monthly cashflow
- —
- DSCR
- —
- Eligible?
- —
Personal DTI + credit; lowest rate.
DSCR
20% down · 8.5% · 30yr
- Down + closing
- —
- Monthly P&I
- —
- Monthly cashflow
- —
- DSCR
- —
- Eligible?
- —
No personal income docs; deal must DSCR.
Hard money
10% down · 12.0% · 12mo
- Down + closing
- —
- Monthly P&I
- —
- Monthly cashflow
- —
- DSCR
- —
- Eligible?
- —
Short-term bridge; refi at stabilization.
Rent comps 1 comps
| Address | Beds | Baths | Sqft | Rent | $/sqft | DOM | Units | Dist |
|---|---|---|---|---|---|---|---|---|
| 1036 N Indiana Ave Springfield, IL | 2.0 | 1.0 | 672 | $1,100 | $1.64 | 43d | 1 | 0.73mi |
Listing history 20 events
-
2026-06-19days on market $42,000 Active 92 DOM
-
2026-06-18days on market $42,000 Active 91 DOM
-
2026-06-17days on market $42,000 Active 90 DOM
-
2026-06-16days on market $42,000 Active 89 DOM
-
2026-06-15days on market $42,000 Active 88 DOM
-
2026-06-14days on market $42,000 Active 86 DOM
-
2026-06-13pricedays on market $42,000 Active 85 DOM
-
2026-06-10days on market $70,000 Active 83 DOM
-
2026-06-09days on market $70,000 Active 82 DOM
-
2026-06-08days on market $70,000 Active 81 DOM
-
2026-06-07days on market $70,000 Active 80 DOM
-
2026-06-05days on market $70,000 Active 77 DOM
-
2026-06-03days on market $70,000 Active 76 DOM
-
2026-06-02days on market $70,000 Active 75 DOM
-
2026-06-01days on market $70,000 Active 74 DOM
-
2026-05-31days on market $70,000 Active 73 DOM
-
2026-05-30days on market $70,000 Active 72 DOM
-
2026-03-19$70,000 Active 470-char remark
Show marketing remark (470 chars)
Great opportunity in Springfield! This property is perfect for investors or buyers looking to add value. Featuring a solid layout and strong potential, this home is ready for your finishing touches. Whether you're looking for your next flip, rental, or a project to make your own, this property offers plenty of upside. Conveniently located near local amenities, schools, and major roadways. Sold as-is. Don't miss your chance to turn this into a great investment!
-
1996-12-23soldstatus $34,000 188-char remark
Show marketing remark (188 chars)
Cute As A Button. Small But Sweet. Maintenance Free, Vinyl Siding W/ C/A Appl 2 Yrs Old Including Washer & Dryer Stackable. Enced Back Yard With Covered Patio. Freshly Painted Interior
-
1996-10-15$31,900 188-char remark
Show marketing remark (188 chars)
Cute As A Button. Small But Sweet. Maintenance Free, Vinyl Siding W/ C/A Appl 2 Yrs Old Including Washer & Dryer Stackable. Enced Back Yard With Covered Patio. Freshly Painted Interior
ⓘ Source: listings_history table (triggers on properties + properties_extension) + one-shot
backfill from property_details.listing_events for pre-trigger history.
Tax reassessment forecast IL · Partial reset (capped growth)
- Current annual tax
- $1,170 · $98/mo
- Projected year-2 tax
- $1,170 · $98/mo
- Expected delta
- $0/yr ($0/mo · 0.0%)
ⓘ Screening estimate from a state-policy table — verify with the county assessor before closing.
Climate risk First Street
- Flood 1/10 Low FEMA zone X (unshaded) · 0% chance over 30 yrs
- Wildfire 1/10 Low
- Heat 4/10 Moderate 7 d/yr ≥105°F today · 20 d/yr by 30 yrs out
- Wind 2/10 Low 100% chance of damaging wind over 30 yrs
- Air quality 2/10 Low 1 unhealthy d/yr today · 1 by 30 yrs out
Nearby sold comps map
Loading sold comps map…
Walkable amenities ~0.75 mi
Loading nearby amenities…
Taxation est. · year 1
- Rental income
- $12,757
- − Mortgage interest
- −$2,353
- − Property taxes
- −$1,170
- − Insurance
- −$210
- − Repairs & maintenance
- −$1,021
- − Management
- −$1,021
- − Depreciation
- −$1,222
- Taxable income
- $5,762
- Est. tax owed @ 24.0%
- −$1,383
- After-tax cash flow
- $4,672/yr
For passive investors: Depreciation is non-cash, so a rental often shows a tax loss while cash-flowing — sheltering income. Rental losses are passive: they offset passive income freely, and up to $25,000/yr can offset ordinary (W-2) income if you actively participate and your MAGI is under $100k (phasing out to $0 by $150k); unused losses carry forward. On sale, claimed depreciation is recaptured at up to 25%, and gains may owe capital-gains tax (a 1031 exchange can defer both). Figures are a year-1 estimate at your 24.0% rate — not tax advice; consult a CPA.
Schools (NCES district)
- District
- Springfield SD 186
- NCES district ID
- 1737080
- Math proficiency
- 17% ▼ -7.00%
- Reading proficiency
- 22% ▼ -5.00%
- Median HH income
- $43,744
- Composite
- 16.89/100
- National rank
- #9142
- State rank
- #438 of 620 in IL
Livability — Springfield
- Score
- 79/100
- State rank
- #122
- US rank
- #2138
Category grades
Schools grade is shown separately in the Schools card above.
Census & demographics
- County
- Sangamon County · 115,414 people
- City population
- 59,955
- Metro
- Springfield, IL
- Population (ZIP)
- 31,033
- Household income
- $51,136
- Rent vs Own
- Severe rent burden
- 1230.0
Population outlook (Sangamon County) Hauer SSP2
- Today (2025)
- 198,317 people
- By 2030
- 196,127 · -1.1%
- By 2040
- 188,664 · -4.9%
- By 2050
- 179,624 · -9.4%
- By 2075
- 155,027 · -21.8%
- By 2100
- 122,588 · -38.2%
Race, ethnicity, and origin ACS 2023
- Neighborhood character
- Predominantly White (72%)
- Race & ethnicity
- White 72% Black 17% Two or more races 8% Hispanic / Latino 3%
- Common ancestry
- Romanian 2% Slovak 2% Serbian 1%
- Foreign-born
- 2% · Canada
- Languages at home
- 96% English-only · Spanish 1% French/Haitian/Cajun 1% Other Indo-European 1%
Political lean MEDSL · Sangamon
- 2024 margin
- Toss-up / Even · D 46.6% · R 51.6% · Other 1.8%
- 2008→2024 swing
- -9.3pp toward R · 2008: 4.4pp · 2024: -5.0pp
- All cycles
- 2024: R+5.0 2020: R+4.4 2016: R+9.4 2012: R+8.7 2008: D+4.4
Not yet ingested
- Civics
- —
Market trends
- HPI YoY
- ▼ -79.98%
- Current HPI
- 149.1926
- Rent YoY
- ▲ 4.95%
- Metro
- Springfield, IL
- State GDP YoY
- ▲ 1.59%
- F500 in state
- 60
Industry mix (Fortune 500 HQ in IL)
| Industry | F500 HQs | Revenue |
|---|---|---|
| Insurance | 4 | $201B |
|
||
| Consumer Goods | 4 | $87B |
|
||
| Industrial Machinery | 3 | $64B |
|
||
| Healthcare | 2 | $55B |
|
||
| Retail / Pharmacy | 1 | $148B |
|
||
| Agriculture / Food | 1 | $86B |
|
||
Price history
+119.4% since first listed3 events — show timeline
- 2026-03-19 Listed $70,000 MRED as Distributed by MLS Grid
- 1996-12-23 Sold (MLS) $34,000 RMLSA as Distributed by MLS Grid
- 1996-10-15 Listed $31,900 RMLSA as Distributed by MLS Grid
Property tax history
+3.7%/yrLatest (2024): $1,170 · +9.0% YoY. Source: county tax records.
Cash-flow waterfall
monthlySold comps — $/sqft
last 12 mo · ≤1 miLoading sold comps…