 10-Plex
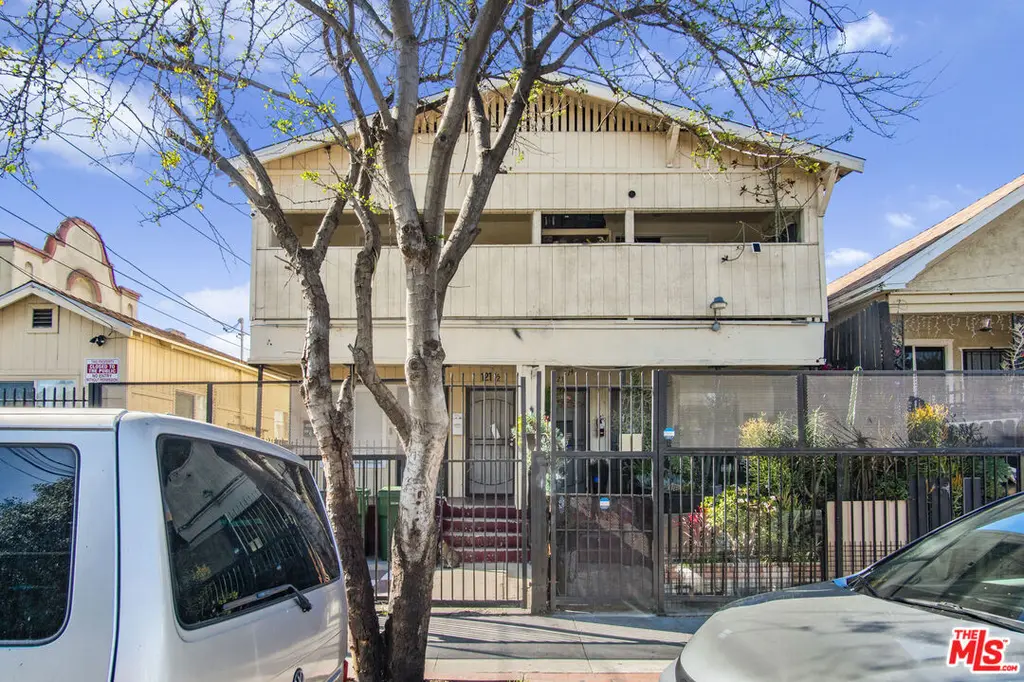
121 S Gless St · Los Angeles, CA
Flood risk 1/10 · Minimal
- FEMA flood zone
- X (unshaded)
- Chance of flooding over 30 yrs
- 0.0%
- Est. flood insurance / yr
- $507 – $1,088
Fire risk 1/10 · Minimal
- Est. fire insurance / yr
- $659 – $1,223
Heat risk 6/10 · Moderate
- Hot days now (above 94°F)
- 7 days/yr
- Hot days in 30 yrs
- 21 days/yr
Wind risk 1/10 · Minimal
- Chance of severe wind over 30 yrs
- —
Air-quality risk 5/10 · Moderate
- Unhealthy air days now
- 9 days/yr
- Unhealthy air days in 30 yrs
- 9 days/yr
Risk factors via First Street. Map © Google.
Why this score? — see what drove the C grade
The composite is a weighted blend of 9 inputs, each scored 0–100. Each bar is that input's sub-score; the figure is the points it added to the 100-point composite (weight × sub-score).
- Cash flow +28.2/30.0
- DSCR +10.0/10.0
- 1% rule +7.1/10.0
- Schools +3.6/10.0
- Livability +3.4/5.0
- Condition / age +2.5/5.0
- Rent growth +1.9/5.0
- ARV discount +0.0/15.0
- Appreciation +0.0/10.0
$1,700,000
🖨 Deal sheet 📄 Offer letter ✓ Due diligence
Multi-family units
County records classify this as Multi-Family (5+ Unit). Listing-text estimate: 10 units. confirmed
5+ unit building — per-unit beds/baths from public records are typically unavailable; the breakdown below (if shown) is an estimate from the listing text.
Listing remarks MLS
We are pleased to present 121 S Gless Street, a value add 10-unit investment opportunity located in the Downtown-adjacent neighborhood of Boyle Heights. The property is comprised of an excellent unit mix of (9) 2 bed / 1 Bath units and (1) 1 Bed/1 Bath unit. There are currently five (5) Section 8 tenants in place, with vouchered 2 bedroom rents currently ranging from $2,015 to $2,504. There are five units that are significantly below market, offering major upside upon turnover. Section 8 Voucher Payment Standards (per HACLA) are currently at $2,887 for 2-bedroom units as of 1/2026. The property will be delivered fully occupied with a gross monthly income of $15,101, or $181,212 annually. The opportunity will yield a strong immediate annual return with approximately 49% remaining rental upside. 121 S Gless Street is centrally located less than a mile from Arts District and Downtown LA with convenient access to the 101, 10, and 5 freeways, USC Keck Hospital, and Cal State LA.
Key facts
- Excellent unit mix
- Fully occupied
- 6,997 sq ft lot
Tags
Neighborhood map
What this means for you Summary
Snapshot
- This is a 9×2bd/1ba + 1×1bd/1ba units multifamily listed at $1.70M.
Deal economics
- At list price, monthly cash flow is $5k ($65k/yr) — positive. Per door: $539/mo.
- The deal already cash-flows at list — no discount required.
- Meets the 1% rule at list price ($21k rent vs $1.70M).
- Recommended offer: $1.50M (12.0% below list) — sets the bar for market timing.
- Cap rate 10.1% vs local median 2.1% in Los Angeles — top-decile yield for the area; either an underpriced asset or a hidden risk that comps aren't pricing in. Stress-test before assuming the spread holds.
Location & tenants
- Location reads 68/100 on livability (#273 in CA) — a middle-class / working-renter tenant base. Strengths: amenities A+, commute A+, employment B; Watch: health & safety C-, schools D+, crime F.
- Los Angeles Unified (urban): math 29% / reading 54% proficiency, ranked #223 of 517 in CA (top 43%) — families likely to look elsewhere, expect single-tenant / working-renter base with shorter leases; 67% free/reduced lunch — lower-income household profile, screen leases tightly.
- Market conditions: Rents soft (-2.3%/yr); 107 active listings in the ZIP; 2 comparable units currently listed for rent nearby; 19,697 units permitted in Los Angeles County in 2024 (9,426 in 5+ unit buildings).
- At $20,533/mo this rent would consume 413% of the median local household income ($60k/yr) (locally 3159% of renters already pay >50% of income on rent) — very limited rent-growth headroom before tenants either downsize or default.
Forward outlook
- Local home prices are declining (-3.0%/yr); year-one equity from $12k of loan paydown is wiped out by about $51k of value loss. Plan a longer hold.
- Los Angeles County population projected at +9% by 2050 — modest demand growth; plan on rents tracking national, not racing it.
Negotiation context
- It's been on market 128 days — a 12% lower offer ($1.50M) is reasonable based on typical stale-listing flexibility.
- Current owner paid $948k; list at $1.70M implies a 79% gain — meaningful room to come down on a strong offer.
Risks & watch-outs
- Watch-outs: built in 1924 — expect roof / HVAC / electrical / plumbing capex.
- Climate carrying-cost: extreme-heat days projected 7→21/yr by 2055 (HVAC capex compounding) — expect insurance premiums to compound above CPI over the hold.
Questions for the listing agent
- It's been on market 128 days. Have you received any prior offers? Is the seller open to a 12% concession, seller financing, or rate buy-down credit?
- Can we see the unit-by-unit rent roll, current vacancy, and any below-market leases? What's the average tenancy length?
- What capital expenditures (roof, boiler, parking lot, exteriors) have been made in the last 5 years, and what's planned in the next 2?
- Built in 1924 — when were the roof, HVAC, electrical panel, plumbing, and water heater last replaced?
- Why hasn't it sold? Are there any deal-killer items the seller is aware of (foundation, flood, title, zoning, code violations)?
- Is there a deadline driving the sale (1031 exchange, divorce, estate, relocation)? That informs how much negotiation room exists.
- Schools are D-rated, which usually means shorter tenancies and higher turnover. Who's the typical renter profile here, and what's been the actual vacancy rate?
- Crime grade is F in this area — have there been break-ins, vandalism, or insurance claims at this property in the last 3 years? What carrier currently insures it and at what premium?
- What's the average days-on-market for RENTAL listings here right now (not sales)? A rising rental-DOM trend means longer vacancies and softer asking-rent achievability than the comps imply.
- What's the recent tenant-quality profile in this submarket — average credit score on applications, eviction rate, late-payment / NSF rate, and stable-employment percentage? A property-management company in the area should have these aggregated.
- How much new apartment / multifamily construction is in the pipeline within 1–3 miles? Heavy new supply (>2% of stock underway) typically softens rents 12–24 months out; light construction supports rent growth.
Investment metrics
- 1% rule
- 1.21% ✓
- Cap rate
- 10.10%
- Cash-on-cash
- 13.58%
- DSCR
- 1.60
- GRM
- 6.9
CMA / ARV
- ARV (median comp)
- $1,168,397
- List price
- $1,700,000
- Delta
- 45.50%
- Verdict
- OVERPRICED
- Comps
- 20 within 1.0 mi
Show comp detail 6 sales within ~0.75 mi
| Address | Dist | Beds/Ba | Sqft | Sold | Price | $/sf | Match |
|---|---|---|---|---|---|---|---|
| 1613 E 1st | 0.08mi | 6/2.0 | 2,800 (+14%) | 1mo | $625,000 | $223 | 68 |
| 1613 Pennsylvania Ave | 0.26mi | 5/5.0 (-1) | 2,578 (+5%) | 3mo | $830,000 | $322 | 64 |
| 1917 E 2nd St | 0.35mi | 7/4.0 (+1) | 2,269 (-8%) | 7mo | $1,238,000 | $546 | 56 |
| 624 S Chicago St | 0.73mi | 5/2.0 (-1) | 2,283 (-7%) | 1mo | $930,000 | $407 | 44 |
| 727 S St Louis St | 0.72mi | 5/3.0 (-1) | 2,120 (-14%) | 0mo | $840,000 | $396 | 38 |
| 673 N Boyle Ave | 0.64mi | 6/2.0 | 2,088 (-15%) | 10mo | $625,000 | $299 | 32 |
Match score weights: distance 35% · size 25% · config 20% · recency 20%. Top-matched comps best support the ARV.
Projected returns pro-forma
-3.0% appreciation · 0.0% rent growth · sell at horizon
- IRR
- 0.4%
- Equity multiple
- 1.02×
- Total profit
- $7,191
- Equity at exit
- $253,476
- IRR
- 6.9%
- Equity multiple
- 1.45×
- Total profit
- $214,471
- Equity at exit
- $146,985
Cash invested: $476,000 (down + closing). Projections, not guarantees.
Landlord ↔ Tenant lean methodology
- Overall (CITY)
- 0 Strongly Tenant-Friendly
- State California
- 18 Strongly Tenant-Friendly · D+13
- County
- — inherits STATE
- City Los Angeles
- 0 Strongly Tenant-Friendly · D+22
ZIP-level market 90033
- Home prices YoY
- -29.9%
- Rents YoY
- -2.3%
- Active inventory
- 107
- Price-to-rent
- 68.0×
Monthly cashflow live
- Estimated rent
- $20,533 high interval (Pro) →
- Mortgage (P&I)
- −$8,915
- Tax from tax record
- −$1,211 /mo · $14,531/yr
- Insurance
- −$708
- HOA
- −$0
- Vacancy / Maint / Mgmt
- −$4,312
- Net cashflow
- $5,387
Break-even live
10-unit breakdown (identical units grouped — click to expand)
| Units | Beds | Baths | Est. rent |
|---|---|---|---|
| 9× units | 2 | 1 | $18,756 |
| #1 | 2 | 1 | $2,084 |
| #2 | 2 | 1 | $2,084 |
| #3 | 2 | 1 | $2,084 |
| #4 | 2 | 1 | $2,084 |
| #5 | 2 | 1 | $2,084 |
| #6 | 2 | 1 | $2,084 |
| #7 | 2 | 1 | $2,084 |
| #8 | 2 | 1 | $2,084 |
| #9 | 2 | 1 | $2,084 |
| 1× unit | 1 | 1 | $1,774 |
| Total (10 units) | $20,533 | ||
UW: 25.0% down · 7.5% · 30yr · 1.5% tax · 5.0% vac · 8.0% maint · 8.0% mgmt
Financing live
Cash to close
- Down payment
- $425,000
- Closing costs
- $51,000
- Reserves months
- —
- Total cash needed
- —
Loan-product check · same deal, 3 products live
Conventional
25% down · 7.5% · 30yr
- Down + closing
- —
- Monthly P&I
- —
- Monthly cashflow
- —
- DSCR
- —
- Eligible?
- —
Personal DTI + credit; lowest rate.
DSCR
20% down · 8.5% · 30yr
- Down + closing
- —
- Monthly P&I
- —
- Monthly cashflow
- —
- DSCR
- —
- Eligible?
- —
No personal income docs; deal must DSCR.
Hard money
10% down · 12.0% · 12mo
- Down + closing
- —
- Monthly P&I
- —
- Monthly cashflow
- —
- DSCR
- —
- Eligible?
- —
Short-term bridge; refi at stabilization.
Rent comps 2 comps
| Address | Beds | Baths | Sqft | Rent | $/sqft | DOM | Units | Dist |
|---|---|---|---|---|---|---|---|---|
| 644 N Boyle Ave Los Angeles, CA | 5.0 | 4.5 | 1872 | $4,050 | $2.16 | 43d | 1 | 0.58mi |
| 2843 Folsom St Unit 2845E Los Angeles, CA | 5.0 | 5.0 | 1825 | $4,495 | $2.46 | 15d | 1 | 1.36mi |
Listing history 15 events
-
2026-06-18days on market $1,700,000 Active 128 DOM
-
2026-06-17days on market $1,700,000 Active 127 DOM
-
2026-06-16days on market $1,700,000 Active 126 DOM
-
2026-06-15days on market $1,700,000 Active 125 DOM
-
2026-06-13days on market $1,700,000 Active 123 DOM
-
2026-06-09days on market $1,700,000 Active 119 DOM
-
2026-06-08days on market $1,700,000 Active 118 DOM
-
2026-06-07days on market $1,700,000 Active 117 DOM
-
2026-06-04days on market $1,700,000 Active 114 DOM
-
2026-06-03days on market $1,700,000 Active 113 DOM
-
2026-06-02days on market $1,700,000 Active 112 DOM
-
2026-06-01days on market $1,700,000 Active 111 DOM
-
2026-05-31days on market $1,700,000 Active 110 DOM
-
2026-02-10$1,700,000 Active 990-char remark
Show marketing remark (990 chars)
We are pleased to present 121 S Gless Street, a value add 10-unit investment opportunity located in the Downtown-adjacent neighborhood of Boyle Heights. The property is comprised of an excellent unit mix of (9) 2 bed / 1 Bath units and (1) 1 Bed/1 Bath unit. There are currently five (5) Section 8 tenants in place, with vouchered 2 bedroom rents currently ranging from $2,015 to $2,504. There are five units that are significantly below market, offering major upside upon turnover. Section 8 Voucher Payment Standards (per HACLA) are currently at $2,887 for 2-bedroom units as of 1/2026. The property will be delivered fully occupied with a gross monthly income of $15,101, or $181,212 annually. The opportunity will yield a strong immediate annual return with approximately 49% remaining rental upside. 121 S Gless Street is centrally located less than a mile from Arts District and Downtown LA with convenient access to the 101, 10, and 5 freeways, USC Keck Hospital, and Cal State LA.
-
2016-04-11soldstatus $948,500
ⓘ Source: listings_history table (triggers on properties + properties_extension) + one-shot
backfill from property_details.listing_events for pre-trigger history.
Tax reassessment forecast CA · Resets to sale price
- Current annual tax
- $14,531 · $1,211/mo
- Projected year-2 tax
- $14,531 · $1,211/mo
- Expected delta
- $0/yr ($0/mo · 0.0%)
ⓘ Screening estimate from a state-policy table — verify with the county assessor before closing.
Climate risk First Street
- Flood 1/10 Low FEMA zone X (unshaded) · 0% chance over 30 yrs
- Wildfire 1/10 Low
- Heat 6/10 Major 7 d/yr ≥94°F today · 21 d/yr by 30 yrs out
- Wind 1/10 Low
- Air quality 5/10 Major 9 unhealthy d/yr today · 9 by 30 yrs out
Nearby sold comps map
Loading sold comps map…
Walkable amenities ~0.75 mi
Loading nearby amenities…
Taxation est. · year 1
- Rental income
- $246,396
- − Mortgage interest
- −$95,226
- − Property taxes
- −$14,531
- − Insurance
- −$8,500
- − Repairs & maintenance
- −$19,712
- − Management
- −$19,712
- − Depreciation
- −$49,455
- Taxable income
- $39,261
- Est. tax owed @ 24.0%
- −$9,423
- After-tax cash flow
- $55,219/yr
For passive investors: Depreciation is non-cash, so a rental often shows a tax loss while cash-flowing — sheltering income. Rental losses are passive: they offset passive income freely, and up to $25,000/yr can offset ordinary (W-2) income if you actively participate and your MAGI is under $100k (phasing out to $0 by $150k); unused losses carry forward. On sale, claimed depreciation is recaptured at up to 25%, and gains may owe capital-gains tax (a 1031 exchange can defer both). Figures are a year-1 estimate at your 24.0% rate — not tax advice; consult a CPA.
Schools (NCES district)
- District
- Los Angeles Unified
- NCES district ID
- 0622710
- Math proficiency
- 29% ▼ -4.00%
- Reading proficiency
- 54% ▲ 10.00%
- Median HH income
- $50,403
- Composite
- 35.67/100
- National rank
- #4875
- State rank
- #223 of 517 in CA
Livability — Los Angeles
- Score
- 68/100
- State rank
- #273
- US rank
- #9237
Category grades
Schools grade is shown separately in the Schools card above.
Census & demographics
- Census place
- Los Angeles, CA
- County
- Los Angeles County · 9,444,647 people
- City population
- 3,838,149
- Metro
- Los Angeles-Long Beach-Anaheim, CA
- Population (ZIP)
- 45,647
- Household income
- $59,652
- Rent vs Own
- Severe rent burden
- 3159.0
Population outlook (Los Angeles County) Hauer SSP2
- Today (2025)
- 10,940,515 people
- By 2030
- 11,256,481 · +2.9%
- By 2040
- 11,729,929 · +7.2%
- By 2050
- 11,948,407 · +9.2%
- By 2075
- 11,818,114 · +8.0%
- By 2100
- 10,842,928 · -0.9%
Race, ethnicity, and origin ACS 2023
- Neighborhood character
- Predominantly Hispanic (90%)
- Race & ethnicity
- Hispanic / Latino 90% Two or more races 13% Asian 4% White 3% Native American 3% Black 1%
- Hispanic origin (detail)
- Mexican 75%
- Foreign-born
- 43% · Canada, South Korea, China
- Languages at home
- 16% English-only · Spanish 80% Other Asian/Pacific 1% Korean 1%
Political lean MEDSL · Los Angeles
- 2024 margin
- Solid D (+32.9) · D 64.8% · R 31.9% · Other 3.3%
- 2008→2024 swing
- -7.4pp toward R · 2008: 40.4pp · 2024: 32.9pp
- All cycles
- 2024: D+32.9 2020: D+44.2 2016: D+48.0 2012: D+40.0 2008: D+40.4
Not yet ingested
- Civics
- —
Market trends
- HPI YoY
- ▼ -201.59%
- Current HPI
- 472.4588
- Rent YoY
- ▼ -2.34%
- Metro
- Los Angeles-Long Beach-Anaheim, CA
- State GDP YoY
- ▲ 3.21%
- F500 in state
- 116
Industry mix (Fortune 500 HQ in CA)
| Industry | F500 HQs | Revenue |
|---|---|---|
| Technology | 27 | $1,492B |
|
||
| Financial Services | 3 | $174B |
|
||
| Retail | 3 | $44B |
|
||
| Insurance | 3 | $26B |
|
||
| Media / Entertainment | 2 | $115B |
|
||
| Pharmaceuticals / Biotech | 2 | $62B |
|
||
Price history
+79.2% since first listed2 events — show timeline
- 2026-02-10 Listed $1,700,000 TheMLS
- 2016-04-11 Sold (Public Records) $948,500 Public Records
Property tax history
+15.0%/yrLatest (2025): $14,531 · +1.4% YoY. Source: county tax records.
Cash-flow waterfall
monthlySold comps — $/sqft
last 12 mo · ≤1 miLoading sold comps…