 🏗️ New Construction
19646 Costa Marra Dr · Houston, TX
Flood risk No data
- FEMA flood zone
- —
- Chance of flooding over 30 yrs
- —
- Est. flood insurance / yr
- —
Fire risk No data
- Est. fire insurance / yr
- —
Heat risk No data
- Hot days now (above threshold)
- —
- Hot days in 30 yrs
- —
Wind risk No data
- Chance of severe wind over 30 yrs
- —
Air-quality risk No data
- Unhealthy air days now
- —
- Unhealthy air days in 30 yrs
- —
Risk factors via First Street. Map © Google.
Why this score? — see what drove the F grade
The composite is a weighted blend of 9 inputs, each scored 0–100. Each bar is that input's sub-score; the figure is the points it added to the 100-point composite (weight × sub-score).
- ARV discount +7.5/15.0
- Cash flow +7.4/30.0
- Condition / age +4.8/5.0
- Livability +3.7/5.0
- Schools +2.9/10.0
- 1% rule +2.7/10.0
- Rent growth +2.3/5.0
- DSCR +1.5/10.0
- Appreciation +0.0/10.0
$250,000
🖨 Deal sheet 📄 Offer letter ✓ Due diligence
Listing remarks
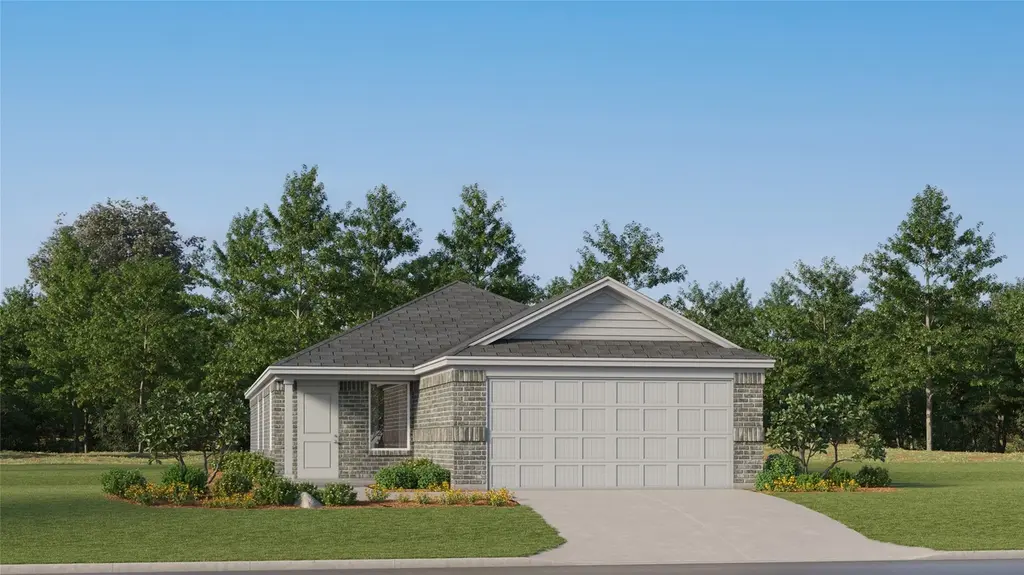
New Construction Lennar Houston Home - The Sentosa Floor Plan - This new home offers simple living with a convenient single-level layout. An open-concept floorplan combines the kitchen, living and dining areas for simple entertaining and multitasking. Three secondary bedrooms are tucked away to the side of the home, and the owner’s suite is nestled into a private rear corner, offering access to a spa-inspired bathroom and walk-in closet. The completion date, prices and features may vary and are subject to change. Please verify with Lennar directly. Photos are for illustrative purposes only.
Key facts
- Walk-in closet
- Single-level layout
- 2 garage spots
Tags
Property features AI
Finance
- HOA & community: Community managed by RealManage Onsite Elevated; Annual association amenities including clubhouse, sport court, fitness center, picnic area, park, pool, and tennis courts; Annual association fee
Exterior
- Parking: Attached 2-car garage
- Utilities: Public water; Public sewer
- Home design: Residential property; Under construction (new construction); Single-story entry (all main rooms listed on first floor)
- Construction: Built in 2026; Brick and cement siding exterior; Composition roof; Slab foundation
- Exterior features: Subdivision lot setting; Association pool
Interior
- Kitchen: Dishwasher; Electric oven; Electric range; Gas oven; Gas range
- Bedrooms: Primary bedroom on the first floor; Additional bedrooms on the first floor
- Flooring: Carpet; Vinyl
- Bathrooms: 2 full bathrooms
- Heating & cooling: Central heating (electric and gas); Central air conditioning (electric and gas)
- Interior features: Breakfast bar; Kitchen open to family room; Separate shower; Tub/shower combination; 7 total rooms
- Laundry & utility: Washer hookup; Electric dryer hookup; Gas dryer hookup
Neighborhood map
What this means for you Summary
Snapshot
- This is a 4-bed/2.0-bath single-family listed at $250k. Condition is rated excellent.
Deal economics
- At list price, monthly cash flow is $-383 ($-5k/yr) — negative.
- To cash-flow at today's rent, offer at most $242k (3.1% below list).
- To meet the 1% rule (rent ≥ 1% of price), the offer needs to be $229k (8.4% below list).
- Recommended offer: $229k (8.4% below list) — sets the bar for 1% rule.
- Cap rate 4.7% vs local median 3.2% in Houston — top-decile yield for the area; either an underpriced asset or a hidden risk that comps aren't pricing in. Stress-test before assuming the spread holds.
Location & tenants
- Location reads 74/100 on livability (#184 in TX, #4,771 nationally) — a middle-class / working-renter tenant base. Strengths: amenities A+, cost of living A+, housing A+; Watch: crime F.
- Waller ISD (rural): math 30% / reading 35% proficiency, ranked #532 of 826 in TX (top 64%) — families likely to look elsewhere, expect single-tenant / working-renter base with shorter leases.
- Zoned schools: Waller H S (math 25% / reading 40%, grade F, #1,029 of 1,632 statewide, top 64%, 2,639 students, 62% FRL) — zoned schools at 62% FRL track the district average.
- Market conditions: Rents soft (-0.7%/yr); 723 active listings in the ZIP; 7 comparable units currently listed for rent nearby; rentals leasing fast (median 2d on market — plan ~1-2 weeks tenant-placement turnaround); high-income renter base; 29,883 units permitted in Harris County in 2024 (8,621 in 5+ unit buildings).
Forward outlook
- Local home prices are declining (-3.0%/yr); year-one equity from $2k of loan paydown is wiped out by about $9k of value loss. Plan a longer hold.
- Harris County population projected at +47% by 2050 — long-run rental-demand tailwind backs the buy-and-hold thesis.
Negotiation context
- It's been on market 28 days — a 2% lower offer ($246k) is reasonable based on typical stale-listing flexibility.
Questions for the listing agent
- What do current leases actually rent for vs. the listed asking? Can we see a recent rent roll and the last 12 months of T-12 income?
- What does the HOA fee cover, when was the last increase, and are there any pending special assessments or reserve-fund shortfalls?
- Is there a deadline driving the sale (1031 exchange, divorce, estate, relocation)? That informs how much negotiation room exists.
- Schools are D-rated, which usually means shorter tenancies and higher turnover. Who's the typical renter profile here, and what's been the actual vacancy rate?
- Crime grade is F in this area — have there been break-ins, vandalism, or insurance claims at this property in the last 3 years? What carrier currently insures it and at what premium?
- The area grade is low — what's the realistic commute time and amenity access for the typical tenant pool here? Any planned neighborhood developments (good or bad) we should know about?
- What's the average days-on-market for RENTAL listings here right now (not sales)? A rising rental-DOM trend means longer vacancies and softer asking-rent achievability than the comps imply.
- What's the recent tenant-quality profile in this submarket — average credit score on applications, eviction rate, late-payment / NSF rate, and stable-employment percentage? A property-management company in the area should have these aggregated.
- How much new for-sale + rental construction is in the pipeline within 1–3 miles? Heavy new supply typically softens prices + rents 12–24 months out; constrained supply supports both.
Investment metrics
- 1% rule
- 0.77% ✗
- Cap rate
- 4.75%
- Cash-on-cash
- -5.51%
- DSCR
- 0.75
- GRM
- 10.8
CMA / ARV
- ARV (on-the-fly)
- $297,564
- Comps found
- 12
Show comp detail 12 sales within ~0.75 mi
| Address | Dist | Beds/Ba | Sqft | Sold | Price | $/sf | Match |
|---|---|---|---|---|---|---|---|
| 21643 Carbonari Dr | 0.02mi | 4/2.0 | 1,655 (+1%) | 1mo | $333,990 | $202 | 97 |
| 21623 Carbonari Dr | 0.02mi | 4/2.0 | 1,655 (+1%) | 1mo | $328,990 | $199 | 97 |
| 19307 Licola Ln | 0.01mi | 3/2.0 (-1) | 1,627 (-1%) | 0mo | $276,990 | $170 | 93 |
| 22011 Maddaloni View Dr | 0.02mi | 3/2.0 (-1) | 1,627 (-1%) | 1mo | $296,990 | $183 | 92 |
| 21647 Carbonari Dr | 0.02mi | 3/2.5 (-1) | 1,635 (-0%) | 1mo | $330,990 | $202 | 90 |
| 22026 Matera Vista Ln | 0.08mi | 4/2.0 | 1,759 (+7%) | 1mo | $299,990 | $171 | 84 |
| 21639 Carbonari Dr | 0.02mi | 3/2.5 (-1) | 1,749 (+6%) | 1mo | $337,990 | $193 | 81 |
| 22102 La Scorza Dr | 0.02mi | 3/2.0 (-1) | 1,792 (+9%) | 1mo | $324,990 | $181 | 78 |
| 22106 La Scorza Dr | 0.00mi | 3/2.0 (-1) | 1,880 (+14%) | 0mo | $307,990 | $164 | 71 |
| 22210 San Lioni Dr | 0.00mi | 3/2.0 (-1) | 1,880 (+14%) | 1mo | $330,990 | $176 | 70 |
| 19071 Cetara Villa Dr | 0.40mi | 3/2.0 (-1) | 1,582 (-4%) | 0mo | $249,990 | $158 | 70 |
| 21002 Echo Manor Dr | 0.67mi | 3/2.0 (-1) | 1,513 (-8%) | 0mo | $262,000 | $173 | 50 |
Match score weights: distance 35% · size 25% · config 20% · recency 20%. Top-matched comps best support the ARV.
Projected returns pro-forma
-3.0% appreciation · 0.0% rent growth · sell at horizon
- IRR
- -29.3%
- Equity multiple
- 0.05×
- Total profit
- $-79,194
- Equity at exit
- $44,368
- IRR
- -50.1%
- Equity multiple
- -0.51×
- Total profit
- $-125,809
- Equity at exit
- $25,728
Cash invested: $83,318 (down + closing). Projections, not guarantees.
Landlord ↔ Tenant lean methodology
- Overall (STATE)
- 87 Strongly Landlord-Friendly
- State Texas
- 87 Strongly Landlord-Friendly · R+5
- County
- — inherits STATE
- City
- — inherits STATE
ZIP-level market 77377
- Home prices YoY
- -24.5%
- Rents YoY
- -0.7%
- Active inventory
- 723
- Price-to-rent
- 9.1×
Monthly cashflow live
- Estimated rent
- $2,289 high interval (Pro) →
- Mortgage (P&I)
- −$1,560
- Tax est. 1.5%
- −$372 /mo · $4,463/yr
- Insurance
- −$124
- HOA
- −$135
- Vacancy / Maint / Mgmt
- −$481
- Net cashflow
- $-383
Break-even live
UW: 25.0% down · 7.5% · 30yr · 1.5% tax · 5.0% vac · 8.0% maint · 8.0% mgmt
Financing live
Cash to close
- Down payment
- $74,391
- Closing costs
- $8,927
- Reserves months
- —
- Total cash needed
- —
Loan-product check · same deal, 3 products live
Conventional
25% down · 7.5% · 30yr
- Down + closing
- —
- Monthly P&I
- —
- Monthly cashflow
- —
- DSCR
- —
- Eligible?
- —
Personal DTI + credit; lowest rate.
DSCR
20% down · 8.5% · 30yr
- Down + closing
- —
- Monthly P&I
- —
- Monthly cashflow
- —
- DSCR
- —
- Eligible?
- —
No personal income docs; deal must DSCR.
Hard money
10% down · 12.0% · 12mo
- Down + closing
- —
- Monthly P&I
- —
- Monthly cashflow
- —
- DSCR
- —
- Eligible?
- —
Short-term bridge; refi at stabilization.
Rent comps 7 comps
| Address | Beds | Baths | Sqft | Rent | $/sqft | DOM | Units | Dist |
|---|---|---|---|---|---|---|---|---|
| 22215 Scarlino Dr Hockley, TX | 3.0 | 2.0 | 2099 | $2,450 | $1.17 | 21d | 1 | 0.20mi |
| 20703 Solstice Point Dr Hockley, TX | 3.0 | 2.0 | 1912 | $1,951 | $1.02 | 1d | 1 | 0.49mi |
| 22023 Lost Lantern Dr Hockley, TX | 3.0–4.0 | 2.0 | 1601 | $1,863 | $1.16 | 1d | 1 | 0.54mi |
| 20718 Round Key Dr Hockley, TX | 4.0 | 2.5 | 2133 | $1,931 | $0.91 | 5d | 1 | 0.68mi |
| 21210 Echo Manor Dr Hockley, TX | 4.0 | 2.5 | 2221 | $2,150 | $0.97 | 2d | 1 | 0.79mi |
| 20313 Evergreen Cypress Dr Hockley, TX | 2.0–5.0 | 2.0–3.5 | 2051 | $2,712 | $1.32 | 1d | 1 | 0.92mi |
| 22719 Klingamans Way Hockley, TX | 3.0 | 2.0 | 1416 | $1,689 | $1.19 | 1d | 1 | 0.94mi |
HOA detail
- Monthly dues
- $135 · $1,620/yr
Listing history 15 events
-
2026-06-18days on market $250,000 Active 28 DOM
-
2026-06-17days on market $250,000 Active 27 DOM
-
2026-06-16days on market $250,000 Active 26 DOM
-
2026-06-15remarks 597-char remark
-
2026-06-15days on market $250,000 Active 25 DOM
-
2026-06-13days on market $250,000 Active 23 DOM
-
2026-06-09days on market $250,000 Active 19 DOM
-
2026-06-08days on market $250,000 Active 18 DOM
-
2026-06-07days on market $250,000 Active 17 DOM
-
2026-06-04days on market $250,000 Active 14 DOM
-
2026-06-03days on market $250,000 Active 13 DOM
-
2026-06-02days on market $250,000 Active 12 DOM
-
2026-06-01days on market $250,000 Active 11 DOM
-
2026-05-31days on market $250,000 Active 10 DOM
-
2026-05-21$250,000 Active
ⓘ Source: listings_history table (triggers on properties + properties_extension) + one-shot
backfill from property_details.listing_events for pre-trigger history.
Nearby sold comps map
Loading sold comps map…
Walkable amenities ~0.75 mi
Loading nearby amenities…
Taxation est. · year 1
- Rental income
- $27,472
- − Mortgage interest
- −$16,668
- − Property taxes
- −$4,463
- − Insurance
- −$1,488
- − Repairs & maintenance
- −$2,198
- − Management
- −$2,198
- − HOA
- −$1,620
- − Depreciation
- −$8,656
- Taxable loss
- −$9,820
- Est. tax savings @ 24.0%
- +$2,357
- After-tax cash flow
- $-2,237/yr
For passive investors: Depreciation is non-cash, so a rental often shows a tax loss while cash-flowing — sheltering income. Rental losses are passive: they offset passive income freely, and up to $25,000/yr can offset ordinary (W-2) income if you actively participate and your MAGI is under $100k (phasing out to $0 by $150k); unused losses carry forward. On sale, claimed depreciation is recaptured at up to 25%, and gains may owe capital-gains tax (a 1031 exchange can defer both). Figures are a year-1 estimate at your 24.0% rate — not tax advice; consult a CPA.
Condition & rehab AI · 6 photos
This new single-family home is move-in ready with a modern design and excellent condition. It offers a spacious open-concept floor plan and is ideal for both resale and rental markets.
Value-add opportunities
- Both Painting the exterior — Enhances curb appeal and can increase both resale and rental value
- Both Landscaping improvements — Enhances curb appeal and can increase both resale and rental value
Renovation cost estimate screening
Value-add ROI direction
- Both Painting the exterior — Enhances curb appeal and can increase both resale and rental value ↑
- Both Landscaping improvements — Enhances curb appeal and can increase both resale and rental value ↑
ⓘ Cost ranges are severity-bucket heuristics (US national rule-of-thumb). Get contractor quotes + a written scope before underwriting a rehab budget.
Schools (NCES district)
- District
- Waller ISD
- NCES district ID
- 4844430
- Math proficiency
- 30% ▼ -23.00%
- Reading proficiency
- 35% ▼ -11.00%
- Median HH income
- $58,911
- Composite
- 29.12/100
- National rank
- #6593
- State rank
- #532 of 826 in TX
Livability — Houston
- Score
- 74/100
- State rank
- #184
- US rank
- #4771
Category grades
Schools grade is shown separately in the Schools card above.
Census & demographics
- County
- Harris County · 4,702,590 people
- City population
- 3,226,434
- Metro
- Houston-The Woodlands-Sugar Land, TX
- Population (ZIP)
- 41,680
- Household income
- $129,327
- Rent vs Own
- Severe rent burden
- 444.0
Population outlook (Harris County) Hauer SSP2
- Today (2025)
- 5,571,493 people
- By 2030
- 6,089,821 · +9.3%
- By 2040
- 7,142,806 · +28.2%
- By 2050
- 8,185,864 · +46.9%
- By 2075
- 10,574,329 · +89.8%
- By 2100
- 12,109,958 · +117.4%
Race, ethnicity, and origin ACS 2023
- Neighborhood character
- Diverse neighborhood (Simpson 0.55)
- Race & ethnicity
- White 63% Hispanic / Latino 20% Two or more races 12% Asian 9% Black 5%
- Hispanic origin (detail)
- Mexican 14%
- Common ancestry
- Portuguese 4% Lithuanian 3% Romanian 3%
- Foreign-born
- 15% · Canada, China, Vietnam
- Languages at home
- 74% English-only · Spanish 15% Other Indo-European 3% Chinese 2%
Political lean MEDSL · Harris
- 2024 margin
- Lean D (+5.5) · D 52.0% · R 46.4% · Other 1.6%
- 2008→2024 swing
- +3.9pp toward D · 2008: 1.6pp · 2024: 5.5pp
- All cycles
- 2024: D+5.5 2020: D+13.3 2016: D+12.4 2012: D+0.1 2008: D+1.6
Not yet ingested
- Civics
- —
Market trends
- HPI YoY
- ▼ -76.14%
- Current HPI
- 235.031
- Rent YoY
- ▼ -0.69%
- Metro
- Houston-The Woodlands-Sugar Land, TX
- State GDP YoY
- ▲ 3.95%
- F500 in state
- 110
Industry mix (Fortune 500 HQ in TX)
| Industry | F500 HQs | Revenue |
|---|---|---|
| Energy | 16 | $1,198B |
|
||
| Technology | 5 | $198B |
|
||
| Engineering / Construction | 4 | $72B |
|
||
| Energy Services | 3 | $60B |
|
||
| Utilities | 3 | $41B |
|
||
| Healthcare | 2 | $330B |
|
||
Price history
1 event — show timeline
- 2026-05-21 Listed $250,000 HARMLS
Cash-flow waterfall
monthlySold comps — $/sqft
last 12 mo · ≤1 miLoading sold comps…