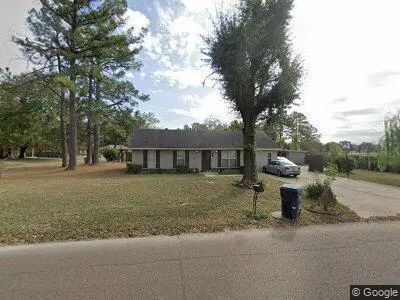
728 Woodale St · Forrest City, AR
Flood risk 1/10 · Minimal
- FEMA flood zone
- X
- Chance of flooding over 30 yrs
- 0.0%
- Est. flood insurance / yr
- $507 – $1,088
Fire risk 3/10 · Minor
- Est. fire insurance / yr
- $1,499 – $2,785
Heat risk 6/10 · Moderate
- Hot days now (above 109°F)
- 7 days/yr
- Hot days in 30 yrs
- 20 days/yr
Wind risk 4/10 · Minor
- Chance of severe wind over 30 yrs
- 15.0%
Air-quality risk 1/10 · Minimal
- Unhealthy air days now
- 0 days/yr
- Unhealthy air days in 30 yrs
- 0 days/yr
Risk factors via First Street. Map © Google.
Why this score? — see what drove the C+ grade
The composite is a weighted blend of 9 inputs, each scored 0–100. Each bar is that input's sub-score; the figure is the points it added to the 100-point composite (weight × sub-score).
- Cash flow +29.7/30.0
- DSCR +10.0/10.0
- 1% rule +7.2/10.0
- ARV discount +7.1/15.0
- Livability +3.0/5.0
- Rent growth +2.5/5.0
- Condition / age +2.5/5.0
- Appreciation +1.6/10.0
- Schools +0.9/10.0
$96,000
🖨 Deal sheet 📄 Offer letter ✓ Due diligence
Listing remarks
Well kept 3 bedroom, 1 bath home with recently remodeled kitchen. New dishwasher, double stainless steel sinks, granite countertops. Bathroom has new faucets, countertop, tub surround, vinyl floor. Located on a large corner lot 1/2 block off Hwy 1 S. Seller purchased in 2003 and needs to relocate due to job.
Key facts
- Tub surround
- New faucets
- Remodeled kitchen
Tags
Neighborhood map
What this means for you Summary
Snapshot
- This is a 3-bed/1.0-bath single-family listed at $96k.
Deal economics
- At list price, monthly cash flow is $349 ($4k/yr) — positive.
- The deal already cash-flows at list — no discount required.
- Meets the 1% rule at list price ($1k rent vs $96k).
Location & tenants
- Location reads 59/100 on livability (#297 in AR) — a working-class tenant base; expect higher turnover. Strengths: cost of living A+, health & safety A+, housing A-; Watch: schools F, crime F, amenities F.
- Forrest City School District (town): math 12% / reading 11% proficiency, ranked #230 of 238 in AR (top 97%) — low school quality limits family demand, transient renter base, plan for 1-2y turnover; 93% free/reduced lunch — lower-income household profile, screen leases tightly.
- Market conditions: 66 active listings in the ZIP; 3 units permitted in St. Francis County in 2024 (0 in 5+ unit buildings).
Forward outlook
- Local home prices are declining (-3.0%/yr); year-one equity from $664 of loan paydown is wiped out by about $3k of value loss. Plan a longer hold.
- St. Francis County population projected at -21% by 2050 — secular population decline; favor cash flow + early exit over multi-decade hold.
- At projected returns (-3.0% appreciation + 3.0% rent growth), your $27k cash investment doubles in ~8 years — after that, you're playing with house money.
Negotiation context
- Only 1 days on market — expect competitive offers; lowballing is unlikely to land.
- Current owner paid $70k; 37% above their basis — modest negotiation headroom, anchor on the comps not their cost.
Risks & watch-outs
- Climate carrying-cost: extreme-heat days projected 7→20/yr by 2055 (HVAC capex compounding) — expect insurance premiums to compound above CPI over the hold.
Questions for the listing agent
- Is there a deadline driving the sale (1031 exchange, divorce, estate, relocation)? That informs how much negotiation room exists.
- Schools are F-rated, which usually means shorter tenancies and higher turnover. Who's the typical renter profile here, and what's been the actual vacancy rate?
- Crime grade is F in this area — have there been break-ins, vandalism, or insurance claims at this property in the last 3 years? What carrier currently insures it and at what premium?
- What's the average days-on-market for RENTAL listings here right now (not sales)? A rising rental-DOM trend means longer vacancies and softer asking-rent achievability than the comps imply.
- What's the recent tenant-quality profile in this submarket — average credit score on applications, eviction rate, late-payment / NSF rate, and stable-employment percentage? A property-management company in the area should have these aggregated.
- How much new for-sale + rental construction is in the pipeline within 1–3 miles? Heavy new supply typically softens prices + rents 12–24 months out; constrained supply supports both.
Investment metrics
- 1% rule
- 1.22% ✓
- Cap rate
- 10.66%
- Cash-on-cash
- 15.59%
- DSCR
- 1.69
- GRM
- 6.9
CMA / ARV
- ARV (on-the-fly)
- $95,152
- Comps found
- 5
Show comp detail 5 sales within ~0.75 mi
| Address | Dist | Beds/Ba | Sqft | Sold | Price | $/sf | Match |
|---|---|---|---|---|---|---|---|
| 2408 Fernwood St | 0.02mi | 3/1.0 | 1,090 (-13%) | 19mo | $82,450 | $76 | 62 |
| 921 Driftwood | 0.07mi | 3/1.0 | 1,090 (-13%) | 20mo | $82,000 | $75 | 59 |
| 2628 Redhaven Dr | 0.52mi | 3/2.0 | 1,190 (-5%) | 10mo | $93,500 | $79 | 55 |
| 181 Bray St | 0.49mi | 3/1.5 | 1,176 (-6%) | 18mo | $113,000 | $96 | 50 |
| 141 Bray St | 0.55mi | 4/2.0 (+1) | 1,394 (+11%) | 23mo | $83,500 | $60 | 28 |
Match score weights: distance 35% · size 25% · config 20% · recency 20%. Top-matched comps best support the ARV.
Projected returns pro-forma
-3.0% appreciation · 3.0% rent growth · sell at horizon
- IRR
- 6.4%
- Equity multiple
- 1.25×
- Total profit
- $6,652
- Equity at exit
- $14,314
- IRR
- 15.7%
- Equity multiple
- 2.28×
- Total profit
- $34,282
- Equity at exit
- $8,300
Cash invested: $26,880 (down + closing). Projections, not guarantees.
Landlord ↔ Tenant lean methodology
- Overall (STATE)
- 92 Strongly Landlord-Friendly
- State Arkansas
- 92 Strongly Landlord-Friendly · R+14
- County
- — inherits STATE
- City
- — inherits STATE
ZIP-level market 72335
- Home prices YoY
- -4.9%
- Active inventory
- 66
- Price-to-rent
- 6.9×
Monthly cashflow live
- Estimated rent
- $1,167 medium interval (Pro) →
- Mortgage (P&I)
- −$503
- Tax from tax record
- −$29 /mo · $351/yr
- Insurance
- −$40
- HOA
- −$0
- Vacancy / Maint / Mgmt
- −$245
- Net cashflow
- $349
Break-even live
UW: 25.0% down · 7.5% · 30yr · 1.5% tax · 5.0% vac · 8.0% maint · 8.0% mgmt
Financing live
Cash to close
- Down payment
- $24,000
- Closing costs
- $2,880
- Reserves months
- —
- Total cash needed
- —
Loan-product check · same deal, 3 products live
Conventional
25% down · 7.5% · 30yr
- Down + closing
- —
- Monthly P&I
- —
- Monthly cashflow
- —
- DSCR
- —
- Eligible?
- —
Personal DTI + credit; lowest rate.
DSCR
20% down · 8.5% · 30yr
- Down + closing
- —
- Monthly P&I
- —
- Monthly cashflow
- —
- DSCR
- —
- Eligible?
- —
No personal income docs; deal must DSCR.
Hard money
10% down · 12.0% · 12mo
- Down + closing
- —
- Monthly P&I
- —
- Monthly cashflow
- —
- DSCR
- —
- Eligible?
- —
Short-term bridge; refi at stabilization.
Listing history 5 events
-
2026-05-26$96,000 Active
-
2023-03-24soldstatus $70,000
-
2003-05-28soldstatus $61,000
-
1997-09-28soldstatus $50,000
-
1989-02-01soldstatus $20,000
ⓘ Source: listings_history table (triggers on properties + properties_extension) + one-shot
backfill from property_details.listing_events for pre-trigger history.
Tax reassessment forecast AR · Resets to sale price
- Current annual tax
- $351 · $29/mo
- Projected year-2 tax
- $614 · $51/mo
- Expected delta
- +$263/yr (+$22/mo · 75.0%)
ⓘ Screening estimate from a state-policy table — verify with the county assessor before closing.
Climate risk First Street
- Flood 1/10 Low FEMA zone X · 0% chance over 30 yrs
- Wildfire 3/10 Moderate
- Heat 6/10 Major 7 d/yr ≥109°F today · 20 d/yr by 30 yrs out
- Wind 4/10 Moderate 15% chance of damaging wind over 30 yrs
- Air quality 1/10 Low 0 unhealthy d/yr today · 0 by 30 yrs out
Nearby sold comps map
Loading sold comps map…
Walkable amenities ~0.75 mi
Loading nearby amenities…
Taxation est. · year 1
- Rental income
- $14,005
- − Mortgage interest
- −$5,377
- − Property taxes
- −$351
- − Insurance
- −$480
- − Repairs & maintenance
- −$1,120
- − Management
- −$1,120
- − Depreciation
- −$2,793
- Taxable income
- $2,763
- Est. tax owed @ 24.0%
- −$663
- After-tax cash flow
- $3,528/yr
For passive investors: Depreciation is non-cash, so a rental often shows a tax loss while cash-flowing — sheltering income. Rental losses are passive: they offset passive income freely, and up to $25,000/yr can offset ordinary (W-2) income if you actively participate and your MAGI is under $100k (phasing out to $0 by $150k); unused losses carry forward. On sale, claimed depreciation is recaptured at up to 25%, and gains may owe capital-gains tax (a 1031 exchange can defer both). Figures are a year-1 estimate at your 24.0% rate — not tax advice; consult a CPA.
Schools (NCES district)
- District
- Forrest City School District
- NCES district ID
- 0506270
- Math proficiency
- 12% ▼ -8.00%
- Reading proficiency
- 11% ▼ -7.00%
- Median HH income
- $31,153
- Composite
- 9.07/100
- National rank
- #9871
- State rank
- #230 of 238 in AR
Livability — Forrest City
- Score
- 59/100
- State rank
- #297
- US rank
- #20349
Category grades
Schools grade is shown separately in the Schools card above.
Census & demographics
- Census place
- Forrest City, AR
- Population (ZIP)
- 16,514
Population outlook (St. Francis County) Hauer SSP2
- Today (2025)
- 24,387 people
- By 2030
- 23,269 · -4.6%
- By 2040
- 21,122 · -13.4%
- By 2050
- 19,281 · -20.9%
- By 2075
- 15,222 · -37.6%
- By 2100
- 11,449 · -53.1%
Race, ethnicity, and origin ACS 2023
- Neighborhood character
- Majority Black (62%)
- Race & ethnicity
- Black 62% White 32% Hispanic / Latino 3% Two or more races 2%
- Common ancestry
- Italian 1% Lithuanian 1% Slovak 1%
- Foreign-born
- 2% · Canada
- Languages at home
- 96% English-only · Spanish 3%
Political lean MEDSL · St. Francis
- 2024 margin
- Toss-up / Even · D 49.4% · R 48.6% · Other 2.0%
- 2008→2024 swing
- -15.8pp toward R · 2008: 16.5pp · 2024: 0.7pp
- All cycles
- 2024: D+0.7 2020: D+5.1 2016: D+11.3 2012: D+17.0 2008: D+16.5
Not yet ingested
- Civics
- —
Market trends
- HPI YoY
- ▼ -6.86%
- Current HPI
- 133.8115
- Rent YoY
- —
- Metro
- —
- State GDP YoY
- ▲ 3.80%
- F500 in state
- 10
Industry mix (Fortune 500 HQ in AR)
| Industry | F500 HQs | Revenue |
|---|---|---|
| Retail | 1 | $681B |
|
||
| Food / Agriculture | 1 | $53B |
|
||
| Retail / Energy | 1 | $22B |
|
||
| Transportation / Logistics | 1 | $12B |
|
||
| Energy | 1 | $4B |
|
||
Price history
+380.0% since first listed5 events — show timeline
- 2026-05-26 Listed $96,000 FSBO.com
- 2023-03-24 Sold (Public Records) $70,000 Public Records
- 2003-05-28 Sold (Public Records) $61,000 Public Records
- 1997-09-28 Sold (Public Records) $50,000 Public Records
- 1989-02-01 Sold (Public Records) $20,000 Public Records
Property tax history
-2.2%/yrLatest (2025): $351 · -2.2% YoY. Source: county tax records.
Cash-flow waterfall
monthlySold comps — $/sqft
last 12 mo · ≤1 miLoading sold comps…