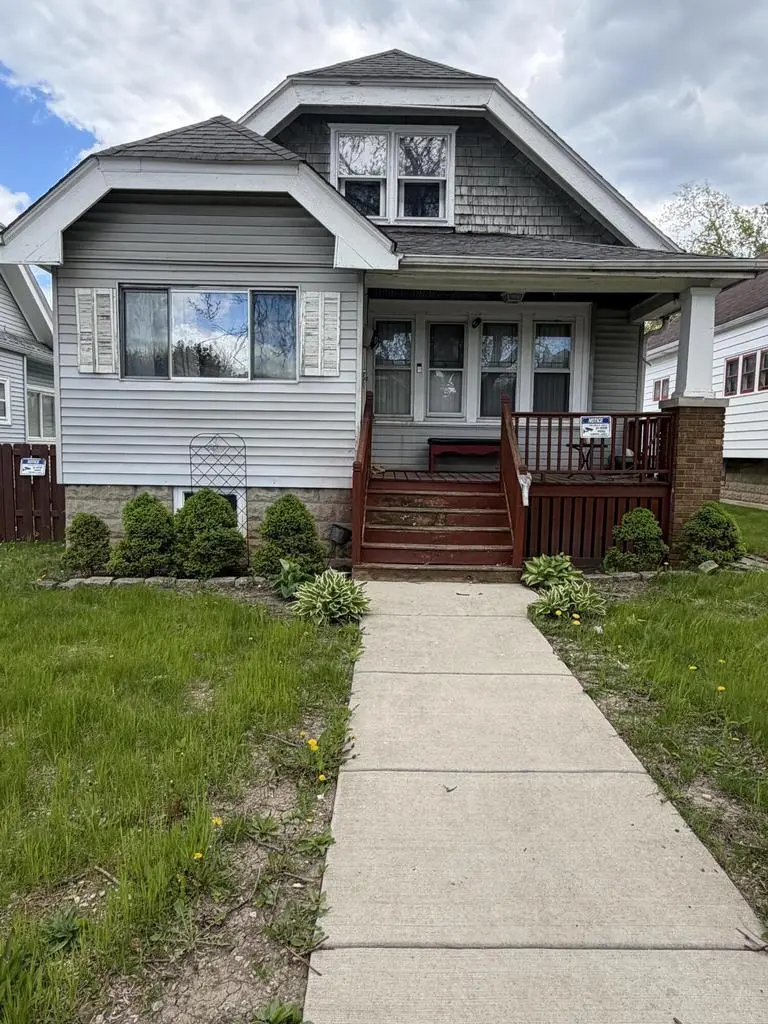
3356 N 37th St · Milwaukee, WI
Flood risk 1/10 · Minimal
- FEMA flood zone
- X (unshaded)
- Chance of flooding over 30 yrs
- 0.0%
- Est. flood insurance / yr
- $473 – $860
Fire risk 1/10 · Minimal
- Est. fire insurance / yr
- $636 – $1,182
Heat risk 2/10 · Minimal
- Hot days now (above 98°F)
- 7 days/yr
- Hot days in 30 yrs
- 13 days/yr
Wind risk 2/10 · Minimal
- Chance of severe wind over 30 yrs
- —
Air-quality risk 2/10 · Minimal
- Unhealthy air days now
- 2 days/yr
- Unhealthy air days in 30 yrs
- 2 days/yr
Risk factors via First Street. Map © Google.
Why this score? — see what drove the D+ grade
The composite is a weighted blend of 9 inputs, each scored 0–100. Each bar is that input's sub-score; the figure is the points it added to the 100-point composite (weight × sub-score).
- Cash flow +12.8/30.0
- ARV discount +9.5/15.0
- Appreciation +5.7/10.0
- Rent growth +4.3/5.0
- Livability +4.0/5.0
- 1% rule +3.9/10.0
- DSCR +3.8/10.0
- Condition / age +2.5/5.0
- Schools +1.2/10.0
$124,999
🖨 Deal sheet (PDF) 📄 Offer letter ✓ Due diligence
Listing remarks
Whether you're looking for a starter home or a great investment property, this property is a great option. Tons of potential for additional 2 bedrooms in the upper space. Seller is selling AS-IS!!! * * Room sizes are estimates and should be verified by buyer * *
Key facts
- 4,791 sq ft lot
- Garage
- Built 1928
Property features AI
Finance
- Other: No inclusions; tenant's personal property excluded
Exterior
- Parking: Detached 1-car garage
- Utilities: Municipal water; Municipal sewer
- Home design: Single-family, 1-story home; Zoned RT2 Residential
- Construction: Year built from assessor/public records
- Exterior features: Vinyl exterior; Less than 1/2 acre lot
Interior
- Kitchen: Kitchen on main level
- Bedrooms: Primary bedroom (12 x 10) on main level; Second bedroom (10 x 12) on main level
- Bathrooms: One full bathroom with tub/shower combo in the primary bathroom
- Heating & cooling: Forced air heating; Natural gas fuel
- Interior features: Full finished basement; Living room (16 x 11) on main level; Dining room (11 x 11) on main level; Kitchen (12 x 12) on main level
Neighborhood map
What this means for you Summary
Snapshot
- This is a 2-bed/1.0-bath single-family listed at $125k.
Deal economics
- At list price, monthly cash flow is $-11 ($-133/yr) — negative.
- To cash-flow at today's rent, offer at most $123k (1.6% below list).
- To meet the 1% rule (rent ≥ 1% of price), the offer needs to be $112k (10.5% below list).
- Recommended offer: $112k (10.5% below list) — sets the bar for 1% rule.
- Cap rate 6.2% vs local median 5.1% in Milwaukee — meaningfully above typical; check what's discounted (condition, days-on-market, listing class) to confirm the premium yield is real.
Location & tenants
- Location reads 81/100 on livability (#55 in WI, #1,534 nationally) — a professional / high-income tenant draw. Strengths: amenities A+, commute A+, cost of living A+; Watch: employment D+, schools F, crime F.
- Milwaukee School District (urban): math 10% / reading 18% proficiency, ranked #337 of 342 in WI (top 98%) — low school quality limits family demand, transient renter base, plan for 1-2y turnover; 77% free/reduced lunch — lower-income household profile, screen leases tightly.
- Market conditions: Rents rising fast (+7.0%/yr); 130 active listings in the ZIP; 40 comparable units currently listed for rent nearby; rentals at typical pace (median 26d on market — plan ~3-4 weeks tenant-placement turnaround); 1,017 units permitted in Milwaukee County in 2024 (803 in 5+ unit buildings).
Forward outlook
- In year one you build about $3k of equity ($864 loan paydown + $2k appreciation (1.3% local appreciation)).
- Milwaukee County population projected at +4% by 2050 — modest demand growth; plan on rents tracking national, not racing it.
- At projected returns (1.3% appreciation + 7.0% rent growth), your $35k cash investment doubles in ~8 years — after that, you're playing with house money.
Negotiation context
- It's been on market 31 days — a 3% lower offer ($121k) is reasonable based on typical stale-listing flexibility.
- Current owner paid $26k; list at $125k implies a 381% gain — meaningful room to come down on a strong offer.
Risks & watch-outs
- Watch-outs: built in 1928 — expect roof / HVAC / electrical / plumbing capex.
Questions for the listing agent
- What do current leases actually rent for vs. the listed asking? Can we see a recent rent roll and the last 12 months of T-12 income?
- It's been on market 31 days. Have you received any prior offers? Is the seller open to a 11% concession, seller financing, or rate buy-down credit?
- Built in 1928 — when were the roof, HVAC, electrical panel, plumbing, and water heater last replaced?
- Is there a deadline driving the sale (1031 exchange, divorce, estate, relocation)? That informs how much negotiation room exists.
- Schools are F-rated, which usually means shorter tenancies and higher turnover. Who's the typical renter profile here, and what's been the actual vacancy rate?
- Crime grade is F in this area — have there been break-ins, vandalism, or insurance claims at this property in the last 3 years? What carrier currently insures it and at what premium?
- The area grade is low — what's the realistic commute time and amenity access for the typical tenant pool here? Any planned neighborhood developments (good or bad) we should know about?
- What's the average days-on-market for RENTAL listings here right now (not sales)? A rising rental-DOM trend means longer vacancies and softer asking-rent achievability than the comps imply.
- What's the recent tenant-quality profile in this submarket — average credit score on applications, eviction rate, late-payment / NSF rate, and stable-employment percentage? A property-management company in the area should have these aggregated.
- How much new for-sale + rental construction is in the pipeline within 1–3 miles? Heavy new supply typically softens prices + rents 12–24 months out; constrained supply supports both.
Investment metrics
- 1% rule
- 0.89% ✗
- Cap rate
- 6.19%
- Cash-on-cash
- -0.38%
- DSCR
- 0.98
- GRM
- 9.3
CMA / ARV
- ARV (on-the-fly)
- $130,680
- Comps found
- 12
Show comp detail 12 sales within ~0.75 mi
| Address | Dist | Beds/Ba | Sqft | Sold | Price | $/sf | Match |
|---|---|---|---|---|---|---|---|
| 3221 N 38th St | 0.21mi | 3/1.0 (+1) | 1,174 (-1%) | 3mo | $75,000 | $64 | 80 |
| 3429 N 41st St | 0.28mi | 2/1.0 | 1,087 (-8%) | 4mo | $151,000 | $139 | 70 |
| 3144 N 38th St | 0.29mi | 2/1.0 | 1,090 (-8%) | 4mo | $120,000 | $110 | 69 |
| 3252 N 40th St | 0.23mi | 2/1.0 | 1,042 (-12%) | 5mo | $70,000 | $67 | 65 |
| 3052 N 40th St | 0.45mi | 3/1.0 (+1) | 1,240 (+4%) | 4mo | $75,000 | $60 | 63 |
| 4018 W Burliegh St | 0.42mi | 3/1.0 (+1) | 1,258 (+6%) | 4mo | $55,000 | $44 | 63 |
| 3448 N 41st St | 0.27mi | 3/2.0 (+1) | 1,104 (-7%) | 6mo | $233,000 | $211 | 62 |
| 3760 N 42nd St | 0.47mi | 2/1.0 | 1,038 (-13%) | 3mo | $155,000 | $149 | 55 |
| 2865 N 36th St | 0.64mi | 3/2.0 (+1) | 1,292 (+9%) | 2mo | $132,000 | $102 | 45 |
| 4102 W Capitol Dr | 0.72mi | 3/1.0 (+1) | 1,077 (-9%) | 2mo | $128,000 | $119 | 45 |
| 2807 N 36th St | 0.72mi | 3/1.0 (+1) | 1,297 (+9%) | 8mo | $70,000 | $54 | 40 |
| 4448 W Leon Ter | 0.65mi | 3/1.0 (+1) | 1,014 (-15%) | 2mo | $130,000 | $128 | 38 |
Match score weights: distance 35% · size 25% · config 20% · recency 20%. Top-matched comps best support the ARV.
Projected returns pro-forma
1.33% appreciation · 7.01% rent growth · sell at horizon
- IRR
- 4.5%
- Equity multiple
- 1.24×
- Total profit
- $8,386
- Equity at exit
- $44,822
- IRR
- 11.1%
- Equity multiple
- 2.53×
- Total profit
- $53,467
- Equity at exit
- $61,263
Cash invested: $35,000 (down + closing). Projections, not guarantees.
Landlord ↔ Tenant lean methodology
- Overall (STATE)
- 73 Landlord-Friendly
- State Wisconsin
- 73 Landlord-Friendly · R+2
- County
- — inherits STATE
- City
- — inherits STATE
ZIP-level market 53216
- Home prices YoY
- 0.3%
- Rents YoY
- 7.0%
- Active inventory
- 130
- Price-to-rent
- 9.3×
Monthly cashflow live
- Estimated rent
- $1,119 high interval (Pro) →
- Mortgage (P&I)
- −$656
- Tax from tax record
- −$187 /mo · $2,247/yr
- Insurance
- −$52
- HOA
- −$0
- Vacancy / Maint / Mgmt
- −$235
- Net cashflow
- $-11
Break-even live
Sensitivity live
| Price | -10% $60 | -5% $24 | +0% $-11 | +5% $-46 | +10% $-82 |
|---|---|---|---|---|---|
| Rent | -10% $-99 | -5% $-55 | +0% $-11 | +5% $33 | +10% $77 |
| Rate | -1.0pp $52 | -0.5pp $21 | base $-11 | +0.5pp $-43 | +1.0pp $-76 |
UW: 25.0% down · 7.5% · 30yr · 1.5% tax · 5.0% vac · 8.0% maint · 8.0% mgmt
Financing live
Cash to close
- Down payment
- $31,250
- Closing costs
- $3,750
- Reserves months
- —
- Total cash needed
- —
Loan-product check · same deal, 3 products live
Conventional
25% down · 7.5% · 30yr
- Down + closing
- —
- Monthly P&I
- —
- Monthly cashflow
- —
- DSCR
- —
- Eligible?
- —
Personal DTI + credit; lowest rate.
DSCR
20% down · 8.5% · 30yr
- Down + closing
- —
- Monthly P&I
- —
- Monthly cashflow
- —
- DSCR
- —
- Eligible?
- —
No personal income docs; deal must DSCR.
Hard money
10% down · 12.0% · 12mo
- Down + closing
- —
- Monthly P&I
- —
- Monthly cashflow
- —
- DSCR
- —
- Eligible?
- —
Short-term bridge; refi at stabilization.
Rent comps 40 comps
| Address | Beds | Baths | Sqft | Rent | $/sqft | DOM | Units | Dist |
|---|---|---|---|---|---|---|---|---|
| 3179 N 39th St Milwaukee, WI | 1.0 | 1.0 | 800 | $850 | $1.06 | 3d | 1 | 0.28mi |
| 3179 N 39th St Unit 3907AUER Milwaukee, WI | 1.0 | 1.0 | 800 | $750 | $0.94 | 4d | 1 | 0.28mi |
| 3148 N 39th St Milwaukee, WI | 2.0 | 1.0 | 1100 | $1,100 | $1.00 | 45d | 1 | 0.29mi |
| 3148 N 39th St Unit 1 Milwaukee, WI | 2.0 | 1.0 | 1000 | $1,100 | $1.10 | 16d | 1 | 0.29mi |
| 3630 W Nash St Milwaukee, WI | 2.0 | 1.0 | 1000 | $1,200 | $1.20 | 25d | 1 | 0.31mi |
| 3214 N 41st St Milwaukee, WI | 2.0 | 1.0 | 900 | $1,250 | $1.39 | 45d | 1 | 0.32mi |
| 3606 N 41st St Unit 3608 Milwaukee, WI | 2.0 | 1.0 | 1095 | $975 | $0.89 | 45d | 1 | 0.35mi |
| 3124 N 33rd St Milwaukee, WI | 2.0 | 1.0 | 1200 | $1,200 | $1.00 | 45d | 1 | 0.36mi |
| 3122 N 42nd St Milwaukee, WI | 3.0 | 1.0 | 1323 | $1,495 | $1.13 | 6d | 1 | 0.43mi |
| 3347 N 29th St Unit 3347A Milwaukee, WI | 2.0 | 1.0 | 950 | $845 | $0.89 | 16d | 1 | 0.46mi |
| 3340 N 44th St Milwaukee, WI | 2.0 | 1.0 | 900 | $1,295 | $1.44 | 14d | 1 | 0.46mi |
| 2821 W Concordia Ave Milwaukee, WI | 3.0 | 1.5 | 1098 | $1,595 | $1.45 | 3d | 1 | 0.50mi |
| 3871-3873 N 36th St Unit 3871 Milwaukee, WI | 2.0 | 1.0 | 987 | $950 | $0.96 | 25d | 1 | 0.52mi |
| 4409 W Burleigh St Apt 1 Milwaukee, WI | 2.0 | 1.0 | 800 | $795 | $0.99 | 6d | 1 | 0.61mi |
| 2931 W Chambers St Milwaukee, WI | 2.0 | 1.0 | 1400 | $1,050 | $0.75 | 25d | 1 | 0.63mi |
| 3925 N 41st St Unit 2 Milwaukee, WI | 1.0 | 1.0 | 700 | $845 | $1.21 | 25d | 1 | 0.66mi |
| 3890 N Sherman Blvd Milwaukee, WI | 2.0 | 1.0 | 950 | $1,100 | $1.16 | 14d | 1 | 0.67mi |
| 3925 N 42nd St Milwaukee, WI | 3.0 | 1.0 | 1300 | $1,675 | $1.29 | 45d | 1 | 0.68mi |
| 3925 N 42nd St Milwaukee, WI | 2.0 | 1.0 | 985 | $1,400 | $1.42 | 25d | 1 | 0.68mi |
| 2870 N 29th St #2872 Milwaukee, WI | 3.0 | 1.0 | 1300 | $1,250 | $0.96 | 45d | 1 | 0.77mi |
| 3901 N 27th St Unit 3907 Milwaukee, WI | 2.0 | 1.0 | 715 | $895 | $1.25 | 25d | 1 | 0.80mi |
| 2706 N 39th St Unit 2706 Milwaukee, WI | 2.0 | 1.0 | 866 | $845 | $0.98 | 45d | 1 | 0.83mi |
| 3072 N 49th St Milwaukee, WI | 2.0 | 1.0 | 1000 | $950 | $0.95 | 18d | 1 | 0.86mi |
| 3072 N 49th St Unit 3072- 3 Milwaukee, WI | 2.0 | 1.0 | 1000 | $950 | $0.95 | 45d | 1 | 0.86mi |
| 3039 N 24th Pl Unit 3039 Milwaukee, WI | 2.0 | 1.0 | 800 | $995 | $1.24 | 18d | 1 | 0.86mi |
| 3066 N 49th St Unit 3066-5 Milwaukee, WI | 2.0 | 1.0 | 1100 | $950 | $0.86 | 45d | 1 | 0.86mi |
| 3100 W Center St Milwaukee, WI | 3.0 | 2.0 | 1174 | $1,531 | $1.30 | 3d | 1 | 0.87mi |
| 2842 N 47th St Milwaukee, WI | 2.0 | 1.0 | 1500 | $1,100 | $0.73 | 45d | 1 | 0.92mi |
| 3410 N 23rd St Milwaukee, WI | 2.0 | 1.0 | 800 | $800 | $1.00 | 18d | 1 | 0.93mi |
| 2712 N 44th St Unit 2712A Milwaukee, WI | 2.0 | 1.0 | 911 | $995 | $1.09 | 25d | 1 | 0.94mi |
| 2713 N 44th St Milwaukee, WI | 3.0 | 1.0 | 1450 | $1,350 | $0.93 | 45d | 1 | 0.96mi |
| 2765 N 26th St Unit 1 Milwaukee, WI | 3.0 | 1.0 | 1125 | $1,200 | $1.07 | 6d | 1 | 0.97mi |
| 2765 N 26th St Unit 2 Milwaukee, WI | 2.0 | 1.0 | 1100 | $1,100 | $1.00 | 6d | 1 | 0.97mi |
| 2517 W Hadley St Milwaukee, WI | 2.0 | 1.0 | 850 | $1,050 | $1.24 | 16d | 1 | 1.00mi |
| 2663 N 44th St Unit 1 Milwaukee, WI | 2.0 | 1.0 | 900 | $995 | $1.11 | 45d | 1 | 1.00mi |
| 5137 W Keefe Ave Unit 5137 Milwaukee, WI | 2.0 | 1.0 | 1000 | $1,550 | $1.55 | 4d | 1 | 1.01mi |
| 2550 N 36th St Unit 2550A Upper Milwaukee, WI | 2.0 | 1.0 | 711 | $845 | $1.19 | 25d | 1 | 1.01mi |
| 2945 N 23rd St Milwaukee, WI | 3.0 | 1.0 | 1014 | $1,195 | $1.18 | 45d | 1 | 1.03mi |
| 3155 N 52nd St Milwaukee, WI | 3.0 | 2.0 | 1300 | $1,400 | $1.08 | 45d | 1 | 1.03mi |
| 2530 N 37th St Milwaukee, WI | 2.0 | 1.0 | 1037 | $1,000 | $0.96 | 16d | 1 | 1.04mi |
Listing history 18 events
-
2026-06-21days on market $124,999 Active 31 DOM
-
2026-06-18days on market $124,999 Active 28 DOM
-
2026-06-17days on market $124,999 Active 27 DOM
-
2026-06-16days on market $124,999 Active 26 DOM
-
2026-06-15days on market $124,999 Active 25 DOM
-
2026-06-13days on market $124,999 Active 23 DOM
-
2026-06-13days on market $124,999 Active 22 DOM
-
2026-06-09days on market $124,999 Active 19 DOM
-
2026-06-08days on market $124,999 Active 18 DOM
-
2026-06-07days on market $124,999 Active 17 DOM
-
2026-06-05days on market $124,999 Active 14 DOM
-
2026-06-03days on market $124,999 Active 13 DOM
-
2026-06-02days on market $124,999 Active 12 DOM
-
2026-06-01days on market $124,999 Active 11 DOM
-
2026-05-31days on market $124,999 Active 10 DOM
-
2026-05-21$124,999 Active
-
1989-09-01soldstatus $26,000
-
1977-12-01soldstatus $24,900
ⓘ Source: listings_history table (triggers on properties + properties_extension) + one-shot
backfill from property_details.listing_events for pre-trigger history.
Tax reassessment forecast WI · Partial reset (capped growth)
- Current annual tax
- $2,247 · $187/mo
- Projected year-2 tax
- $2,280 · $190/mo
- Expected delta
- +$33/yr (+$3/mo · 1.5%)
ⓘ Screening estimate from a state-policy table — verify with the county assessor before closing.
Climate risk First Street
- Flood 1/10 Low FEMA zone X (unshaded) · 0% chance over 30 yrs
- Wildfire 1/10 Low
- Heat 2/10 Low 7 d/yr ≥98°F today · 13 d/yr by 30 yrs out
- Wind 2/10 Low
- Air quality 2/10 Low 2 unhealthy d/yr today · 2 by 30 yrs out
Nearby sold comps map
Loading sold comps map…
Walkable amenities ~0.75 mi
Loading nearby amenities…
Taxation est. · year 1
- Rental income
- $13,424
- − Mortgage interest
- −$7,002
- − Property taxes
- −$2,247
- − Insurance
- −$625
- − Repairs & maintenance
- −$1,074
- − Management
- −$1,074
- − Depreciation
- −$3,636
- Taxable loss
- −$2,233
- Est. tax savings @ 24.0%
- +$536
- After-tax cash flow
- $403/yr
For passive investors: Depreciation is non-cash, so a rental often shows a tax loss while cash-flowing — sheltering income. Rental losses are passive: they offset passive income freely, and up to $25,000/yr can offset ordinary (W-2) income if you actively participate and your MAGI is under $100k (phasing out to $0 by $150k); unused losses carry forward. On sale, claimed depreciation is recaptured at up to 25%, and gains may owe capital-gains tax (a 1031 exchange can defer both). Figures are a year-1 estimate at your 24.0% rate — not tax advice; consult a CPA.
Schools (NCES district)
- District
- Milwaukee School District
- NCES district ID
- 5509600
- Math proficiency
- 10% ▼ -5.00%
- Reading proficiency
- 18% ▬ 0.00%
- Median HH income
- $36,339
- Composite
- 11.61/100
- National rank
- #9696
- State rank
- #337 of 342 in WI
Livability — Milwaukee
- Score
- 81/100
- State rank
- #55
- US rank
- #1534
Category grades
Schools grade is shown separately in the Schools card above.
Census & demographics
- Census place
- Milwaukee, WI
- County
- Milwaukee County · 926,379 people
- City population
- 573,768
- Metro
- Milwaukee-Waukesha, WI
- Population (ZIP)
- 30,345
- Household income
- $46,752
- Rent vs Own
- Severe rent burden
- 2202.0
Population outlook (Milwaukee County) Hauer SSP2
- Today (2025)
- 995,758 people
- By 2030
- 1,009,124 · +1.3%
- By 2040
- 1,028,128 · +3.3%
- By 2050
- 1,040,066 · +4.4%
- By 2075
- 1,057,849 · +6.2%
- By 2100
- 1,039,774 · +4.4%
Race, ethnicity, and origin ACS 2023
- Neighborhood character
- Predominantly Black (81%)
- Race & ethnicity
- Black 81% White 9% Hispanic / Latino 5% Two or more races 5% Asian 3%
- Hispanic origin (detail)
- Mexican 2% Puerto Rican 3%
- Common ancestry
- Romanian 1%
- Foreign-born
- 3% · Canada, Philippines, China
- Languages at home
- 93% English-only · Spanish 4% Other Asian/Pacific 2%
Political lean MEDSL · Milwaukee
- 2024 margin
- Solid D (+38.5) · D 68.3% · R 29.8% · Other 1.8%
- 2008→2024 swing
- +2.7pp toward D · 2008: 35.9pp · 2024: 38.5pp
- All cycles
- 2024: D+38.5 2020: D+39.9 2016: D+37.5 2012: D+34.6 2008: D+35.9
Not yet ingested
- Civics
- —
Market trends
- HPI YoY
- ▲ 1.33%
- Current HPI
- 381.0954
- Rent YoY
- ▲ 7.01%
- Metro
- Milwaukee-Waukesha, WI
- State GDP YoY
- ▲ 2.10%
- F500 in state
- 20
Industry mix (Fortune 500 HQ in WI)
| Industry | F500 HQs | Revenue |
|---|---|---|
| Industrial Machinery | 4 | $23B |
|
||
| Industrial Technology | 2 | $36B |
|
||
| Insurance | 1 | $36B |
|
||
| Professional Services | 1 | $19B |
|
||
| Utilities | 1 | $9B |
|
||
| Consumer Goods | 1 | $3B |
|
||
Price history
+402.0% since first listed3 events — show timeline
- 2026-05-21 Listed $124,999 METROMLS
- 1989-09-01 Sold (Public Records) $26,000 Public Records
- 1977-12-01 Sold (Public Records) $24,900 Public Records
Property tax history
+0.3%/yrLatest (2024): $2,247 · +2.4% YoY. Source: county tax records.
Cash-flow waterfall
monthlySold comps — $/sqft
last 12 mo · ≤1 miLoading sold comps…