 🏢 Co-op
30 S Cole Ave Unit 6 F · Spring Valley, NY
Flood risk 1/10 · Minimal
- FEMA flood zone
- X (unshaded)
- Chance of flooding over 30 yrs
- 0.0%
- Est. flood insurance / yr
- $473 – $860
Fire risk 1/10 · Minimal
- Est. fire insurance / yr
- $691 – $1,283
Heat risk 6/10 · Moderate
- Hot days now (above 99°F)
- 7 days/yr
- Hot days in 30 yrs
- 15 days/yr
Wind risk 4/10 · Minor
- Chance of severe wind over 30 yrs
- 23.0%
Air-quality risk 3/10 · Minor
- Unhealthy air days now
- 2 days/yr
- Unhealthy air days in 30 yrs
- 4 days/yr
Risk factors via First Street. Map © Google.
Why this score? — see what drove the F grade
The composite is a weighted blend of 9 inputs, each scored 0–100. Each bar is that input's sub-score; the figure is the points it added to the 100-point composite (weight × sub-score).
- ARV discount +7.5/15.0
- 1% rule +5.4/10.0
- Livability +3.4/5.0
- Schools +2.6/10.0
- Rent growth +2.5/5.0
- Condition / age +2.5/5.0
- Cash flow +0.0/30.0
- DSCR +0.0/10.0
- Appreciation +0.0/10.0
$215,000
🖨 Deal sheet 📄 Offer letter ✓ Due diligence
Listing remarks
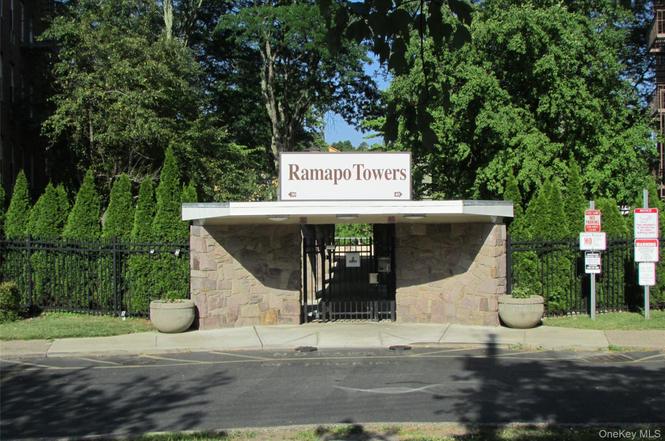
Welcome to your new home at Ramapo Towers! This delightful, updated 2-bedroom, 2-bathroom coop apartment is nestled on the 6th floor of this sought-after gated community, offering both security & tranquility. Enjoy a bright, open living space w/ large windows that flood the area with natural light. A new kitchen boasts contemporary cabinetry, sleek countertops, and modern appliances. The primary bedroom features a private en-suite bathroom offering privacy & a 2nd bedroom can serve as a guest room, home office, or private gym. Both bathrooms are updated with modern fixtures & finishes. Plenty of closet space for all your belongings. Gleaming, refinished hardwood floors thr
Key facts
- Gated community
- Private balcony
- Exercise room
Tags
Neighborhood map
What this means for you Summary
Snapshot
- This is a 2-bed/2.0-bath condo listed at $215k.
Deal economics
- At list price, monthly cash flow is $-1k ($-14k/yr) — negative.
- The deal already cash-flows at list — no discount required.
- Meets the 1% rule at list price ($2k rent vs $215k).
- Recommended offer: $202k (6.0% below list) — sets the bar for market timing.
- Cap rate -0.1% vs local median 2.2% in Spring Valley — below-typical yield; the buyer is paying a premium for something (appreciation thesis, condition, location) that the cap rate doesn't capture.
Location & tenants
- Location reads 67/100 on livability (#588 in NY) — a middle-class / working-renter tenant base. Strengths: commute A+, health & safety B+; Watch: employment D+, crime F, amenities F.
- East Ramapo Central School District (Spring Valley) (suburban): math 22% / reading 34% proficiency, ranked #576 of 590 in NY (top 98%) — low school quality limits family demand, transient renter base, plan for 1-2y turnover; 68% free/reduced lunch — lower-income household profile, screen leases tightly.
- Zoned schools: Elmwood Elementary School (math 19% / reading 32%, grade F, #1,821 of 2,108 statewide, top 86%, 522 students, 77% FRL); Chestnut Ridge Middle School (math 9% / reading 30%, grade F, #685 of 729 statewide, top 94%, 646 students, 83% FRL); Spring Valley High School (math 67% / reading 77%, grade B+, #677 of 1,100 statewide, top 63%, 1,434 students, 82% FRL).
- Market conditions: 259 active listings in the ZIP; 10 comparable units currently listed for rent nearby; rentals lingering (median 44d on market — plan ~5-8 weeks vacancy on turnover, expect pricing pressure); 60% of comp listings sitting > 30 days — soft ceiling on asking rent; 429 units permitted in Rockland County in 2024 (231 in 5+ unit buildings).
Forward outlook
- Local home prices are declining (-3.0%/yr); year-one equity from $1k of loan paydown is wiped out by about $6k of value loss. Plan a longer hold.
- Rockland County population projected at +7% by 2050 — modest demand growth; plan on rents tracking national, not racing it.
Negotiation context
- It's been on market 87 days — a 6% lower offer ($202k) is reasonable based on typical stale-listing flexibility.
- 2 sale attempts since 2y ago; this cycle's ask has dropped $15k (7%) from the opening price — seller is motivated, your offer sets the floor, not the list.
Risks & watch-outs
- Watch-outs: HOA is 64% of rent.
- Climate carrying-cost: extreme-heat days projected 7→15/yr by 2055 (HVAC capex compounding) — expect insurance premiums to compound above CPI over the hold.
Questions for the listing agent
- What do current leases actually rent for vs. the listed asking? Can we see a recent rent roll and the last 12 months of T-12 income?
- It's been on market 87 days. Have you received any prior offers? Is the seller open to a 6% concession, seller financing, or rate buy-down credit?
- Built in 1965 — when were the roof, HVAC, electrical panel, plumbing, and water heater last replaced?
- What does the HOA fee cover, when was the last increase, and are there any pending special assessments or reserve-fund shortfalls?
- Any open or pending special assessments — roof, HVAC, plumbing, elevator, façade? What's the per-unit balance and payoff schedule, and is the seller paying it off at close or rolling it to the buyer?
- Why hasn't it sold? Are there any deal-killer items the seller is aware of (foundation, flood, title, zoning, code violations)?
- Is there a deadline driving the sale (1031 exchange, divorce, estate, relocation)? That informs how much negotiation room exists.
- Crime grade is F in this area — have there been break-ins, vandalism, or insurance claims at this property in the last 3 years? What carrier currently insures it and at what premium?
- The area grade is low — what's the realistic commute time and amenity access for the typical tenant pool here? Any planned neighborhood developments (good or bad) we should know about?
- What's the average days-on-market for RENTAL listings here right now (not sales)? A rising rental-DOM trend means longer vacancies and softer asking-rent achievability than the comps imply.
- What's the recent tenant-quality profile in this submarket — average credit score on applications, eviction rate, late-payment / NSF rate, and stable-employment percentage? A property-management company in the area should have these aggregated.
- How much new apartment / multifamily construction is in the pipeline within 1–3 miles? Heavy new supply (>2% of stock underway) typically softens rents 12–24 months out; light construction supports rent growth.
Investment metrics
- 1% rule
- 1.04% ✓
- Cap rate
- -0.14%
- Cash-on-cash
- -22.98%
- DSCR
- -0.02
- GRM
- 8.0
CMA / ARV
No comps found within radius.
Projected returns pro-forma
-3.0% appreciation · 3.0% rent growth · sell at horizon
- IRR
- -64.8%
- Equity multiple
- -0.78×
- Total profit
- $-107,356
- Equity at exit
- $32,057
- IRR
- —
- Equity multiple
- -2.06×
- Total profit
- $-184,326
- Equity at exit
- $18,589
Cash invested: $60,200 (down + closing). Projections, not guarantees.
Landlord ↔ Tenant lean methodology
- Overall (STATE)
- 15 Strongly Tenant-Friendly
- State New York
- 15 Strongly Tenant-Friendly · D+10
- County
- — inherits STATE
- City
- — inherits STATE
ZIP-level market 10977
- Active inventory
- 259
- Price-to-rent
- 8.0×
Monthly cashflow live
- Estimated rent
- $2,234 high interval (Pro) →
- Mortgage (P&I)
- −$1,127
- Tax est. 1.5%
- −$269 /mo · $3,225/yr
- Insurance
- −$90
- HOA est. from 1 same-building comp
- −$1,432
- Vacancy / Maint / Mgmt
- −$469
- Net cashflow
- $-1,153
Break-even live
UW: 25.0% down · 7.5% · 30yr · 1.5% tax · 5.0% vac · 8.0% maint · 8.0% mgmt
Financing live
Cash to close
- Down payment
- $53,750
- Closing costs
- $6,450
- Reserves months
- —
- Total cash needed
- —
Loan-product check · same deal, 3 products live
Conventional
25% down · 7.5% · 30yr
- Down + closing
- —
- Monthly P&I
- —
- Monthly cashflow
- —
- DSCR
- —
- Eligible?
- —
Personal DTI + credit; lowest rate.
DSCR
20% down · 8.5% · 30yr
- Down + closing
- —
- Monthly P&I
- —
- Monthly cashflow
- —
- DSCR
- —
- Eligible?
- —
No personal income docs; deal must DSCR.
Hard money
10% down · 12.0% · 12mo
- Down + closing
- —
- Monthly P&I
- —
- Monthly cashflow
- —
- DSCR
- —
- Eligible?
- —
Short-term bridge; refi at stabilization.
Rent comps 10 comps
| Address | Beds | Baths | Sqft | Rent | $/sqft | DOM | Units | Dist |
|---|---|---|---|---|---|---|---|---|
| 15 Summit Ave Spring Valley, NY | 1.0–2.0 | 1.0 | 800 | $1,700 | $2.12 | 43d | 2 | 0.15mi |
| 709 Kennedy Dr Spring Valley, NY | 2.0 | 1.0 | 817 | $2,500 | $3.06 | 7d | 1 | 0.47mi |
| 715 Kennedy Dr Spring Valley, NY | 2.0 | 2.0 | 1039 | $2,650 | $2.55 | 24d | 1 | 0.48mi |
| 127 Pipetown Hill Rd Nanuet, NY | 2.0 | 2.5 | 1065 | $2,750 | $2.58 | 43d | 1 | 0.89mi |
| 304 Town Hill Rd Nanuet, NY | 1.0 | 1.0 | 800 | $2,625 | $3.28 | 4d | 1 | 0.95mi |
| 401 Town Hill Rd Unit 1D Nanuet, NY | 1.0 | 1.0 | 844 | $2,400 | $2.84 | 43d | 1 | 0.95mi |
| 285 Sneden Pl W Unit 285 Spring Valley, NY | 1.0 | 1.5 | 850 | $2,650 | $3.12 | 43d | 1 | 1.07mi |
| 68 Sneden Pl W Unit 68 Spring Valley, NY | 1.0 | 1.0 | 800 | $1,850 | $2.31 | 22d | 1 | 1.10mi |
| 80 New Holland Vlg Nanuet, NY | 1.0 | 1.0 | 819 | $2,500 | $3.05 | 43d | 1 | 1.20mi |
| 70 Chester Ln Nanuet, NY | 1.0 | 1.0 | 949 | $2,375 | $2.50 | 43d | 1 | 1.40mi |
HOA detail condo
- Monthly dues
- $0 · $0/yr
- Likely covers
- gymsecurity
- Assessments
- None detected in remarks — confirm with the listing agent.
Listing history 5 events
-
2025-12-16status Pending
-
2025-10-21price $215,000
-
2025-09-19$230,000 Active
-
2024-08-06status Pending
-
2024-06-24$195,000 Active
ⓘ Source: listings_history table (triggers on properties + properties_extension) + one-shot
backfill from property_details.listing_events for pre-trigger history.
Climate risk First Street
- Flood 1/10 Low FEMA zone X (unshaded) · 0% chance over 30 yrs
- Wildfire 1/10 Low
- Heat 6/10 Major 7 d/yr ≥99°F today · 15 d/yr by 30 yrs out
- Wind 4/10 Moderate 23% chance of damaging wind over 30 yrs
- Air quality 3/10 Moderate 2 unhealthy d/yr today · 4 by 30 yrs out
Nearby sold comps map
Loading sold comps map…
Walkable amenities ~0.75 mi
Loading nearby amenities…
Taxation est. · year 1
- Rental income
- $26,808
- − Mortgage interest
- −$12,043
- − Property taxes
- −$3,225
- − Insurance
- −$1,075
- − Repairs & maintenance
- −$2,145
- − Management
- −$2,145
- − HOA
- −$17,184
- − Depreciation
- −$6,255
- Taxable loss
- −$17,263
- Est. tax savings @ 24.0%
- +$4,143
- After-tax cash flow
- $-9,692/yr
For passive investors: Depreciation is non-cash, so a rental often shows a tax loss while cash-flowing — sheltering income. Rental losses are passive: they offset passive income freely, and up to $25,000/yr can offset ordinary (W-2) income if you actively participate and your MAGI is under $100k (phasing out to $0 by $150k); unused losses carry forward. On sale, claimed depreciation is recaptured at up to 25%, and gains may owe capital-gains tax (a 1031 exchange can defer both). Figures are a year-1 estimate at your 24.0% rate — not tax advice; consult a CPA.
Schools (NCES district)
- District
- East Ramapo Central School District (Spring Valley)
- NCES district ID
- 3627810
- Math proficiency
- 22% ▼ -10.00%
- Reading proficiency
- 34% ▼ -2.00%
- Median HH income
- $61,547
- Composite
- 25.6/100
- National rank
- #7418
- State rank
- #576 of 590 in NY
Livability — Spring Valley
- Score
- 67/100
- State rank
- #588
- US rank
- #10623
Category grades
Schools grade is shown separately in the Schools card above.
Census & demographics
- Census place
- Spring Valley, NY
- City population
- 71,465
- Population (ZIP)
- 71,465
Population outlook (Rockland County) Hauer SSP2
- Today (2025)
- 339,642 people
- By 2030
- 345,987 · +1.9%
- By 2040
- 357,178 · +5.2%
- By 2050
- 362,456 · +6.7%
- By 2075
- 367,281 · +8.1%
- By 2100
- 328,211 · -3.4%
Race, ethnicity, and origin ACS 2023
- Neighborhood character
- Diverse neighborhood (Simpson 0.62)
- Race & ethnicity
- White 55% Hispanic / Latino 23% Black 16% Two or more races 5% Asian 3%
- Hispanic origin (detail)
- Mexican 1% Puerto Rican 2% Dominican 2%
- Common ancestry
- Hispanic 7% Romanian 5% Italian 2%
- Foreign-born
- 27% · Canada
- Languages at home
- 31% English-only · German/W. Germanic 32% Spanish 21% French/Haitian/Cajun 10%
Political lean MEDSL · Rockland
- 2024 margin
- R (+11.8) · D 44.1% · R 55.9%
- 2008→2024 swing
- -17.7pp toward R · 2008: 5.9pp · 2024: -11.8pp
- All cycles
- 2024: R+11.8 2020: D+1.7 2016: D+5.1 2012: D+6.6 2008: D+5.9
Not yet ingested
- Civics
- —
Market trends
- HPI YoY
- ▼ -518.82%
- Current HPI
- 378.2133
- Rent YoY
- —
- Metro
- —
- State GDP YoY
- ▲ 2.60%
- F500 in state
- 92
Industry mix (Fortune 500 HQ in NY)
| Industry | F500 HQs | Revenue |
|---|---|---|
| Financial Services | 10 | $950B |
|
||
| Consumer Goods | 9 | $162B |
|
||
| Insurance | 4 | $225B |
|
||
| Telecommunications | 2 | $144B |
|
||
| Pharmaceuticals | 2 | $112B |
|
||
| Media / Entertainment | 2 | $69B |
|
||
Price history
+10.3% since first listed5 events — show timeline
- 2025-12-16 Pending — OneKey® MLS as Distributed by MLS Grid
- 2025-10-21 Price Changed $215,000 OneKey® MLS as Distributed by MLS Grid
- 2025-09-19 Listed $230,000 OneKey® MLS as Distributed by MLS Grid
- 2024-08-06 Pending — OneKey® MLS as Distributed by MLS Grid
- 2024-06-24 Listed $195,000 OneKey® MLS as Distributed by MLS Grid
Cash-flow waterfall
monthlySold comps — $/sqft
last 12 mo · ≤1 miLoading sold comps…