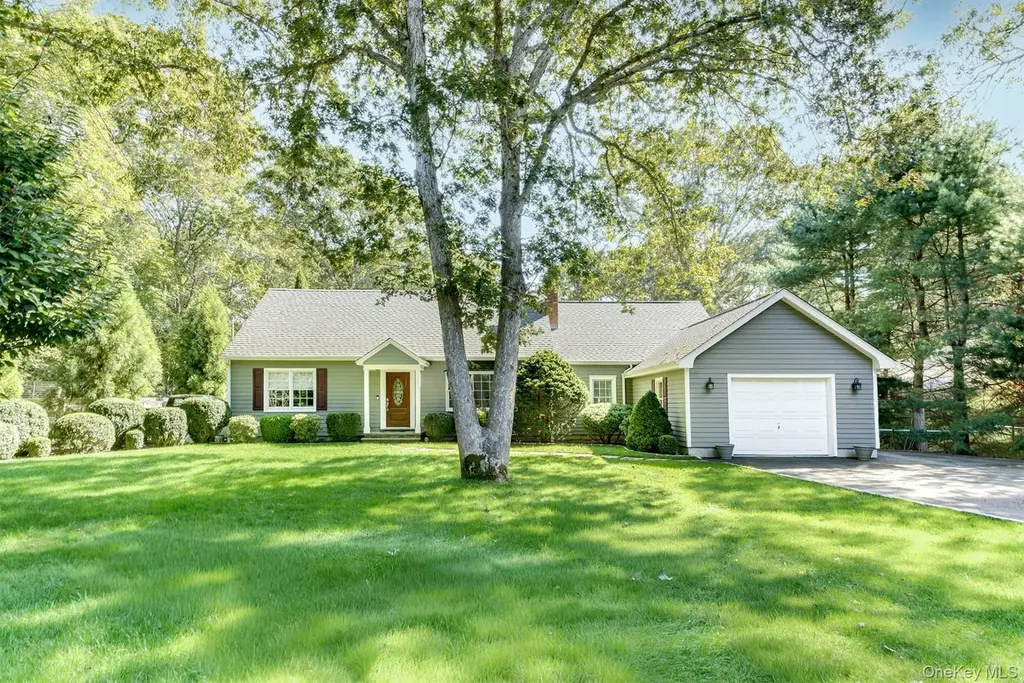
116 Hands Creek Rd · Northwest Harbor, NY
Flood risk 1/10 · Minimal
- FEMA flood zone
- X (unshaded)
- Chance of flooding over 30 yrs
- 0.0%
- Est. flood insurance / yr
- $473 – $860
Fire risk 3/10 · Minor
- Est. fire insurance / yr
- $691 – $1,283
Heat risk 4/10 · Minor
- Hot days now (above 90°F)
- 7 days/yr
- Hot days in 30 yrs
- 19 days/yr
Wind risk 8/10 · Major
- Chance of severe wind over 30 yrs
- 80.0%
Air-quality risk 3/10 · Minor
- Unhealthy air days now
- 2 days/yr
- Unhealthy air days in 30 yrs
- 3 days/yr
Risk factors via First Street. Map © Google.
Why this score? — see what drove the C- grade
The composite is a weighted blend of 9 inputs, each scored 0–100. Each bar is that input's sub-score; the figure is the points it added to the 100-point composite (weight × sub-score).
- Cash flow +18.6/30.0
- DSCR +5.8/10.0
- Schools +5.8/10.0
- ARV discount +5.6/15.0
- Rent growth +5.0/5.0
- 1% rule +3.8/10.0
- Livability +3.0/5.0
- Condition / age +2.5/5.0
- Appreciation +0.0/10.0
$2,645,000
🖨 Deal sheet (PDF) 📄 Offer letter ✓ Due diligence
Listing remarks
RENOVATED ESCAPE WITH HEATED POOL & POOL HOUSE In the heart of East Hampton, just outside the Village, this charming, turnkey traditional home delivers immediate Hamptons luxury. Sited on over a half-acre with mature plantings, the 3,294 +/- sq. ft. home has 4 bedrooms, 3.5 baths, 2 fireplaces, attached garage, heated pool, and pool house. Renovated in 2025 with new marble bathrooms, sanded floors, fresh paint - totally turnkey for immediate luxury living. Interiors beam with natural light against gorgeous hardwood floors, wood-paneled walls, and sophisticated coffered ceilings. An open-concept living welcomes indoor-outdoor living with multiple sliding glass doors, ready for relaxati
Key facts
- Pool house
- Open-concept living
- Heated pool
Tags
Property features AI
Exterior
- Home design: - Property type and detailed interior/exterior features are not available without signing in or registering
Neighborhood map
What this means for you Summary
Snapshot
- This is a 4-bed/3.5-bath single-family listed at $2.65M.
Deal economics
- At list price, monthly cash flow is $3k ($31k/yr) — positive.
- The deal already cash-flows at list — no discount required.
- To meet the 1% rule (rent ≥ 1% of price), the offer needs to be $2.32M (12.4% below list).
- Recommended offer: $2.32M (12.4% below list) — sets the bar for 1% rule.
Location & tenants
- Location reads 60/100 on livability (#1,007 in NY) — a middle-class / working-renter tenant base. Strengths: crime A+, employment A+; Watch: amenities F, commute F, cost of living F.
- East Hampton Union Free School District (town): math 62% / reading 66% proficiency, ranked #159 of 590 in NY (top 27%) — acceptable for families but not a draw, mixed tenant base, ~2y average lease.
- Zoned schools: John M Marshall Elementary School (math 57% / reading 62%, grade B-, #745 of 2,108 statewide, top 39%, 548 students, 51% FRL); East Hampton Middle School (math 39% / reading 60%, grade C, #280 of 729 statewide, top 40%, 265 students, 42% FRL); East Hampton High School (math 94% / reading 98%, grade A+, #71 of 1,100 statewide, top 7%, 1,015 students, 40% FRL) — zoned schools average 44% FRL vs 26% district-wide (18 pts higher); higher-poverty schools than district average — tighter screening recommended.
- Market conditions: Rents rising fast (+12.3%/yr); 136 active listings in the ZIP; 9 comparable units currently listed for rent nearby; rentals lingering (median 46d on market — plan ~5-8 weeks vacancy on turnover, expect pricing pressure); 67% of comp listings sitting > 30 days — soft ceiling on asking rent; high-income renter base; 1,366 units permitted in Suffolk County in 2024 (216 in 5+ unit buildings).
- At $23,158/mo this rent would consume 214% of the median local household income ($130k/yr) (locally 896% of renters already pay >50% of income on rent) — very limited rent-growth headroom before tenants either downsize or default.
Forward outlook
- Local home prices are declining (-3.0%/yr); year-one equity from $18k of loan paydown is wiped out by about $79k of value loss. Plan a longer hold.
- Suffolk County population projected to shrink 5% by 2050 — rents likely to lag national; underwrite the cash flow, not the appreciation.
- At projected returns (-3.0% appreciation + 8.0% rent growth), your $741k cash investment doubles in ~10 years — after that, you're playing with house money.
Negotiation context
- It's been on market 162 days — a 12% lower offer ($2.33M) is reasonable based on typical stale-listing flexibility.
- Current owner paid $228k; list at $2.65M implies a 1060% gain — meaningful room to come down on a strong offer.
Risks & watch-outs
- Climate carrying-cost: severe wind risk, 80% chance of damaging wind over 30y — expect insurance premiums to compound above CPI over the hold.
Questions for the listing agent
- It's been on market 162 days. Have you received any prior offers? Is the seller open to a 12% concession, seller financing, or rate buy-down credit?
- Built in 1964 — when were the roof, HVAC, electrical panel, plumbing, and water heater last replaced?
- Why hasn't it sold? Are there any deal-killer items the seller is aware of (foundation, flood, title, zoning, code violations)?
- Is there a deadline driving the sale (1031 exchange, divorce, estate, relocation)? That informs how much negotiation room exists.
- Schools are D-rated, which usually means shorter tenancies and higher turnover. Who's the typical renter profile here, and what's been the actual vacancy rate?
- What's the average days-on-market for RENTAL listings here right now (not sales)? A rising rental-DOM trend means longer vacancies and softer asking-rent achievability than the comps imply.
- What's the recent tenant-quality profile in this submarket — average credit score on applications, eviction rate, late-payment / NSF rate, and stable-employment percentage? A property-management company in the area should have these aggregated.
- How much new for-sale + rental construction is in the pipeline within 1–3 miles? Heavy new supply typically softens prices + rents 12–24 months out; constrained supply supports both.
Investment metrics
- 1% rule
- 0.88% ✗
- Cap rate
- 7.45%
- Cash-on-cash
- 4.13%
- DSCR
- 1.18
- GRM
- 9.5
CMA / ARV
- ARV (on-the-fly)
- $2,539,674
- Comps found
- 2
Show comp detail 2 sales within ~0.75 mi
| Address | Dist | Beds/Ba | Sqft | Sold | Price | $/sf | Match |
|---|---|---|---|---|---|---|---|
| 116 Hands Creek Rd | 0.00mi | 4/3.5 | 3,294 (0%) | 0mo | $2,375,000 | $721 | 100 |
| 2 Grape Arbor Ln | 0.53mi | 4/4.0 | 3,600 (+9%) | 14mo | $2,775,000 | $771 | 47 |
Match score weights: distance 35% · size 25% · config 20% · recency 20%. Top-matched comps best support the ARV.
Projected returns pro-forma
-3.0% appreciation · 8.0% rent growth · sell at horizon
- IRR
- -5.0%
- Equity multiple
- 0.80×
- Total profit
- $-145,045
- Equity at exit
- $394,378
- IRR
- 9.3%
- Equity multiple
- 1.86×
- Total profit
- $634,901
- Equity at exit
- $228,691
Cash invested: $740,600 (down + closing). Projections, not guarantees.
Landlord ↔ Tenant lean methodology
- Overall (STATE)
- 15 Strongly Tenant-Friendly
- State New York
- 15 Strongly Tenant-Friendly · D+10
- County
- — inherits STATE
- City
- — inherits STATE
ZIP-level market 11937
- Rents YoY
- 12.3%
- Active inventory
- 136
- Price-to-rent
- 9.5×
Monthly cashflow live
- Estimated rent
- $23,158 medium interval (Pro) →
- Mortgage (P&I)
- −$13,871
- Tax from tax record
- −$772 /mo · $9,267/yr
- Insurance
- −$1,102
- HOA
- −$0
- Lot rent
- −$0
- Vacancy / Maint / Mgmt
- −$4,863
- Net cashflow
- $2,550
Break-even live
Sensitivity live
| Price | -10% $4,047 | -5% $3,298 | +0% $2,550 | +5% $1,801 | +10% $1,052 |
|---|---|---|---|---|---|
| Rent | -10% $720 | -5% $1,635 | +0% $2,550 | +5% $3,464 | +10% $4,379 |
| Rate | -1.0pp $3,882 | -0.5pp $3,222 | base $2,550 | +0.5pp $1,864 | +1.0pp $1,167 |
UW: 25.0% down · 7.5% · 30yr · 1.5% tax · 5.0% vac · 8.0% maint · 8.0% mgmt
Financing live
Cash to close
- Down payment
- $661,250
- Closing costs
- $79,350
- Reserves months
- —
- Total cash needed
- —
Loan-product check · same deal, 3 products live
Conventional
25% down · 7.5% · 30yr
- Down + closing
- —
- Monthly P&I
- —
- Monthly cashflow
- —
- DSCR
- —
- Eligible?
- —
Personal DTI + credit; lowest rate.
DSCR
20% down · 8.5% · 30yr
- Down + closing
- —
- Monthly P&I
- —
- Monthly cashflow
- —
- DSCR
- —
- Eligible?
- —
No personal income docs; deal must DSCR.
Hard money
10% down · 12.0% · 12mo
- Down + closing
- —
- Monthly P&I
- —
- Monthly cashflow
- —
- DSCR
- —
- Eligible?
- —
Short-term bridge; refi at stabilization.
Rent comps 9 comps
| Address | Beds | Baths | Sqft | Rent | $/sqft | DOM | Units | Dist |
|---|---|---|---|---|---|---|---|---|
| 7 Miller Ln W East Hampton, NY | 4.0 | 3.5 | 2600 | $90,000 | $34.62 | 46d | 1 | 0.81mi |
| 54 Miller Ln E East Hampton, NY | 5.0 | 5.5 | 3850 | $40,000 | $10.39 | 27d | 1 | 0.84mi |
| 15 Rivers Rd East Hampton, NY | 3.0 | 4.0 | 2400 | $45,000 | $18.75 | 46d | 1 | 1.07mi |
| 36 Barnes Ave East Hampton, NY | 4.0 | 3.0 | 2346 | $55,000 | $23.44 | 27d | 1 | 1.10mi |
| 643 Stephen Hands Path East Hampton, NY | 4.0 | 3.5 | 3200 | $65,000 | $20.31 | 46d | 1 | 1.15mi |
| 210 Treescape Dr East Hampton, NY | 3.0 | 2.0 | 2400 | $25,000 | $10.42 | 46d | 1 | 1.35mi |
| 3 Mulford Ave East Hampton, NY | 4.0 | 2.5 | 2700 | $30,000 | $11.11 | 46d | 1 | 1.42mi |
| 121 Pantigo Rd East Hampton, NY | 5.0 | 4.5 | 3400 | $40,000 | $11.76 | 27d | 1 | 1.44mi |
| 4 Marion Ln East Hampton, NY | 4.0 | 3.0 | 3200 | $90,000 | $28.12 | 46d | 1 | 1.46mi |
Listing history 4 events
-
2026-04-29status Pending
-
2025-11-18$2,645,000 Active
-
1989-03-06soldstatus $228,000
-
1985-04-05soldstatus $175,000
ⓘ Source: listings_history table (triggers on properties + properties_extension) + one-shot
backfill from property_details.listing_events for pre-trigger history.
Tax reassessment forecast NY · Partial reset (capped growth)
- Current annual tax
- $9,267 · $772/mo
- Projected year-2 tax
- $26,984 · $2,249/mo
- Expected delta
- +$17,717/yr (+$1,476/mo · 191.2%)
ⓘ Screening estimate from a state-policy table — verify with the county assessor before closing.
Climate risk First Street
- Flood 1/10 Low FEMA zone X (unshaded) · 0% chance over 30 yrs
- Wildfire 3/10 Moderate
- Heat 4/10 Moderate 7 d/yr ≥90°F today · 19 d/yr by 30 yrs out
- Wind 8/10 Severe 80% chance of damaging wind over 30 yrs
- Air quality 3/10 Moderate 2 unhealthy d/yr today · 3 by 30 yrs out
Nearby sold comps map
Loading sold comps map…
Walkable amenities ~0.75 mi
Loading nearby amenities…
Taxation est. · year 1
- Rental income
- $277,892
- − Mortgage interest
- −$148,161
- − Property taxes
- −$9,267
- − Insurance
- −$13,225
- − Repairs & maintenance
- −$22,231
- − Management
- −$22,231
- − Depreciation
- −$76,945
- Taxable loss
- −$14,169
- Est. tax savings @ 24.0%
- +$3,401
- After-tax cash flow
- $33,995/yr
For passive investors: Depreciation is non-cash, so a rental often shows a tax loss while cash-flowing — sheltering income. Rental losses are passive: they offset passive income freely, and up to $25,000/yr can offset ordinary (W-2) income if you actively participate and your MAGI is under $100k (phasing out to $0 by $150k); unused losses carry forward. On sale, claimed depreciation is recaptured at up to 25%, and gains may owe capital-gains tax (a 1031 exchange can defer both). Figures are a year-1 estimate at your 24.0% rate — not tax advice; consult a CPA.
Schools (NCES district)
- District
- East Hampton Union Free School District
- NCES district ID
- 3609660
- Math proficiency
- 62% ▼ -5.00%
- Reading proficiency
- 66% ▲ 2.00%
- Median HH income
- $86,309
- Composite
- 57.85/100
- National rank
- #1046
- State rank
- #159 of 590 in NY
Livability — Northwest Harbor
- Score
- 60/100
- State rank
- #1007
- US rank
- #19577
Category grades
Schools grade is shown separately in the Schools card above.
Census & demographics
- Census place
- Northwest Harbor, NY
- County
- Suffolk County · 679,920 people
- City population
- 21,806
- Metro
- New York-Newark-Jersey City, NY-NJ-PA
- Population (ZIP)
- 21,882
- Household income
- $129,883
- Rent vs Own
- Severe rent burden
- 896.0
Population outlook (Suffolk County) Hauer SSP2
- Today (2025)
- 1,505,262 people
- By 2030
- 1,498,318 · -0.5%
- By 2040
- 1,471,101 · -2.3%
- By 2050
- 1,424,848 · -5.3%
- By 2075
- 1,337,157 · -11.2%
- By 2100
- 1,217,720 · -19.1%
Race, ethnicity, and origin ACS 2023
- Neighborhood character
- Majority White (61%)
- Race & ethnicity
- White 61% Hispanic / Latino 32% Two or more races 23% Black 2% Asian 2%
- Hispanic origin (detail)
- Mexican 2% Puerto Rican 1%
- Common ancestry
- Romanian 5% Scotch-Irish 4% Italian 2%
- Foreign-born
- 25% · Canada, Guatemala, Jamaica
- Languages at home
- 68% English-only · Spanish 28% Other Indo-European 1% Russian/Polish/Slavic 1%
Political lean MEDSL · Suffolk
- 2024 margin
- Lean R (+10.0) · D 45.0% · R 55.0%
- 2008→2024 swing
- -16.0pp toward R · 2008: 6.0pp · 2024: -10.0pp
- All cycles
- 2024: R+10.0 2020: R+0.0 2016: R+8.2 2012: D+2.9 2008: D+6.0
Not yet ingested
- Civics
- —
Market trends
- HPI YoY
- ▼ -285.21%
- Current HPI
- 444.1499
- Rent YoY
- ▲ 12.28%
- Metro
- New York-Newark-Jersey City, NY-NJ-PA
- State GDP YoY
- ▲ 2.60%
- F500 in state
- 92
Industry mix (Fortune 500 HQ in NY)
| Industry | F500 HQs | Revenue |
|---|---|---|
| Financial Services | 10 | $950B |
|
||
| Consumer Goods | 9 | $162B |
|
||
| Insurance | 4 | $225B |
|
||
| Telecommunications | 2 | $144B |
|
||
| Pharmaceuticals | 2 | $112B |
|
||
| Media / Entertainment | 2 | $69B |
|
||
Price history
+1411.4% since first listed4 events — show timeline
- 2026-04-29 Pending — OneKey® MLS as Distributed by MLS Grid
- 2025-11-18 Listed $2,645,000 OneKey® MLS as Distributed by MLS Grid
- 1989-03-06 Sold (Public Records) $228,000 Public Records
- 1985-04-05 Sold (Public Records) $175,000 Public Records
Property tax history
+2.7%/yrLatest (2025): $9,267 · +0.0% YoY. Source: county tax records.
Cash-flow waterfall
monthlySold comps — $/sqft
last 12 mo · ≤1 miLoading sold comps…