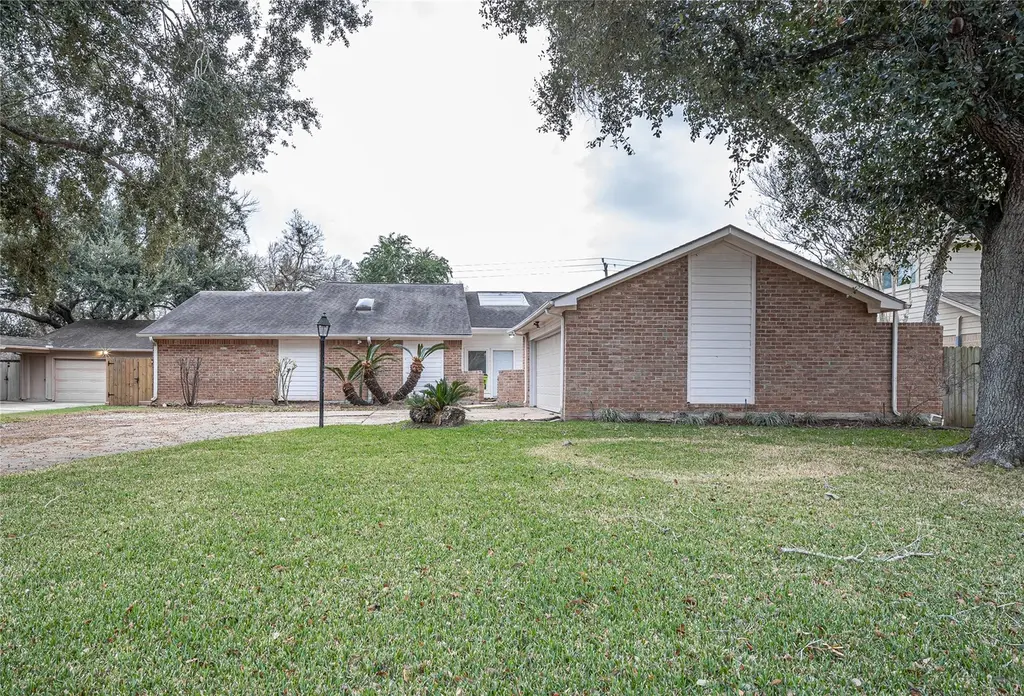
2703 Glenn Lakes Ln · Missouri City, TX
Flood risk 3/10 · Minor
- FEMA flood zone
- X (unshaded)
- Chance of flooding over 30 yrs
- 0.17%
- Est. flood insurance / yr
- $507 – $1,088
Fire risk 1/10 · Minimal
- Est. fire insurance / yr
- $1,222 – $2,270
Heat risk 9/10 · Severe
- Hot days now (above 111°F)
- 7 days/yr
- Hot days in 30 yrs
- 23 days/yr
Wind risk 9/10 · Severe
- Chance of severe wind over 30 yrs
- 99.0%
Air-quality risk 3/10 · Minor
- Unhealthy air days now
- 2 days/yr
- Unhealthy air days in 30 yrs
- 3 days/yr
Risk factors via First Street. Map © Google.
Why this score? — see what drove the C- grade
The composite is a weighted blend of 9 inputs, each scored 0–100. Each bar is that input's sub-score; the figure is the points it added to the 100-point composite (weight × sub-score).
- ARV discount +15.0/15.0
- Cash flow +11.2/30.0
- Schools +4.5/10.0
- 1% rule +4.4/10.0
- Appreciation +4.2/10.0
- Livability +3.4/5.0
- DSCR +3.3/10.0
- Rent growth +2.5/5.0
- Condition / age +2.5/5.0
$270,000
🖨 Deal sheet 📄 Offer letter ✓ Due diligence
Listing remarks MLS
Big house with atrium inside the house, open and light. 1/2 bath has shower, and just remodeled and few minor touch up job remain.
Key facts
- Remodeled
- 0.27 acre lot
- 2 garage spots
Tags
Neighborhood map
What this means for you Summary
Snapshot
- This is a 4-bed/3.0-bath single-family listed at $270k.
Deal economics
- At list price, monthly cash flow is $-105 ($-1k/yr) — negative.
- To cash-flow at today's rent, offer at most $251k (6.9% below list).
- To meet the 1% rule (rent ≥ 1% of price), the offer needs to be $255k (5.7% below list).
- Recommended offer: $251k (6.9% below list) — sets the bar for cash-flow.
- Cap rate 5.8% vs local median 3.5% in Missouri City — top-decile yield for the area; either an underpriced asset or a hidden risk that comps aren't pricing in. Stress-test before assuming the spread holds.
Location & tenants
- Location reads 67/100 on livability (#526 in TX) — a middle-class / working-renter tenant base. Strengths: housing A+, crime A, employment A; Watch: amenities F, commute F, health & safety F.
- Fort Bend ISD (suburban): math 44% / reading 53% proficiency, ranked #140 of 826 in TX (top 17%) — families likely to look elsewhere, expect single-tenant / working-renter base with shorter leases.
- Market conditions: Rents soft (-0.1%/yr); 1215 active listings in the ZIP; 14 comparable units currently listed for rent nearby; rentals lingering (median 44d on market — plan ~5-8 weeks vacancy on turnover, expect pricing pressure); 50% of comp listings sitting > 30 days — soft ceiling on asking rent; high-income renter base; 12,093 units permitted in Fort Bend County in 2024 (815 in 5+ unit buildings).
Forward outlook
- Local home prices are declining (-1.7%/yr); year-one equity from $2k of loan paydown is wiped out by about $5k of value loss. Plan a longer hold.
- Fort Bend County population projected at +75% by 2050 — long-run rental-demand tailwind backs the buy-and-hold thesis.
Negotiation context
- Only 10 days on market — expect competitive offers; lowballing is unlikely to land.
- 3 sale attempts since 13y ago; this cycle's ask is 12173% above the opening price — seller raised mid-cycle; expect resistance to lowballs.
Risks & watch-outs
- Climate carrying-cost: severe wind risk, 99% chance of damaging wind over 30y; extreme-heat days projected 7→23/yr by 2055 (HVAC capex compounding) — expect insurance premiums to compound above CPI over the hold.
Questions for the listing agent
- What do current leases actually rent for vs. the listed asking? Can we see a recent rent roll and the last 12 months of T-12 income?
- Built in 1979 — when were the roof, HVAC, electrical panel, plumbing, and water heater last replaced?
- What does the HOA fee cover, when was the last increase, and are there any pending special assessments or reserve-fund shortfalls?
- Is there a deadline driving the sale (1031 exchange, divorce, estate, relocation)? That informs how much negotiation room exists.
- Schools are B-rated — typically a magnet for longer-tenancy family renters. What's the average tenant stay here, and is there a school-zone premium baked into asking?
- What's the average days-on-market for RENTAL listings here right now (not sales)? A rising rental-DOM trend means longer vacancies and softer asking-rent achievability than the comps imply.
- What's the recent tenant-quality profile in this submarket — average credit score on applications, eviction rate, late-payment / NSF rate, and stable-employment percentage? A property-management company in the area should have these aggregated.
- How much new for-sale + rental construction is in the pipeline within 1–3 miles? Heavy new supply typically softens prices + rents 12–24 months out; constrained supply supports both.
Investment metrics
- 1% rule
- 0.94% ✗
- Cap rate
- 5.83%
- Cash-on-cash
- -1.67%
- DSCR
- 0.93
- GRM
- 8.8
CMA / ARV
- ARV (median comp)
- $391,958
- List price
- $270,000
- Delta
- -26.01%
- Verdict
- UNDERPRICED
- Comps
- 20 within 1.0 mi
Show comp detail 12 sales within ~0.75 mi
| Address | Dist | Beds/Ba | Sqft | Sold | Price | $/sf | Match |
|---|---|---|---|---|---|---|---|
| 2807 Glenn Lakes Ln | 0.15mi | 4/3.5 | 2,576 (+6%) | 2mo | $359,000 | $139 | 80 |
| 2814 Plantation Wood Ln | 0.17mi | 4/2.5 | 2,603 (+7%) | 3mo | $365,000 | $140 | 76 |
| 3923 Kiamesha Dr | 0.34mi | 4/2.5 | 2,589 (+6%) | 2mo | $399,000 | $154 | 70 |
| 3607 Point Clear Dr | 0.71mi | 4/3.0 | 2,467 (+1%) | 0mo | $369,900 | $150 | 64 |
| 2655 Turning Row Ln | 0.54mi | 4/2.5 | 2,604 (+7%) | 1mo | $349,900 | $134 | 61 |
| 3126 Glenn Lakes Ln | 0.65mi | 4/2.5 | 2,545 (+4%) | 3mo | $399,000 | $157 | 57 |
| 3815 Lamplighter Cir | 0.69mi | 4/2.5 | 2,343 (-4%) | 4mo | $300,000 | $128 | 56 |
| 3119 Millbrook Ln | 0.63mi | 4/2.5 | 2,269 (-7%) | 2mo | $299,900 | $132 | 55 |
| 3131 Stoney Brook Ln | 0.72mi | 4/3.0 | 2,639 (+8%) | 1mo | $415,000 | $157 | 52 |
| 2026 Point Clear Ct | 0.66mi | 4/2.5 | 2,647 (+9%) | 1mo | $325,000 | $123 | 52 |
| 3602 E Creek Club Dr | 0.70mi | 4/2.5 | 2,694 (+10%) | 4mo | $369,000 | $137 | 44 |
| 4026 Greenbriar Dr | 0.73mi | 3/2.5 (-1) | 2,689 (+10%) | 0mo | $390,000 | $145 | 42 |
Match score weights: distance 35% · size 25% · config 20% · recency 20%. Top-matched comps best support the ARV.
Projected returns pro-forma
-1.67% appreciation · 0.0% rent growth · sell at horizon
- IRR
- -14.2%
- Equity multiple
- 0.44×
- Total profit
- $-42,330
- Equity at exit
- $56,627
- IRR
- -11.1%
- Equity multiple
- 0.21×
- Total profit
- $-59,582
- Equity at exit
- $52,450
Cash invested: $75,600 (down + closing). Projections, not guarantees.
Landlord ↔ Tenant lean methodology
- Overall (STATE)
- 87 Strongly Landlord-Friendly
- State Texas
- 87 Strongly Landlord-Friendly · R+5
- County
- — inherits STATE
- City
- — inherits STATE
ZIP-level market 77459
- Home prices YoY
- -0.8%
- Rents YoY
- -0.1%
- Active inventory
- 1215
- Price-to-rent
- 8.8×
Monthly cashflow live
- Estimated rent
- $2,547 high interval (Pro) →
- Mortgage (P&I)
- −$1,416
- Tax from tax record
- −$550 /mo · $6,598/yr
- Insurance
- −$112
- HOA
- −$39
- Vacancy / Maint / Mgmt
- −$535
- Net cashflow
- $-105
Break-even live
UW: 25.0% down · 7.5% · 30yr · 1.5% tax · 5.0% vac · 8.0% maint · 8.0% mgmt
Financing live
Cash to close
- Down payment
- $67,500
- Closing costs
- $8,100
- Reserves months
- —
- Total cash needed
- —
Loan-product check · same deal, 3 products live
Conventional
25% down · 7.5% · 30yr
- Down + closing
- —
- Monthly P&I
- —
- Monthly cashflow
- —
- DSCR
- —
- Eligible?
- —
Personal DTI + credit; lowest rate.
DSCR
20% down · 8.5% · 30yr
- Down + closing
- —
- Monthly P&I
- —
- Monthly cashflow
- —
- DSCR
- —
- Eligible?
- —
No personal income docs; deal must DSCR.
Hard money
10% down · 12.0% · 12mo
- Down + closing
- —
- Monthly P&I
- —
- Monthly cashflow
- —
- DSCR
- —
- Eligible?
- —
Short-term bridge; refi at stabilization.
Rent comps 14 comps
| Address | Beds | Baths | Sqft | Rent | $/sqft | DOM | Units | Dist |
|---|---|---|---|---|---|---|---|---|
| 3912 Cedar Valley Dr Missouri City, TX | 3.0 | 2.0 | 2151 | $2,200 | $1.02 | 20d | 1 | 0.34mi |
| 3907 Kiamesha Dr Missouri City, TX | 4.0 | 2.5 | 2896 | $2,750 | $0.95 | 17d | 1 | 0.38mi |
| 3618 Quail Meadow Dr Missouri City, TX | 3.0 | 2.0 | 1618 | $1,966 | $1.22 | 43d | 1 | 0.80mi |
| 4039 Mission Valley Dr Missouri City, TX | 4.0 | 2.5 | 2364 | $2,495 | $1.06 | 22d | 1 | 0.89mi |
| 2319 Quail Valley East Dr Missouri City, TX | 5.0 | 3.0 | 2235 | $2,000 | $0.89 | 43d | 1 | 0.99mi |
| 814 Hyacinth Pl Missouri City, TX | 4.0 | 2.5 | 2359 | $2,500 | $1.06 | 43d | 1 | 1.02mi |
| 1714 Mustang Xing Missouri City, TX | 4.0 | 3.5 | 3065 | $2,436 | $0.79 | 43d | 1 | 1.10mi |
| 3512 Talia Wood Ct Missouri City, TX | 4.0 | 3.5 | 2950 | $2,900 | $0.98 | 10d | 1 | 1.13mi |
| 2307 Hilton Head Dr Missouri City, TX | 4.0 | 2.0 | 2606 | $2,239 | $0.86 | 17d | 1 | 1.14mi |
| 2010 Quail Valley East Dr Missouri City, TX | 5.0 | 3.0 | 2651 | $2,695 | $1.02 | 43d | 1 | 1.18mi |
| 3611 Duncaster Dr Missouri City, TX | 3.0 | 2.5 | 1926 | $2,100 | $1.09 | 19d | 1 | 1.34mi |
| 6518 Portuguese Bend Dr Missouri City, TX | 4.0 | 2.5 | 2920 | $6,500 | $2.23 | 43d | 1 | 1.39mi |
| 3327 Shady Glen Ln Missouri City, TX | 4.0 | 2.5 | 2232 | $2,250 | $1.01 | 12d | 1 | 1.39mi |
| 1323 Park Crest Dr Missouri City, TX | 5.0 | 3.0 | 2607 | $2,600 | $1.00 | 43d | 1 | 1.42mi |
HOA detail
- Monthly dues
- $39 · $468/yr
Listing history 19 events
-
2026-06-18days on market $270,000 Active 10 DOM
-
2026-06-17days on market $270,000 Active 9 DOM
-
2026-06-16days on market $270,000 Active 8 DOM
-
2026-06-15days on market $270,000 Active 7 DOM
-
2026-06-13days on market $270,000 Active 5 DOM
-
2026-06-08pricedays on market $270,000 Active 1 DOM
-
2026-04-27$2,200
-
2026-04-04price $290,000 131-char remark
Show marketing remark (131 chars)
Big house with atrium inside the house, open and light. 1/2 bath has shower, and just remodeled and few minor touch up job remain.
-
2026-01-11$300,000 Active 131-char remark
Show marketing remark (131 chars)
Big house with atrium inside the house, open and light. 1/2 bath has shower, and just remodeled and few minor touch up job remain.
-
2013-03-27soldstatus Sold 272-char remark
Show marketing remark (272 chars)
Very clean & well maintained home that is 4 bedrooms/3 full bath and includes two Master Suite's. Kithen, bathrooms, and carpets are used but in liveable shape. The backyard has a screened in porch and recently trimmed trees. This will not last long at this price!!!
-
2013-03-27soldstatus
Show marketing remark (272 chars)
Very clean & well maintained home that is 4 bedrooms/3 full bath and includes two Master Suite's. Kithen, bathrooms, and carpets are used but in liveable shape. The backyard has a screened in porch and recently trimmed trees. This will not last long at this price!!!
-
2013-03-22status Pending 272-char remark
Show marketing remark (272 chars)
Very clean & well maintained home that is 4 bedrooms/3 full bath and includes two Master Suite's. Kithen, bathrooms, and carpets are used but in liveable shape. The backyard has a screened in porch and recently trimmed trees. This will not last long at this price!!!
-
2013-03-11status Option Pending 272-char remark
Show marketing remark (272 chars)
Very clean & well maintained home that is 4 bedrooms/3 full bath and includes two Master Suite's. Kithen, bathrooms, and carpets are used but in liveable shape. The backyard has a screened in porch and recently trimmed trees. This will not last long at this price!!!
-
2013-03-08$129,900 Active 272-char remark
Show marketing remark (272 chars)
Very clean & well maintained home that is 4 bedrooms/3 full bath and includes two Master Suite's. Kithen, bathrooms, and carpets are used but in liveable shape. The backyard has a screened in porch and recently trimmed trees. This will not last long at this price!!!
-
2013-03-06soldstatus
-
2013-03-06soldstatus
-
2013-02-20soldstatus
-
2013-02-20soldstatus
-
2006-06-12soldstatus
ⓘ Source: listings_history table (triggers on properties + properties_extension) + one-shot
backfill from property_details.listing_events for pre-trigger history.
Tax reassessment forecast TX · Resets to sale price
- Current annual tax
- $6,598 · $550/mo
- Projected year-2 tax
- $6,598 · $550/mo
- Expected delta
- $0/yr ($0/mo · 0.0%)
ⓘ Screening estimate from a state-policy table — verify with the county assessor before closing.
Climate risk First Street
- Flood 3/10 Moderate FEMA zone X (unshaded) · 17% chance over 30 yrs
- Wildfire 1/10 Low
- Heat 9/10 Extreme 7 d/yr ≥111°F today · 23 d/yr by 30 yrs out
- Wind 9/10 Extreme 99% chance of damaging wind over 30 yrs
- Air quality 3/10 Moderate 2 unhealthy d/yr today · 3 by 30 yrs out
Nearby sold comps map
Loading sold comps map…
Walkable amenities ~0.75 mi
Loading nearby amenities…
Taxation est. · year 1
- Rental income
- $30,564
- − Mortgage interest
- −$15,124
- − Property taxes
- −$6,598
- − Insurance
- −$1,350
- − Repairs & maintenance
- −$2,445
- − Management
- −$2,445
- − HOA
- −$468
- − Depreciation
- −$7,855
- Taxable loss
- −$5,721
- Est. tax savings @ 24.0%
- +$1,373
- After-tax cash flow
- $112/yr
For passive investors: Depreciation is non-cash, so a rental often shows a tax loss while cash-flowing — sheltering income. Rental losses are passive: they offset passive income freely, and up to $25,000/yr can offset ordinary (W-2) income if you actively participate and your MAGI is under $100k (phasing out to $0 by $150k); unused losses carry forward. On sale, claimed depreciation is recaptured at up to 25%, and gains may owe capital-gains tax (a 1031 exchange can defer both). Figures are a year-1 estimate at your 24.0% rate — not tax advice; consult a CPA.
Schools (NCES district)
- District
- Fort Bend ISD
- NCES district ID
- 4819650
- Math proficiency
- 44% ▼ -15.00%
- Reading proficiency
- 53% ▼ -4.00%
- Median HH income
- $82,360
- Composite
- 44.61/100
- National rank
- #2779
- State rank
- #140 of 826 in TX
Livability — Missouri City
- Score
- 67/100
- State rank
- #526
- US rank
- #10308
Category grades
Schools grade is shown separately in the Schools card above.
Census & demographics
- Census place
- Missouri City, TX
- County
- Fort Bend County · 836,777 people
- City population
- 123,513
- Metro
- Houston-The Woodlands-Sugar Land, TX
- Population (ZIP)
- 84,221
- Household income
- $129,151
- Rent vs Own
- Severe rent burden
- 1004.0
Population outlook (Fort Bend County) Hauer SSP2
- Today (2025)
- 1,004,526 people
- By 2030
- 1,153,104 · +14.8%
- By 2040
- 1,453,718 · +44.7%
- By 2050
- 1,753,781 · +74.6%
- By 2075
- 2,455,772 · +144.5%
- By 2100
- 2,930,528 · +191.7%
Race, ethnicity, and origin ACS 2023
- Neighborhood character
- Highly diverse neighborhood (Simpson 0.75)
- Race & ethnicity
- White 34% Black 26% Asian 22% Hispanic / Latino 13% Two or more races 10%
- Hispanic origin (detail)
- Mexican 7%
- Common ancestry
- Lithuanian 2% Slovak 1% Italian 1%
- Foreign-born
- 21% · Canada, China, Vietnam
- Languages at home
- 73% English-only · Other Asian/Pacific 8% Spanish 7% Other Indo-European 5%
Political lean MEDSL · Fort Bend
- 2024 margin
- Toss-up / Even · D 49.5% · R 47.9% · Other 2.6%
- 2008→2024 swing
- +4.0pp toward D · 2008: -2.4pp · 2024: 1.6pp
- All cycles
- 2024: D+1.6 2020: D+10.6 2016: D+6.6 2012: R+6.8 2008: R+2.4
Not yet ingested
- Civics
- —
Market trends
- HPI YoY
- ▼ -1.67%
- Current HPI
- 212.3573
- Rent YoY
- ▼ -0.15%
- Metro
- Houston-The Woodlands-Sugar Land, TX
- State GDP YoY
- ▲ 3.95%
- F500 in state
- 110
Industry mix (Fortune 500 HQ in TX)
| Industry | F500 HQs | Revenue |
|---|---|---|
| Energy | 16 | $1,198B |
|
||
| Technology | 5 | $198B |
|
||
| Engineering / Construction | 4 | $72B |
|
||
| Energy Services | 3 | $60B |
|
||
| Utilities | 3 | $41B |
|
||
| Healthcare | 2 | $330B |
|
||
Price history
-98.3% since first listed13 events — show timeline
- 2026-04-27 Listed for Rent $2,200 HARMLS
- 2026-04-04 Price Changed $290,000 HARMLS
- 2026-01-11 Listed $300,000 HARMLS
- 2013-03-27 Sold (Public Records) — Public Records
- 2013-03-27 Sold (MLS) — HARMLS
- 2013-03-22 Pending — HARMLS
- 2013-03-11 Pending — HARMLS
- 2013-03-08 Listed $129,900 HARMLS
- 2013-03-06 Sold (Public Records) — Public Records
- 2013-03-06 Sold (Public Records) — Public Records
- 2013-02-20 Sold (Public Records) — Public Records
- 2013-02-20 Sold (Public Records) — Public Records
- 2006-06-12 Sold (Public Records) — Public Records
Property tax history
+3.1%/yrLatest (2025): $6,598 · -9.1% YoY. Source: county tax records.
Cash-flow waterfall
monthlySold comps — $/sqft
last 12 mo · ≤1 miLoading sold comps…