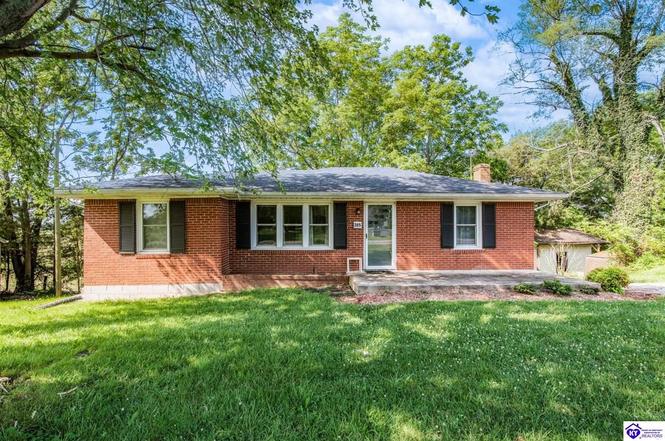
315 Greensburg Rd · Hodgenville, KY
Flood risk 1/10 · Minimal
- FEMA flood zone
- X (unshaded)
- Chance of flooding over 30 yrs
- 0.0%
- Est. flood insurance / yr
- $473 – $860
Fire risk 3/10 · Minor
- Est. fire insurance / yr
- $839 – $1,559
Heat risk 4/10 · Minor
- Hot days now (above 104°F)
- 7 days/yr
- Hot days in 30 yrs
- 20 days/yr
Wind risk 2/10 · Minimal
- Chance of severe wind over 30 yrs
- 3.0%
Air-quality risk 1/10 · Minimal
- Unhealthy air days now
- 0 days/yr
- Unhealthy air days in 30 yrs
- 0 days/yr
Risk factors via First Street. Map © Google.
Why this score? — see what drove the C grade
The composite is a weighted blend of 9 inputs, each scored 0–100. Each bar is that input's sub-score; the figure is the points it added to the 100-point composite (weight × sub-score).
- Cash flow +24.2/30.0
- DSCR +7.8/10.0
- ARV discount +7.5/15.0
- 1% rule +5.0/10.0
- Livability +3.2/5.0
- Schools +2.8/10.0
- Rent growth +2.5/5.0
- Condition / age +2.5/5.0
- Appreciation +0.0/10.0
$169,900
🖨 Deal sheet 📄 Offer letter ✓ Due diligence
Listing remarks
Discover the comfort and convenience of this charming 3-bedroom, 1-bath brick ranch. This well-kept home features an unfinished basement offering plenty of room for storage or future expansion. Outside, you’ll find a handy detached shed and a functional carport providing covered parking. A great opportunity for anyone seeking a solid home with room to personalize—schedule your showing today!
Key facts
- Functional carport
- Unfinished basement
- Detached shed
Tags
Neighborhood map
What this means for you Summary
Snapshot
- This is a 3-bed/1.0-bath other listed at $170k.
Deal economics
- At list price, monthly cash flow is $338 ($4k/yr) — positive.
- The deal already cash-flows at list — no discount required.
- To meet the 1% rule (rent ≥ 1% of price), the offer needs to be $169k (0.4% below list).
- Recommended offer: $169k (0.4% below list) — sets the bar for 1% rule.
- Cap rate 8.7% vs local median 4.1% in Hodgenville — top-decile yield for the area; either an underpriced asset or a hidden risk that comps aren't pricing in. Stress-test before assuming the spread holds.
Location & tenants
- Location reads 65/100 on livability (#259 in KY) — a middle-class / working-renter tenant base. Strengths: cost of living A+, housing A+, health & safety A+; Watch: schools D-, amenities F, commute F.
- Larue County (rural): math 26% / reading 40% proficiency, ranked #82 of 165 in KY (top 50%) — families likely to look elsewhere, expect single-tenant / working-renter base with shorter leases.
- Market conditions: 79 active listings in the ZIP; 65 units permitted in Larue County in 2024 (0 in 5+ unit buildings).
Forward outlook
- Local home prices are declining (-3.0%/yr); year-one equity from $1k of loan paydown is wiped out by about $5k of value loss. Plan a longer hold.
- Larue County population projected to shrink 5% by 2050 — rents likely to lag national; underwrite the cash flow, not the appreciation.
Negotiation context
- Only 2 days on market — expect competitive offers; lowballing is unlikely to land.
- 3 sale attempts since 17y ago; this cycle's ask has dropped $10k (6%) from the opening price — seller is motivated, your offer sets the floor, not the list.
- Current owner paid $42k; list at $170k implies a 305% gain — meaningful room to come down on a strong offer.
Questions for the listing agent
- Built in 1960 — when were the roof, HVAC, electrical panel, plumbing, and water heater last replaced?
- Is there a deadline driving the sale (1031 exchange, divorce, estate, relocation)? That informs how much negotiation room exists.
- Schools are D-rated, which usually means shorter tenancies and higher turnover. Who's the typical renter profile here, and what's been the actual vacancy rate?
- What's the average days-on-market for RENTAL listings here right now (not sales)? A rising rental-DOM trend means longer vacancies and softer asking-rent achievability than the comps imply.
- What's the recent tenant-quality profile in this submarket — average credit score on applications, eviction rate, late-payment / NSF rate, and stable-employment percentage? A property-management company in the area should have these aggregated.
- How much new for-sale + rental construction is in the pipeline within 1–3 miles? Heavy new supply typically softens prices + rents 12–24 months out; constrained supply supports both.
Investment metrics
- 1% rule
- 1.00% ✗
- Cap rate
- 8.68%
- Cash-on-cash
- 8.52%
- DSCR
- 1.38
- GRM
- 8.4
CMA / ARV
No comps found within radius.
Projected returns pro-forma
-3.0% appreciation · 3.0% rent growth · sell at horizon
- IRR
- -3.4%
- Equity multiple
- 0.87×
- Total profit
- $-6,092
- Equity at exit
- $25,333
- IRR
- 6.2%
- Equity multiple
- 1.46×
- Total profit
- $22,073
- Equity at exit
- $14,690
Cash invested: $47,572 (down + closing). Projections, not guarantees.
Landlord ↔ Tenant lean methodology
- Overall (STATE)
- 83 Strongly Landlord-Friendly
- State Kentucky
- 83 Strongly Landlord-Friendly · R+16
- County
- — inherits STATE
- City
- — inherits STATE
ZIP-level market 42748
- Home prices YoY
- -28.9%
- Active inventory
- 79
- Price-to-rent
- 8.4×
Monthly cashflow live
- Estimated rent
- $1,692 medium interval (Pro) →
- Mortgage (P&I)
- −$891
- Tax from tax record
- −$37 /mo · $447/yr
- Insurance
- −$71
- HOA
- −$0
- Vacancy / Maint / Mgmt
- −$355
- Net cashflow
- $338
Break-even live
UW: 25.0% down · 7.5% · 30yr · 1.5% tax · 5.0% vac · 8.0% maint · 8.0% mgmt
Financing live
Cash to close
- Down payment
- $42,475
- Closing costs
- $5,097
- Reserves months
- —
- Total cash needed
- —
Loan-product check · same deal, 3 products live
Conventional
25% down · 7.5% · 30yr
- Down + closing
- —
- Monthly P&I
- —
- Monthly cashflow
- —
- DSCR
- —
- Eligible?
- —
Personal DTI + credit; lowest rate.
DSCR
20% down · 8.5% · 30yr
- Down + closing
- —
- Monthly P&I
- —
- Monthly cashflow
- —
- DSCR
- —
- Eligible?
- —
No personal income docs; deal must DSCR.
Hard money
10% down · 12.0% · 12mo
- Down + closing
- —
- Monthly P&I
- —
- Monthly cashflow
- —
- DSCR
- —
- Eligible?
- —
Short-term bridge; refi at stabilization.
Listing history 13 events
-
2026-06-17status $169,900 Pending 2 DOM
-
2026-06-16days on market $169,900 Active 2 DOM
-
2026-06-15statusdays on market $169,900 Active 1 DOM
-
2026-03-20status Pending
-
2026-03-17status Active
-
2026-03-01status Pending
-
2026-02-25price $169,900
-
2026-02-03price $174,900
-
2025-12-03$179,900 Active
-
2010-03-01soldstatus $42,000
-
2009-12-10historical
-
2009-09-15$76,500
-
2001-09-01soldstatus $25,000
ⓘ Source: listings_history table (triggers on properties + properties_extension) + one-shot
backfill from property_details.listing_events for pre-trigger history.
Tax reassessment forecast KY · Resets to sale price
- Current annual tax
- $447 · $37/mo
- Projected year-2 tax
- $1,461 · $122/mo
- Expected delta
- +$1,014/yr (+$84/mo · 226.6%)
ⓘ Screening estimate from a state-policy table — verify with the county assessor before closing.
Climate risk First Street
- Flood 1/10 Low FEMA zone X (unshaded) · 0% chance over 30 yrs
- Wildfire 3/10 Moderate
- Heat 4/10 Moderate 7 d/yr ≥104°F today · 20 d/yr by 30 yrs out
- Wind 2/10 Low 3% chance of damaging wind over 30 yrs
- Air quality 1/10 Low 0 unhealthy d/yr today · 0 by 30 yrs out
Nearby sold comps map
Loading sold comps map…
Walkable amenities ~0.75 mi
Loading nearby amenities…
Taxation est. · year 1
- Rental income
- $20,308
- − Mortgage interest
- −$9,517
- − Property taxes
- −$447
- − Insurance
- −$850
- − Repairs & maintenance
- −$1,625
- − Management
- −$1,625
- − Depreciation
- −$4,943
- Taxable income
- $1,302
- Est. tax owed @ 24.0%
- −$313
- After-tax cash flow
- $3,742/yr
For passive investors: Depreciation is non-cash, so a rental often shows a tax loss while cash-flowing — sheltering income. Rental losses are passive: they offset passive income freely, and up to $25,000/yr can offset ordinary (W-2) income if you actively participate and your MAGI is under $100k (phasing out to $0 by $150k); unused losses carry forward. On sale, claimed depreciation is recaptured at up to 25%, and gains may owe capital-gains tax (a 1031 exchange can defer both). Figures are a year-1 estimate at your 24.0% rate — not tax advice; consult a CPA.
Schools (NCES district)
- District
- Larue County
- NCES district ID
- 2103180
- Math proficiency
- 26% ▼ -20.00%
- Reading proficiency
- 40% ▼ -19.00%
- Median HH income
- $39,784
- Composite
- 27.66/100
- National rank
- #6918
- State rank
- #82 of 165 in KY
Livability — Hodgenville
- Score
- 65/100
- State rank
- #259
- US rank
- #12858
Category grades
Schools grade is shown separately in the Schools card above.
Census & demographics
- Population (ZIP)
- 9,189
Population outlook (Larue County) Hauer SSP2
- Today (2025)
- 14,441 people
- By 2030
- 14,453 · +0.1%
- By 2040
- 14,258 · -1.3%
- By 2050
- 13,687 · -5.2%
- By 2075
- 12,271 · -15.0%
- By 2100
- 10,639 · -26.3%
Race, ethnicity, and origin ACS 2023
- Neighborhood character
- Predominantly White (92%)
- Race & ethnicity
- White 92% Two or more races 5% Hispanic / Latino 4% Black 1%
- Common ancestry
- Lithuanian 4% Serbian 3% Slovak 1%
- Foreign-born
- 2% · Canada
- Languages at home
- 97% English-only · Spanish 3%
Political lean MEDSL · Larue
- 2024 margin
- Solid R (+60.4) · D 19.1% · R 79.5% · Other 1.3%
- 2008→2024 swing
- -24.1pp toward R · 2008: -36.3pp · 2024: -60.4pp
- All cycles
- 2024: R+60.4 2020: R+57.3 2016: R+55.4 2012: R+37.8 2008: R+36.3
Not yet ingested
- Civics
- —
Market trends
- HPI YoY
- ▼ -98.53%
- Current HPI
- 241.8077
- Rent YoY
- —
- Metro
- —
- State GDP YoY
- ▲ 1.81%
- F500 in state
- 4
Industry mix (Fortune 500 HQ in KY)
| Industry | F500 HQs | Revenue |
|---|---|---|
| Healthcare | 1 | $118B |
|
||
| Food / Beverage | 1 | $7B |
|
||
Price history
+579.6% since first listed10 events — show timeline
- 2026-03-20 Pending — HKARMLS
- 2026-03-17 Relisted — HKARMLS
- 2026-03-01 Pending — HKARMLS
- 2026-02-25 Price Changed $169,900 HKARMLS
- 2026-02-03 Price Changed $174,900 HKARMLS
- 2025-12-03 Listed $179,900 HKARMLS
- 2010-03-01 Sold (Public Records) $42,000 Public Records
- 2009-12-10 Listing Removed — Metro Search MLS
- 2009-09-15 Listed $76,500 Metro Search MLS
- 2001-09-01 Sold (Public Records) $25,000 Public Records
Cash-flow waterfall
monthlySold comps — $/sqft
last 12 mo · ≤1 miLoading sold comps…