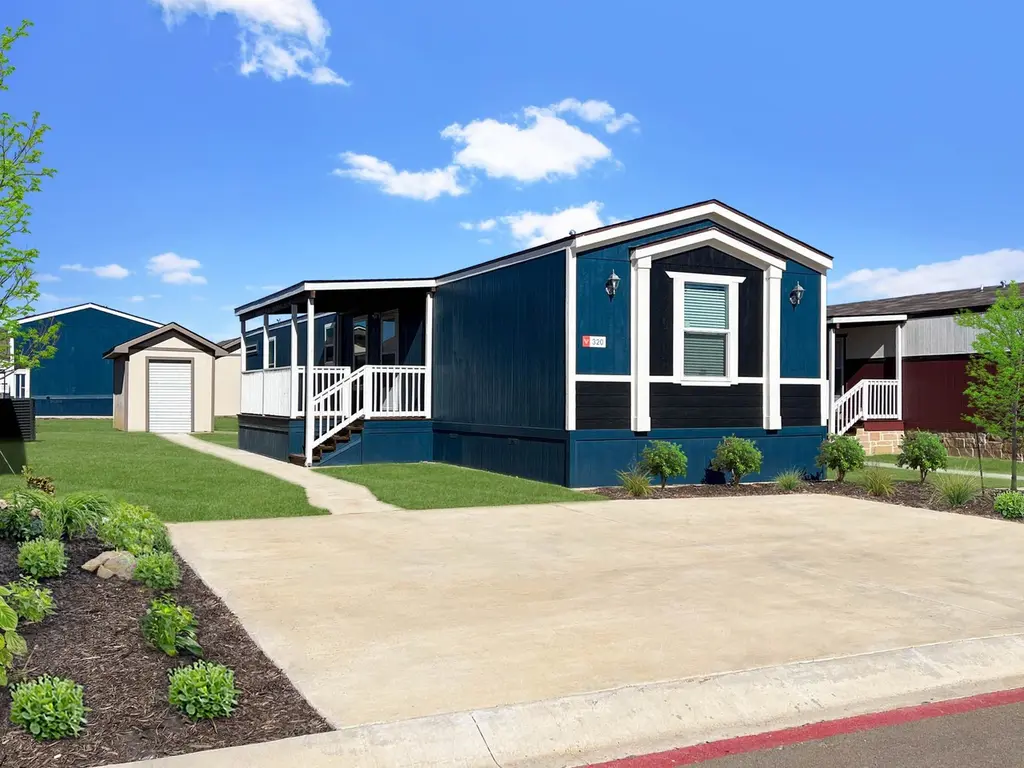
348 Plan · Oak Point, TX
Flood risk 1/10 · Minimal
- FEMA flood zone
- X (unshaded)
- Chance of flooding over 30 yrs
- 0.0%
- Est. flood insurance / yr
- $507 – $1,088
Fire risk 5/10 · Moderate
- Est. fire insurance / yr
- $1,222 – $2,270
Heat risk 7/10 · Major
- Hot days now (above 109°F)
- 7 days/yr
- Hot days in 30 yrs
- 23 days/yr
Wind risk 5/10 · Moderate
- Chance of severe wind over 30 yrs
- 26.0%
Air-quality risk 4/10 · Minor
- Unhealthy air days now
- 4 days/yr
- Unhealthy air days in 30 yrs
- 5 days/yr
Risk factors via First Street. Map © Google.
Why this score? — see what drove the B grade
The composite is a weighted blend of 9 inputs, each scored 0–100. Each bar is that input's sub-score; the figure is the points it added to the 100-point composite (weight × sub-score).
- Cash flow +30.0/30.0
- 1% rule +10.0/10.0
- DSCR +10.0/10.0
- ARV discount +7.5/15.0
- Condition / age +4.8/5.0
- Schools +3.5/10.0
- Livability +3.2/5.0
- Rent growth +2.1/5.0
- Appreciation +0.0/10.0
$105,785
🖨 Deal sheet (PDF) 📄 Offer letter ✓ Due diligence
Listing remarks MLS
Modern Comfort Meets Smart Design - Discover the Model 348 by Oak Creek Homes Welcome home to the Model 348, a beautifully crafted 3-bedroom, 2-bath manufactured home offering 1,178 sq. ft. of thoughtfully designed living space. This home is ideal for families, first-time buyers, or anyone looking to enjoy quality, comfort, and style—at a price that makes sense. Step inside to a bright, open floor plan where the living, dining, and kitchen areas flow seamlessly. The L-shaped kitchen provides generous counter space, plenty of storage, and a natural gathering spot for meals and memories. The spacious primary suite is your private retreat, complete with a dual vanity bathroom and a large soaking tub—perfect for relaxing at the end of the day. Two additional bedrooms offer flexibility for guests, kids, or a home office. Enjoy the convenience of a separate laundry room, energy-efficient construction, and durable finishes designed to last for years to come.
Key facts
- Open floor plan
- Large soaking tub
- L-shaped kitchen
Tags
Neighborhood map
What this means for you Summary
Snapshot
- This is a 3-bed/2.0-bath manufactured listed at $106k. Condition is rated excellent.
Deal economics
- At list price, monthly cash flow is $1k ($12k/yr) — positive.
- The deal already cash-flows at list — no discount required.
- Meets the 1% rule at list price ($2k rent vs $106k).
- Recommended offer: $93k (12.0% below list) — sets the bar for market timing.
- Cap rate 18.0% vs local median 3.4% in Oak Point — top-decile yield for the area; either an underpriced asset or a hidden risk that comps aren't pricing in. Stress-test before assuming the spread holds.
Location & tenants
- Location reads 63/100 on livability (#887 in TX) — a middle-class / working-renter tenant base. Strengths: crime A+, employment A+, housing A+; Watch: cost of living D+, amenities F, commute F.
- Denton ISD (urban): math 36% / reading 43% proficiency, ranked #383 of 826 in TX (top 46%) — families likely to look elsewhere, expect single-tenant / working-renter base with shorter leases.
- Market conditions: Rents soft (-1.5%/yr); 1320 active listings in the ZIP; 14 comparable units currently listed for rent nearby; rentals at typical pace (median 19d on market — plan ~3-4 weeks tenant-placement turnaround); high-income renter base; 10,531 units permitted in Denton County in 2024 (2,713 in 5+ unit buildings).
Forward outlook
- Local home prices are declining (-3.0%/yr); year-one equity from $732 of loan paydown is wiped out by about $3k of value loss. Plan a longer hold.
- Denton County population projected at +66% by 2050 — long-run rental-demand tailwind backs the buy-and-hold thesis.
- At projected returns (-3.0% appreciation + 0.0% rent growth), your $30k cash investment doubles in ~3 years — after that, you're playing with house money.
Negotiation context
- It's been on market 380 days — a 12% lower offer ($93k) is reasonable based on typical stale-listing flexibility.
Risks & watch-outs
- Climate carrying-cost: moderate wind risk, 26% chance of damaging wind over 30y; moderate wildfire risk; extreme-heat days projected 7→23/yr by 2055 (HVAC capex compounding) — expect insurance premiums to compound above CPI over the hold.
Questions for the listing agent
- It's been on market 380 days. Have you received any prior offers? Is the seller open to a 12% concession, seller financing, or rate buy-down credit?
- Why hasn't it sold? Are there any deal-killer items the seller is aware of (foundation, flood, title, zoning, code violations)?
- Is there a deadline driving the sale (1031 exchange, divorce, estate, relocation)? That informs how much negotiation room exists.
- What's the average days-on-market for RENTAL listings here right now (not sales)? A rising rental-DOM trend means longer vacancies and softer asking-rent achievability than the comps imply.
- What's the recent tenant-quality profile in this submarket — average credit score on applications, eviction rate, late-payment / NSF rate, and stable-employment percentage? A property-management company in the area should have these aggregated.
- How much new for-sale + rental construction is in the pipeline within 1–3 miles? Heavy new supply typically softens prices + rents 12–24 months out; constrained supply supports both.
Investment metrics
- 1% rule
- 2.11% ✓
- Cap rate
- 17.97%
- Cash-on-cash
- 41.70%
- DSCR
- 2.86
- GRM
- 4.0
CMA / ARV
No comps found within radius.
Projected returns pro-forma
-3.0% appreciation · 0.0% rent growth · sell at horizon
- IRR
- 34.9%
- Equity multiple
- 2.41×
- Total profit
- $41,911
- Equity at exit
- $15,773
- IRR
- 40.1%
- Equity multiple
- 4.23×
- Total profit
- $95,802
- Equity at exit
- $9,146
Cash invested: $29,620 (down + closing). Projections, not guarantees.
Landlord ↔ Tenant lean methodology
- Overall (STATE)
- 87 Strongly Landlord-Friendly
- State Texas
- 87 Strongly Landlord-Friendly · R+5
- County
- — inherits STATE
- City
- — inherits STATE
ZIP-level market 75068
- Home prices YoY
- -25.5%
- Rents YoY
- -1.5%
- Active inventory
- 1320
- Price-to-rent
- 4.0×
Monthly cashflow live
- Estimated rent
- $2,228 high interval (Pro) →
- Mortgage (P&I)
- −$555
- Tax est. 1.5%
- −$132 /mo · $1,587/yr
- Insurance
- −$44
- HOA
- −$0
- Vacancy / Maint / Mgmt
- −$468
- Net cashflow
- $1,029
Break-even live
Sensitivity live
| Price | -10% $1,102 | -5% $1,066 | +0% $1,029 | +5% $993 | +10% $956 |
|---|---|---|---|---|---|
| Rent | -10% $853 | -5% $941 | +0% $1,029 | +5% $1,117 | +10% $1,205 |
| Rate | -1.0pp $1,082 | -0.5pp $1,056 | base $1,029 | +0.5pp $1,002 | +1.0pp $974 |
UW: 25.0% down · 7.5% · 30yr · 1.5% tax · 5.0% vac · 8.0% maint · 8.0% mgmt
Financing live
Cash to close
- Down payment
- $26,446
- Closing costs
- $3,174
- Reserves months
- —
- Total cash needed
- —
Loan-product check · same deal, 3 products live
Conventional
25% down · 7.5% · 30yr
- Down + closing
- —
- Monthly P&I
- —
- Monthly cashflow
- —
- DSCR
- —
- Eligible?
- —
Personal DTI + credit; lowest rate.
DSCR
20% down · 8.5% · 30yr
- Down + closing
- —
- Monthly P&I
- —
- Monthly cashflow
- —
- DSCR
- —
- Eligible?
- —
No personal income docs; deal must DSCR.
Hard money
10% down · 12.0% · 12mo
- Down + closing
- —
- Monthly P&I
- —
- Monthly cashflow
- —
- DSCR
- —
- Eligible?
- —
Short-term bridge; refi at stabilization.
Rent comps 14 comps
| Address | Beds | Baths | Sqft | Rent | $/sqft | DOM | Units | Dist |
|---|---|---|---|---|---|---|---|---|
| 8924 Whirlwind Trl Aubrey, TX | 3.0 | 2.0 | 1433 | $1,995 | $1.39 | 18d | 1 | 0.19mi |
| 8905 Deadwood Ln Aubrey, TX | 3.0 | 2.0 | 1403 | $2,290 | $1.63 | 16d | 1 | 0.21mi |
| 8821 Tumbleweed Dr Cross Roads, TX | 3.0 | 2.0 | 1378 | $1,950 | $1.42 | 19d | 1 | 0.60mi |
| 832 Cheyenne Dr Aubrey, TX | 3.0 | 2.0 | 1421 | $2,300 | $1.62 | 25d | 1 | 0.62mi |
| 8621 Chisholm Trl Cross Roads, TX | 3.0 | 2.0 | 1374 | $1,795 | $1.31 | 44d | 1 | 0.67mi |
| 8929 Holliday Ln Aubrey, TX | 3.0 | 2.0 | 1201 | $1,895 | $1.58 | 4d | 1 | 0.70mi |
| 9016 Stewart St Cross Roads, TX | 3.0 | 2.0 | 1281 | $1,795 | $1.40 | 8d | 1 | 0.77mi |
| 571 Lloyd's Rd Little Elm, TX | 1.0–4.0 | 1.0–4.0 | 1751 | $2,719 | $1.55 | 0d | 33 | 0.79mi |
| 9005 Stewart St Cross Roads, TX | 3.0 | 2.0 | 1207 | $2,300 | $1.91 | 18d | 1 | 0.80mi |
| 9004 Eastwood Ave Cross Roads, TX | 3.0 | 2.0 | 1207 | $1,750 | $1.45 | 13d | 1 | 0.83mi |
| 8801 Stewart St Cross Roads, TX | 3.0 | 2.0 | 1207 | $1,850 | $1.53 | 19d | 1 | 0.85mi |
| 608 Crazy Horse Dr Aubrey, TX | 3.0 | 2.0 | 1334 | $2,155 | $1.62 | 44d | 1 | 0.90mi |
| 8923 Redford Rd Cross Roads, TX | 3.0 | 2.0 | 1201 | $1,945 | $1.62 | 44d | 1 | 0.97mi |
| 4480 FM 720 Aubrey, TX | 1.0–3.0 | 1.0–2.0 | 1014 | $2,319 | $2.29 | 0d | 24 | 1.28mi |
Listing history 15 events
-
2026-06-21days on market $105,785 Active 380 DOM
-
2026-06-18days on market $105,785 Active 377 DOM
-
2026-06-17days on market $105,785 Active 376 DOM
-
2026-06-16days on market $105,785 Active 375 DOM
-
2026-06-15days on market $105,785 Active 374 DOM
-
2026-06-13days on market $105,785 Active 372 DOM
-
2026-06-09days on market $105,785 Active 368 DOM
-
2026-06-08days on market $105,785 Active 367 DOM
-
2026-06-07days on market $105,785 Active 366 DOM
-
2026-06-04days on market $105,785 Active 363 DOM
-
2026-06-03days on market $105,785 Active 362 DOM
-
2026-06-02days on market $105,785 Active 361 DOM
-
2026-06-01days on market $105,785 Active 360 DOM
-
2026-05-31days on market $105,785 Active 359 DOM
-
2025-06-06$105,785 Active 978-char remark
Show marketing remark (978 chars)
Modern Comfort Meets Smart Design - Discover the Model 348 by Oak Creek Homes Welcome home to the Model 348, a beautifully crafted 3-bedroom, 2-bath manufactured home offering 1,178 sq. ft. of thoughtfully designed living space. This home is ideal for families, first-time buyers, or anyone looking to enjoy quality, comfort, and style—at a price that makes sense. Step inside to a bright, open floor plan where the living, dining, and kitchen areas flow seamlessly. The L-shaped kitchen provides generous counter space, plenty of storage, and a natural gathering spot for meals and memories. The spacious primary suite is your private retreat, complete with a dual vanity bathroom and a large soaking tub—perfect for relaxing at the end of the day. Two additional bedrooms offer flexibility for guests, kids, or a home office. Enjoy the convenience of a separate laundry room, energy-efficient construction, and durable finishes designed to last for years to come.
ⓘ Source: listings_history table (triggers on properties + properties_extension) + one-shot
backfill from property_details.listing_events for pre-trigger history.
Climate risk First Street
- Flood 1/10 Low FEMA zone X (unshaded) · 0% chance over 30 yrs
- Wildfire 5/10 Major
- Heat 7/10 Severe 7 d/yr ≥109°F today · 23 d/yr by 30 yrs out
- Wind 5/10 Major 26% chance of damaging wind over 30 yrs
- Air quality 4/10 Moderate 4 unhealthy d/yr today · 5 by 30 yrs out
Nearby sold comps map
Loading sold comps map…
Walkable amenities ~0.75 mi
Loading nearby amenities…
Taxation est. · year 1
- Rental income
- $26,738
- − Mortgage interest
- −$5,926
- − Property taxes
- −$1,587
- − Insurance
- −$529
- − Repairs & maintenance
- −$2,139
- − Management
- −$2,139
- − Depreciation
- −$3,077
- Taxable income
- $11,341
- Est. tax owed @ 24.0%
- −$2,722
- After-tax cash flow
- $9,628/yr
For passive investors: Depreciation is non-cash, so a rental often shows a tax loss while cash-flowing — sheltering income. Rental losses are passive: they offset passive income freely, and up to $25,000/yr can offset ordinary (W-2) income if you actively participate and your MAGI is under $100k (phasing out to $0 by $150k); unused losses carry forward. On sale, claimed depreciation is recaptured at up to 25%, and gains may owe capital-gains tax (a 1031 exchange can defer both). Figures are a year-1 estimate at your 24.0% rate — not tax advice; consult a CPA.
Condition & rehab AI · 12 photos
This modern manufactured home is in excellent condition with a fresh paint job and well-maintained landscaping. It is move-in ready and would be an attractive option for both buyers and renters.
Value-add opportunities
- Resale Painting the interior walls — Fresh paint can enhance the home's curb appeal and make it more inviting
- Rental Landscaping the front yard — A well-maintained front yard can attract more renters and increase rental value
Renovation cost estimate screening
Value-add ROI direction
- Resale Painting the interior walls — Fresh paint can enhance the home's curb appeal and make it more inviting ↑
- Rental Landscaping the front yard — A well-maintained front yard can attract more renters and increase rental value ↑
ⓘ Cost ranges are severity-bucket heuristics (US national rule-of-thumb). Get contractor quotes + a written scope before underwriting a rehab budget.
Schools (NCES district)
- District
- Denton ISD
- NCES district ID
- 4816740
- Math proficiency
- 36% ▼ -18.00%
- Reading proficiency
- 43% ▼ -9.00%
- Median HH income
- $58,913
- Composite
- 34.91/100
- National rank
- #5075
- State rank
- #383 of 826 in TX
Livability — Oak Point
- Score
- 63/100
- State rank
- #887
- US rank
- #15941
Category grades
Schools grade is shown separately in the Schools card above.
Census & demographics
- County
- Denton County · 901,654 people
- Metro
- Dallas-Fort Worth-Arlington, TX
- Population (ZIP)
- 72,710
- Household income
- $126,635
- Rent vs Own
- Severe rent burden
- 829.0
Population outlook (Denton County) Hauer SSP2
- Today (2025)
- 1,053,010 people
- By 2030
- 1,192,269 · +13.2%
- By 2040
- 1,472,920 · +39.9%
- By 2050
- 1,746,506 · +65.9%
- By 2075
- 2,358,497 · +124.0%
- By 2100
- 2,779,183 · +163.9%
Race, ethnicity, and origin ACS 2023
- Neighborhood character
- Highly diverse neighborhood (Simpson 0.74)
- Race & ethnicity
- White 40% Hispanic / Latino 23% Black 19% Two or more races 15% Asian 12% Native American 1%
- Hispanic origin (detail)
- Mexican 17%
- Common ancestry
- Lithuanian 2% Italian 2% Slovak 1%
- Foreign-born
- 19% · Canada, South Korea, China
- Languages at home
- 71% English-only · Spanish 15% Other Asian/Pacific 5% Other Indo-European 4%
Political lean MEDSL · Denton
- 2024 margin
- R (+13.2) · D 42.7% · R 55.8% · Other 1.5%
- 2008→2024 swing
- +11.0pp toward D · 2008: -24.2pp · 2024: -13.2pp
- All cycles
- 2024: R+13.2 2020: R+8.1 2016: R+20.2 2012: R+31.7 2008: R+24.2
Not yet ingested
- Civics
- —
Market trends
- HPI YoY
- ▼ -85.41%
- Current HPI
- 249.755
- Rent YoY
- ▼ -1.50%
- Metro
- Dallas-Fort Worth-Arlington, TX
- State GDP YoY
- ▲ 3.95%
- F500 in state
- 110
Industry mix (Fortune 500 HQ in TX)
| Industry | F500 HQs | Revenue |
|---|---|---|
| Energy | 16 | $1,198B |
|
||
| Technology | 5 | $198B |
|
||
| Engineering / Construction | 4 | $72B |
|
||
| Energy Services | 3 | $60B |
|
||
| Utilities | 3 | $41B |
|
||
| Healthcare | 2 | $330B |
|
||
Price history
1 event — show timeline
- 2025-06-06 Listed $105,785 Zillow
Cash-flow waterfall
monthlySold comps — $/sqft
last 12 mo · ≤1 miLoading sold comps…