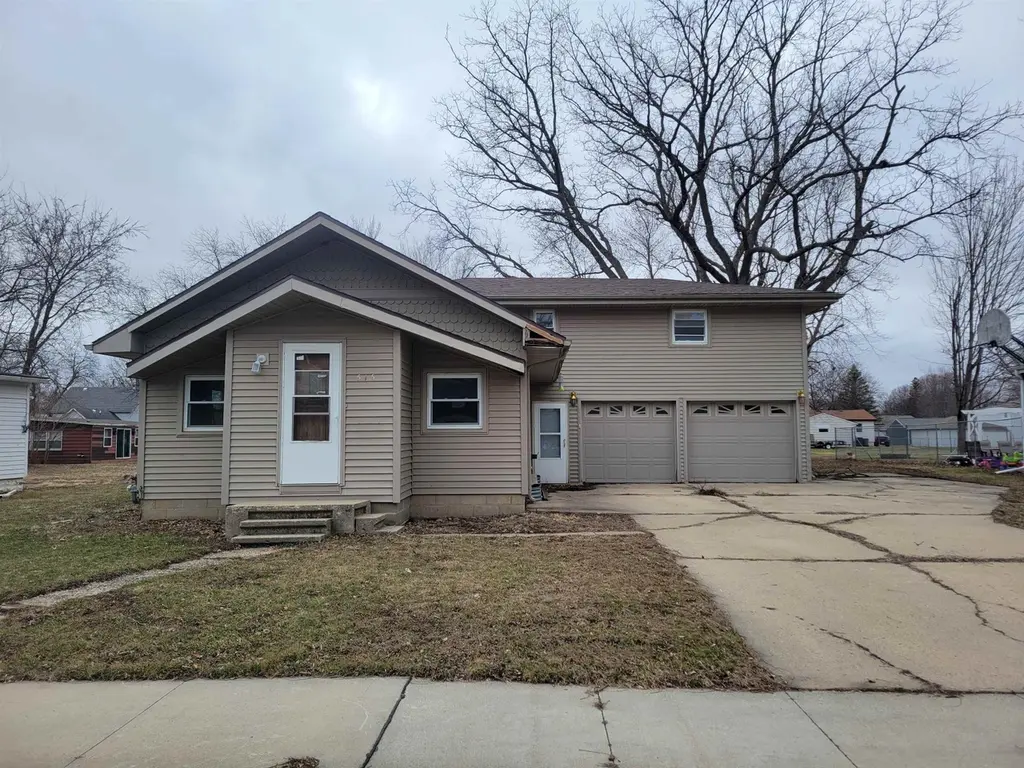
515 6th Ave W · Spencer, IA
Flood risk 1/10 · Minimal
- FEMA flood zone
- X (unshaded)
- Chance of flooding over 30 yrs
- 0.0%
- Est. flood insurance / yr
- $473 – $860
Fire risk 4/10 · Minor
- Est. fire insurance / yr
- $902 – $1,676
Heat risk 2/10 · Minimal
- Hot days now (above 99°F)
- 7 days/yr
- Hot days in 30 yrs
- 16 days/yr
Wind risk 2/10 · Minimal
- Chance of severe wind over 30 yrs
- —
Air-quality risk 1/10 · Minimal
- Unhealthy air days now
- 0 days/yr
- Unhealthy air days in 30 yrs
- 0 days/yr
Risk factors via First Street. Map © Google.
Why this score? — see what drove the B+ grade
The composite is a weighted blend of 9 inputs, each scored 0–100. Each bar is that input's sub-score; the figure is the points it added to the 100-point composite (weight × sub-score).
- Cash flow +29.8/30.0
- ARV discount +15.0/15.0
- DSCR +10.0/10.0
- 1% rule +8.9/10.0
- Schools +6.1/10.0
- Livability +3.9/5.0
- Rent growth +2.5/5.0
- Condition / age +2.5/5.0
- Appreciation +0.0/10.0
$110,000
🖨 Deal sheet (PDF) 📄 Offer letter ✓ Due diligence
Listing remarks MLS
Great opportunity in a solid neighborhood! This home offers strong potential with several key updates already in place, including newer vinyl replacement windows & a roof in good condition. Inside, you’ll find original hardwood floors in the living room & a mix of spaces—some needing full renovation, including both bathrooms, while others just require cosmetic updates like paint, flooring & light fixtures. Main floor laundry adds convenience. The property also features a 2-car tuck-under attached garage, a large backyard with a concrete patio & a small storage shed. Bring your ideas & build equity with this fixer-upper full of potential! Being sold AS-IS.
Key facts
- Large backyard
- Main floor laundry
- Concrete patio
Tags
Neighborhood map
What this means for you Summary
Snapshot
- This is a 3-bed/1.5-bath single-family listed at $110k.
Deal economics
- At list price, monthly cash flow is $403 ($5k/yr) — positive.
- The deal already cash-flows at list — no discount required.
- Meets the 1% rule at list price ($2k rent vs $110k).
- Recommended offer: $103k (6.0% below list) — sets the bar for market timing.
- Cap rate 10.7% vs local median 4.8% in Spencer — top-decile yield for the area; either an underpriced asset or a hidden risk that comps aren't pricing in. Stress-test before assuming the spread holds.
Location & tenants
- Location reads 77/100 on livability (#168 in IA, #3,020 nationally) — a middle-class / working-renter tenant base. Strengths: schools A+, crime A+, cost of living A+; Watch: employment D, amenities F, commute F.
- Spencer Community School District (town): math 73% / reading 72% proficiency, ranked #114 of 289 in IA (top 39%) — strong family-tenant draw, lease renewals of 3-5y typical.
- Market conditions: 108 active listings in the ZIP; 2 comparable units currently listed for rent nearby; 11 units permitted in Clay County in 2024 (0 in 5+ unit buildings).
Forward outlook
- Local home prices are declining (-3.0%/yr); year-one equity from $761 of loan paydown is wiped out by about $3k of value loss. Plan a longer hold.
- Clay County population projected to shrink 6% by 2050 — rents likely to lag national; underwrite the cash flow, not the appreciation.
- At projected returns (-3.0% appreciation + 3.0% rent growth), your $31k cash investment doubles in ~8 years — after that, you're playing with house money.
Negotiation context
- It's been on market 90 days — a 6% lower offer ($103k) is reasonable based on typical stale-listing flexibility.
- 2 sale attempts since 9y ago with the ask held roughly flat each time — persistent listings suggest the price (not the market) is what's stuck; bring a comps-based counter.
- Current owner paid $50k; list at $110k implies a 120% gain — meaningful room to come down on a strong offer.
Risks & watch-outs
- Watch-outs: built in 1920 — expect roof / HVAC / electrical / plumbing capex.
Questions for the listing agent
- It's been on market 90 days. Have you received any prior offers? Is the seller open to a 6% concession, seller financing, or rate buy-down credit?
- Built in 1920 — when were the roof, HVAC, electrical panel, plumbing, and water heater last replaced?
- Why hasn't it sold? Are there any deal-killer items the seller is aware of (foundation, flood, title, zoning, code violations)?
- Is there a deadline driving the sale (1031 exchange, divorce, estate, relocation)? That informs how much negotiation room exists.
- Schools are A-rated — typically a magnet for longer-tenancy family renters. What's the average tenant stay here, and is there a school-zone premium baked into asking?
- What's the average days-on-market for RENTAL listings here right now (not sales)? A rising rental-DOM trend means longer vacancies and softer asking-rent achievability than the comps imply.
- What's the recent tenant-quality profile in this submarket — average credit score on applications, eviction rate, late-payment / NSF rate, and stable-employment percentage? A property-management company in the area should have these aggregated.
- How much new for-sale + rental construction is in the pipeline within 1–3 miles? Heavy new supply typically softens prices + rents 12–24 months out; constrained supply supports both.
Investment metrics
- 1% rule
- 1.39% ✓
- Cap rate
- 10.69%
- Cash-on-cash
- 15.70%
- DSCR
- 1.70
- GRM
- 6.0
CMA / ARV
- ARV (median comp)
- $184,674
- List price
- $110,000
- Delta
- -40.44%
- Verdict
- UNDERPRICED
- Comps
- 20 within 1.0 mi
Show comp detail 12 sales within ~0.75 mi
| Address | Dist | Beds/Ba | Sqft | Sold | Price | $/sf | Match |
|---|---|---|---|---|---|---|---|
| 411 4th Ave W | 0.20mi | 3/2.0 | 1,781 (+3%) | 9mo | $150,000 | $84 | 76 |
| 612 W 4th St | 0.15mi | 3/1.5 | 1,864 (+8%) | 6mo | $143,000 | $77 | 75 |
| 701 W 4th St | 0.14mi | 4/1.0 (+1) | 1,624 (-6%) | 3mo | $200,000 | $123 | 73 |
| 817 Fisher Ct | 0.18mi | 4/2.0 (+1) | 1,802 (+4%) | 6mo | $162,500 | $90 | 73 |
| 917 W 9th St | 0.34mi | 3/2.0 | 1,775 (+2%) | 9mo | $245,000 | $138 | 70 |
| 1312 4th Ave W | 0.56mi | 3/2.0 | 1,672 (-4%) | 5mo | $185,000 | $111 | 62 |
| 512 West Ln | 0.54mi | 3/2.0 | 1,763 (+2%) | 16mo | $126,000 | $71 | 56 |
| 803 6th Ave W | 0.16mi | 3/1.0 | 1,488 (-14%) | 16mo | $79,000 | $53 | 54 |
| 814 W 10th St | 0.32mi | 4/2.5 (+1) | 1,872 (+8%) | 16mo | $280,000 | $150 | 49 |
| 9 E 2nd St | 0.56mi | 2/1.0 (-1) | 1,860 (+7%) | 12mo | $100,000 | $54 | 45 |
| 720 3rd Ave E | 0.69mi | 3/2.0 | 1,566 (-10%) | 9mo | $160,000 | $102 | 42 |
| 105 W 1st St | 0.50mi | 3/2.0 | 1,484 (-14%) | 13mo | $164,000 | $111 | 40 |
Match score weights: distance 35% · size 25% · config 20% · recency 20%. Top-matched comps best support the ARV.
Projected returns pro-forma
-3.0% appreciation · 3.0% rent growth · sell at horizon
- IRR
- 6.6%
- Equity multiple
- 1.26×
- Total profit
- $7,890
- Equity at exit
- $16,401
- IRR
- 16.0%
- Equity multiple
- 2.30×
- Total profit
- $40,121
- Equity at exit
- $9,511
Cash invested: $30,800 (down + closing). Projections, not guarantees.
Landlord ↔ Tenant lean methodology
- Overall (STATE)
- 83 Strongly Landlord-Friendly
- State Iowa
- 83 Strongly Landlord-Friendly · R+6
- County
- — inherits STATE
- City
- — inherits STATE
ZIP-level market 51301
- Home prices YoY
- -35.0%
- Active inventory
- 108
- Price-to-rent
- 6.0×
Monthly cashflow live
- Estimated rent
- $1,528 medium interval (Pro) →
- Mortgage (P&I)
- −$577
- Tax from tax record
- −$182 /mo · $2,182/yr
- Insurance
- −$46
- HOA
- −$0
- Vacancy / Maint / Mgmt
- −$321
- Net cashflow
- $403
Break-even live
Sensitivity live
| Price | -10% $465 | -5% $434 | +0% $403 | +5% $372 | +10% $341 |
|---|---|---|---|---|---|
| Rent | -10% $282 | -5% $343 | +0% $403 | +5% $463 | +10% $524 |
| Rate | -1.0pp $458 | -0.5pp $431 | base $403 | +0.5pp $374 | +1.0pp $345 |
UW: 25.0% down · 7.5% · 30yr · 1.5% tax · 5.0% vac · 8.0% maint · 8.0% mgmt
Financing live
Cash to close
- Down payment
- $27,500
- Closing costs
- $3,300
- Reserves months
- —
- Total cash needed
- —
Loan-product check · same deal, 3 products live
Conventional
25% down · 7.5% · 30yr
- Down + closing
- —
- Monthly P&I
- —
- Monthly cashflow
- —
- DSCR
- —
- Eligible?
- —
Personal DTI + credit; lowest rate.
DSCR
20% down · 8.5% · 30yr
- Down + closing
- —
- Monthly P&I
- —
- Monthly cashflow
- —
- DSCR
- —
- Eligible?
- —
No personal income docs; deal must DSCR.
Hard money
10% down · 12.0% · 12mo
- Down + closing
- —
- Monthly P&I
- —
- Monthly cashflow
- —
- DSCR
- —
- Eligible?
- —
Short-term bridge; refi at stabilization.
Rent comps 2 comps
| Address | Beds | Baths | Sqft | Rent | $/sqft | DOM | Units | Dist |
|---|---|---|---|---|---|---|---|---|
| 801 9th St SW Unit 910-C5 Spencer, IA | 4.0 | 2.5 | 1193 | $1,599 | $1.34 | 45d | 1 | 0.89mi |
| 801 9th St SW Unit 814-D6 Spencer, IA | 3.0 | 2.0 | 1230 | $1,460 | $1.19 | 45d | 1 | 0.89mi |
Listing history 21 events
-
2026-06-21days on market $110,000 Active 90 DOM
-
2026-06-21days on market $110,000 Active 89 DOM
-
2026-06-18days on market $110,000 Active 87 DOM
-
2026-06-17days on market $110,000 Active 86 DOM
-
2026-06-16days on market $110,000 Active 85 DOM
-
2026-06-15days on market $110,000 Active 84 DOM
-
2026-06-13days on market $110,000 Active 82 DOM
-
2026-06-12days on market $110,000 Active 81 DOM
-
2026-06-09days on market $110,000 Active 78 DOM
-
2026-06-08days on market $110,000 Active 77 DOM
-
2026-06-07days on market $110,000 Active 76 DOM
-
2026-06-04days on market $110,000 Active 72 DOM
-
2026-06-02days on market $110,000 Active 71 DOM
-
2026-06-01days on market $110,000 Active 70 DOM
-
2026-05-31days on market $110,000 Active 69 DOM
-
2026-05-31days on market $110,000 Active 68 DOM
-
2026-03-23$110,000 Active 707-char remark
Show marketing remark (707 chars)
Great opportunity in a solid neighborhood! This home offers strong potential with several key updates already in place, including newer vinyl replacement windows & a roof in good condition. Inside, you’ll find original hardwood floors in the living room & a mix of spaces—some needing full renovation, including both bathrooms, while others just require cosmetic updates like paint, flooring & light fixtures. Main floor laundry adds convenience. The property also features a 2-car tuck-under attached garage, a large backyard with a concrete patio & a small storage shed. Bring your ideas & build equity with this fixer-upper full of potential! Being sold AS-IS.
-
2024-03-07soldstatus $50,000
-
2018-03-19soldstatus $112,500
-
2018-03-06soldstatus $102,500 560-char remark
Show marketing remark (560 chars)
So much to offer is this house with lots of room. Relax and enjoy in this spacious home. Kitchen has oak cabinets and is combined with the dining room. Spacious living room and main floor bath with jet tub. Large Master bedroom has room to fit a king bed and dressers. Breaker box and 2 furnaces: one heats the main floor which is gas and an electric furnace in the upper level which heats the bedrooms. Fenced in yard with 2 storage sheds and a attached 2 car garage which is insulated and it all situated on a huge lot. Call Today for Your private showing!!!
-
2017-12-31$112,500 560-char remark
Show marketing remark (560 chars)
So much to offer is this house with lots of room. Relax and enjoy in this spacious home. Kitchen has oak cabinets and is combined with the dining room. Spacious living room and main floor bath with jet tub. Large Master bedroom has room to fit a king bed and dressers. Breaker box and 2 furnaces: one heats the main floor which is gas and an electric furnace in the upper level which heats the bedrooms. Fenced in yard with 2 storage sheds and a attached 2 car garage which is insulated and it all situated on a huge lot. Call Today for Your private showing!!!
ⓘ Source: listings_history table (triggers on properties + properties_extension) + one-shot
backfill from property_details.listing_events for pre-trigger history.
Tax reassessment forecast IA · Partial reset (capped growth)
- Current annual tax
- $2,182 · $182/mo
- Projected year-2 tax
- $2,182 · $182/mo
- Expected delta
- $0/yr ($0/mo · 0.0%)
ⓘ Screening estimate from a state-policy table — verify with the county assessor before closing.
Climate risk First Street
- Flood 1/10 Low FEMA zone X (unshaded) · 0% chance over 30 yrs
- Wildfire 4/10 Moderate
- Heat 2/10 Low 7 d/yr ≥99°F today · 16 d/yr by 30 yrs out
- Wind 2/10 Low
- Air quality 1/10 Low 0 unhealthy d/yr today · 0 by 30 yrs out
Nearby sold comps map
Loading sold comps map…
Walkable amenities ~0.75 mi
Loading nearby amenities…
Taxation est. · year 1
- Rental income
- $18,341
- − Mortgage interest
- −$6,162
- − Property taxes
- −$2,182
- − Insurance
- −$550
- − Repairs & maintenance
- −$1,467
- − Management
- −$1,467
- − Depreciation
- −$3,200
- Taxable income
- $3,313
- Est. tax owed @ 24.0%
- −$795
- After-tax cash flow
- $4,040/yr
For passive investors: Depreciation is non-cash, so a rental often shows a tax loss while cash-flowing — sheltering income. Rental losses are passive: they offset passive income freely, and up to $25,000/yr can offset ordinary (W-2) income if you actively participate and your MAGI is under $100k (phasing out to $0 by $150k); unused losses carry forward. On sale, claimed depreciation is recaptured at up to 25%, and gains may owe capital-gains tax (a 1031 exchange can defer both). Figures are a year-1 estimate at your 24.0% rate — not tax advice; consult a CPA.
Schools (NCES district)
- District
- Spencer Community School District
- NCES district ID
- 1926910
- Math proficiency
- 73% ▼ -7.00%
- Reading proficiency
- 72% ▼ -6.00%
- Median HH income
- $45,474
- Composite
- 61.02/100
- National rank
- #797
- State rank
- #114 of 289 in IA
Livability — Spencer
- Score
- 77/100
- State rank
- #168
- US rank
- #3020
Category grades
Schools grade is shown separately in the Schools card above.
Census & demographics
- Census place
- Spencer, IA
- City population
- 12,402
- Population (ZIP)
- 12,402
Population outlook (Clay County) Hauer SSP2
- Today (2025)
- 16,277 people
- By 2030
- 16,073 · -1.3%
- By 2040
- 15,638 · -3.9%
- By 2050
- 15,315 · -5.9%
- By 2075
- 15,026 · -7.7%
- By 2100
- 14,638 · -10.1%
Race, ethnicity, and origin ACS 2023
- Neighborhood character
- Predominantly White (91%)
- Race & ethnicity
- White 91% Hispanic / Latino 5% Two or more races 4%
- Hispanic origin (detail)
- Mexican 4%
- Common ancestry
- Portuguese 14% Iranian 4% Lithuanian 2%
- Foreign-born
- 1% · Canada, South Korea
- Languages at home
- 98% English-only · Spanish 1%
Political lean MEDSL · Clay
- 2024 margin
- Solid R (+43.2) · D 27.8% · R 71.0% · Other 1.2%
- 2008→2024 swing
- -38.1pp toward R · 2008: -5.1pp · 2024: -43.2pp
- All cycles
- 2024: R+43.2 2020: R+38.7 2016: R+42.4 2012: R+18.7 2008: R+5.1
Not yet ingested
- Civics
- —
Market trends
- HPI YoY
- ▼ -103.43%
- Current HPI
- 192.1741
- Rent YoY
- —
- Metro
- —
- State GDP YoY
- ▲ 2.48%
- F500 in state
- 4
Industry mix (Fortune 500 HQ in IA)
| Industry | F500 HQs | Revenue |
|---|---|---|
| Financial Services | 1 | $16B |
|
||
| Retail / Convenience | 1 | $15B |
|
||
Price history
-2.2% since first listed5 events — show timeline
- 2026-03-23 Listed $110,000 Iowa Great Lakes BOR
- 2024-03-07 Sold (Public Records) $50,000 Public Records
- 2018-03-19 Sold (Public Records) $112,500 Public Records
- 2018-03-06 Sold (MLS) $102,500 Iowa Great Lakes BOR
- 2017-12-31 Listed $112,500 Iowa Great Lakes BOR
Property tax history
+5.0%/yrLatest (2025): $2,182 · +3.3% YoY. Source: county tax records.
Cash-flow waterfall
monthlySold comps — $/sqft
last 12 mo · ≤1 miLoading sold comps…