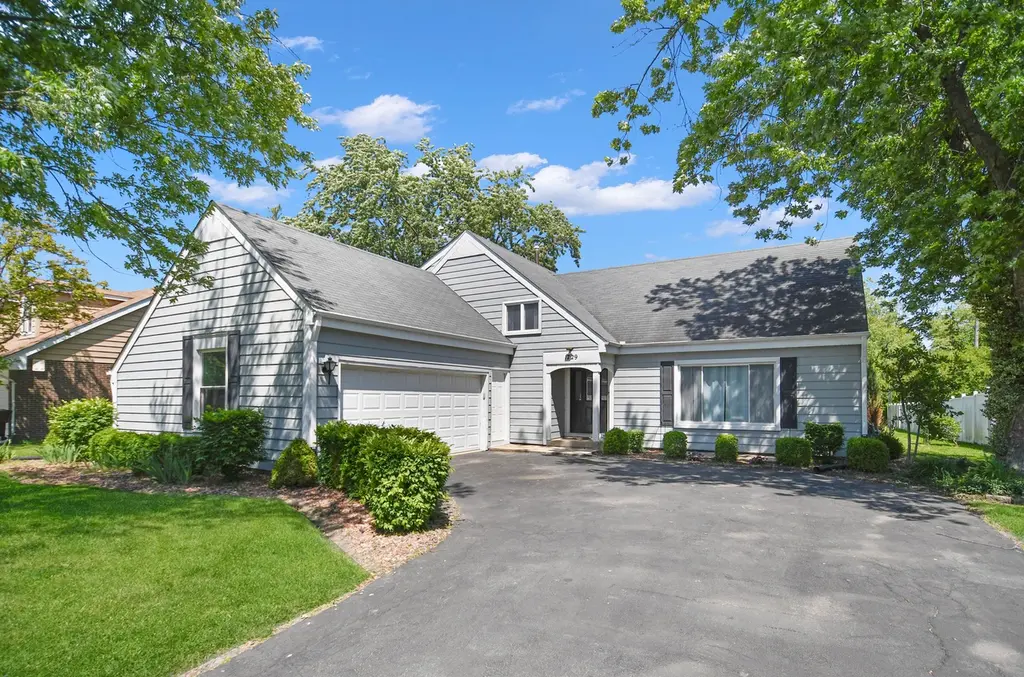
1729 Tina Ln · Flossmoor, IL
Flood risk 1/10 · Minimal
- FEMA flood zone
- X (unshaded)
- Chance of flooding over 30 yrs
- 0.0%
- Est. flood insurance / yr
- $507 – $1,088
Fire risk 1/10 · Minimal
- Est. fire insurance / yr
- $804 – $1,492
Heat risk 3/10 · Minor
- Hot days now (above 101°F)
- 7 days/yr
- Hot days in 30 yrs
- 16 days/yr
Wind risk 2/10 · Minimal
- Chance of severe wind over 30 yrs
- —
Air-quality risk 2/10 · Minimal
- Unhealthy air days now
- 1 days/yr
- Unhealthy air days in 30 yrs
- 1 days/yr
Risk factors via First Street. Map © Google.
Why this score? — see what drove the F grade
The composite is a weighted blend of 9 inputs, each scored 0–100. Each bar is that input's sub-score; the figure is the points it added to the 100-point composite (weight × sub-score).
- Cash flow +7.7/30.0
- Livability +4.0/5.0
- 1% rule +3.4/10.0
- Rent growth +2.5/5.0
- Condition / age +2.5/5.0
- Schools +2.4/10.0
- DSCR +1.8/10.0
- ARV discount +0.0/15.0
- Appreciation +0.0/10.0
$324,873
🖨 Deal sheet 📄 Offer letter ✓ Due diligence
Listing remarks MLS
Totally updated 4 bedroom home. Updates include new windows, new carpet, new paint, ceramic tile, hardwood floors, cherry cabinets, all stainless appliances stay. Huge 75 x 200 lot on a beautiful tree lined street. New front load washer and dryer stay!!!!!
Key facts
- Hardwood flooring
- Neutral interior
- Remodeled kitchen
Tags
Property features AI
Finance
- Other: Parcel number available; Property not currently leased
- HOA & community: No master association fees required; Community features include curbs, sidewalks, street lights and paved streets; Subdivision: Pinehurst
Exterior
- Parking: Attached garage with 2 garage spaces; Asphalt driveway; Garage with door opener
- Security: CO detectors
- Utilities: Water source: Lake Michigan; Public sewer; Electric service with circuit breakers; Gas for heating and water heater; Sump pump with backup
- Home design: Detached single-family home; Tri-level / split-level design; Fee simple ownership; Built before 1978
- Construction: Aluminum siding; Asphalt roof; Concrete perimeter foundation; Estimated living area; Age: approximately 51–60 years
- Exterior features: Deck; Landscaped lot; School bus service
Interior
- Kitchen: Eating-area kitchen (14 x 11); Range; Dishwasher; Refrigerator; Disposal
- Bedrooms: 4 bedrooms total; Master bedroom on second level (14 x 13); Bedroom 2 on second level (12 x 10); Bedroom 3 on second level (12 x 10); Bedroom 4 on third level (19 x 12); Walk-in closet on second level (8 x 5)
- Flooring: Hardwood flooring in some areas; Carpet in bedrooms and lower-level family room; Ceramic tile in foyer and kitchen; Vinyl in laundry room
- Bathrooms: 1 full bathroom; 1 half bathroom; Double sink vanity; Basement bathroom present
- Heating & cooling: Natural gas heating with forced air; Central air conditioning; CO detectors; Ceiling fans
- Interior features: Built-in features; Walk-in closets; Screens on windows; Finished partial basement with crawl space; Unfinished attic; L-shaped dining area; Some photos virtually staged
- Laundry & utility: Laundry room on lower level (11 x 11); In-unit laundry with gas dryer hookup; Laundry sink; Washer; Dryer; Gas water heater
Neighborhood map
What this means for you Summary
Snapshot
- This is a 3-bed/1.5-bath single-family listed at $325k.
Deal economics
- At list price, monthly cash flow is $-379 ($-5k/yr) — negative.
- To cash-flow at today's rent, offer at most $258k (20.6% below list).
- To meet the 1% rule (rent ≥ 1% of price), the offer needs to be $273k (15.9% below list).
- Recommended offer: $258k (20.6% below list) — sets the bar for cash-flow.
Location & tenants
- Location reads 80/100 on livability (#107 in IL, #1,718 nationally) — a professional / high-income tenant draw. Strengths: employment A+, housing A+, crime B+; Watch: cost of living D, amenities F.
- Homewood Flossmoor Chsd 233 (suburban): math 21% / reading 27% proficiency, ranked #272 of 620 in IL (top 44%) — low school quality limits family demand, transient renter base, plan for 1-2y turnover.
- Zoned schools: Homewood-Flossmoor High School (math 21% / reading 27%, grade F, #304 of 693 statewide, top 44%, 2,798 students, 0% FRL).
- Market conditions: 94 active listings in the ZIP; 2 comparable units currently listed for rent nearby; 6,272 units permitted in Cook County in 2024 (4,658 in 5+ unit buildings).
Forward outlook
- Local home prices are declining (-3.0%/yr); year-one equity from $2k of loan paydown is wiped out by about $10k of value loss. Plan a longer hold.
Negotiation context
- Only 3 days on market — expect competitive offers; lowballing is unlikely to land.
- 10 sale attempts since 20y ago with the ask held roughly flat each time — persistent listings suggest the price (not the market) is what's stuck; bring a comps-based counter.
- Current owner paid $169k; list at $325k implies a 92% gain — meaningful room to come down on a strong offer.
Risks & watch-outs
- Watch-outs: property tax is 2.6% of price.
Questions for the listing agent
- What do current leases actually rent for vs. the listed asking? Can we see a recent rent roll and the last 12 months of T-12 income?
- Built in 1974 — when were the roof, HVAC, electrical panel, plumbing, and water heater last replaced?
- Property tax is high relative to price — has the assessment been appealed recently, and will the sale trigger a re-assessment?
- Is there a deadline driving the sale (1031 exchange, divorce, estate, relocation)? That informs how much negotiation room exists.
- Schools are B-rated — typically a magnet for longer-tenancy family renters. What's the average tenant stay here, and is there a school-zone premium baked into asking?
- The area grade is low — what's the realistic commute time and amenity access for the typical tenant pool here? Any planned neighborhood developments (good or bad) we should know about?
- What's the average days-on-market for RENTAL listings here right now (not sales)? A rising rental-DOM trend means longer vacancies and softer asking-rent achievability than the comps imply.
- What's the recent tenant-quality profile in this submarket — average credit score on applications, eviction rate, late-payment / NSF rate, and stable-employment percentage? A property-management company in the area should have these aggregated.
- How much new for-sale + rental construction is in the pipeline within 1–3 miles? Heavy new supply typically softens prices + rents 12–24 months out; constrained supply supports both.
Investment metrics
- 1% rule
- 0.84% ✗
- Cap rate
- 4.89%
- Cash-on-cash
- -4.99%
- DSCR
- 0.78
- GRM
- 9.9
CMA / ARV
- ARV (on-the-fly)
- $228,960
- Comps found
- 12
Show comp detail 12 sales within ~0.75 mi
| Address | Dist | Beds/Ba | Sqft | Sold | Price | $/sf | Match |
|---|---|---|---|---|---|---|---|
| 159 Pleasant Dr | 0.39mi | 3/2.0 | 1,653 (+4%) | 0mo | $225,000 | $136 | 73 |
| 220 W Raye Dr | 0.36mi | 4/2.0 (+1) | 1,600 (+1%) | 4mo | $175,000 | $109 | 72 |
| 182 Frederick Dr | 0.39mi | 4/1.5 (+1) | 1,539 (-3%) | 2mo | $99,900 | $65 | 70 |
| 373 W Glengate Ave | 0.46mi | 3/2.0 | 1,533 (-4%) | 1mo | $290,000 | $189 | 70 |
| 419 Longwood Dr | 0.54mi | 3/2.0 | 1,491 (-6%) | 6mo | $245,000 | $164 | 58 |
| 353 202nd St | 0.55mi | 3/2.5 | 1,700 (+7%) | 5mo | $245,000 | $144 | 55 |
| 176 N Floyd Ln | 0.74mi | 3/2.0 | 1,660 (+4%) | 7mo | $150,000 | $90 | 50 |
| 167 Kingston Pl | 0.62mi | 3/1.5 | 1,385 (-13%) | 1mo | $215,000 | $155 | 48 |
| 444 Wood St | 0.58mi | 3/2.0 | 1,393 (-12%) | 7mo | $212,000 | $152 | 44 |
| 606 De Angelis Ct | 0.74mi | 3/2.0 | 1,394 (-12%) | 0mo | $172,000 | $123 | 42 |
| 540 W Winchester Rd | 0.69mi | 3/2.0 | 1,800 (+13%) | 5mo | $150,000 | $83 | 40 |
| 229 Cove Dr | 0.54mi | 4/3.5 (+1) | 1,770 (+11%) | 8mo | $425,000 | $240 | 37 |
Match score weights: distance 35% · size 25% · config 20% · recency 20%. Top-matched comps best support the ARV.
Projected returns pro-forma
-3.0% appreciation · 3.0% rent growth · sell at horizon
- IRR
- -24.7%
- Equity multiple
- 0.16×
- Total profit
- $-76,532
- Equity at exit
- $48,440
- IRR
- -20.1%
- Equity multiple
- -0.06×
- Total profit
- $-96,790
- Equity at exit
- $28,089
Cash invested: $90,964 (down + closing). Projections, not guarantees.
Landlord ↔ Tenant lean methodology
- Overall (STATE)
- 43 Moderately Tenant-Leaning
- State Illinois
- 43 Moderately Tenant-Leaning · D+7
- County
- — inherits STATE
- City
- — inherits STATE
ZIP-level market 60422
- Home prices YoY
- -26.3%
- Active inventory
- 94
- Price-to-rent
- 9.9×
Monthly cashflow live
- Estimated rent
- $2,733 medium interval (Pro) →
- Mortgage (P&I)
- −$1,704
- Tax from tax record
- −$699 /mo · $8,383/yr
- Insurance
- −$135
- HOA
- −$0
- Vacancy / Maint / Mgmt
- −$574
- Net cashflow
- $-379
Break-even live
UW: 25.0% down · 7.5% · 30yr · 1.5% tax · 5.0% vac · 8.0% maint · 8.0% mgmt
Financing live
Cash to close
- Down payment
- $81,218
- Closing costs
- $9,746
- Reserves months
- —
- Total cash needed
- —
Loan-product check · same deal, 3 products live
Conventional
25% down · 7.5% · 30yr
- Down + closing
- —
- Monthly P&I
- —
- Monthly cashflow
- —
- DSCR
- —
- Eligible?
- —
Personal DTI + credit; lowest rate.
DSCR
20% down · 8.5% · 30yr
- Down + closing
- —
- Monthly P&I
- —
- Monthly cashflow
- —
- DSCR
- —
- Eligible?
- —
No personal income docs; deal must DSCR.
Hard money
10% down · 12.0% · 12mo
- Down + closing
- —
- Monthly P&I
- —
- Monthly cashflow
- —
- DSCR
- —
- Eligible?
- —
Short-term bridge; refi at stabilization.
Rent comps 2 comps
| Address | Beds | Baths | Sqft | Rent | $/sqft | DOM | Units | Dist |
|---|---|---|---|---|---|---|---|---|
| 1332 Jamie Ln Homewood, IL | 4.0 | 2.5 | 1576 | $3,171 | $2.01 | 24d | 1 | 1.24mi |
| 531 Wallace St Chicago Heights, IL | 3.0 | 1.0 | 1100 | $2,000 | $1.82 | 5d | 1 | 1.45mi |
Listing history 50 events
-
2026-06-18days on market $324,873 Active 3 DOM
-
2026-06-17days on market $324,873 Active 2 DOM
-
2026-06-15days on market $324,873 Active 1 DOM
-
2026-06-15days on market $324,873 Active 30 DOM
-
2026-06-13days on market $324,873 Active 28 DOM
-
2026-06-09pricedays on market $324,873 Active 24 DOM
-
2026-06-08days on market $339,873 Active 23 DOM
-
2026-06-07days on market $339,873 Active 22 DOM
-
2026-06-04days on market $339,873 Active 19 DOM
-
2026-06-03days on market $339,873 Active 18 DOM
-
2026-06-02days on market $339,873 Active 17 DOM
-
2026-06-01days on market $339,873 Active 16 DOM
-
2026-05-31days on market $339,873 Active 15 DOM
-
2026-05-16$339,873 Active
-
2011-10-31soldstatus $169,000 Closed Sale 256-char remark
Show marketing remark (256 chars)
Totally updated 4 bedroom home. Updates include new windows, new carpet, new paint, ceramic tile, hardwood floors, cherry cabinets, all stainless appliances stay. Huge 75 x 200 lot on a beautiful tree lined street. New front load washer and dryer stay!!!!!
-
2011-10-26soldstatus $169,000
-
2011-09-12status Pending 256-char remark
Show marketing remark (256 chars)
Totally updated 4 bedroom home. Updates include new windows, new carpet, new paint, ceramic tile, hardwood floors, cherry cabinets, all stainless appliances stay. Huge 75 x 200 lot on a beautiful tree lined street. New front load washer and dryer stay!!!!!
-
2011-09-09$169,900 New 256-char remark
Show marketing remark (256 chars)
Totally updated 4 bedroom home. Updates include new windows, new carpet, new paint, ceramic tile, hardwood floors, cherry cabinets, all stainless appliances stay. Huge 75 x 200 lot on a beautiful tree lined street. New front load washer and dryer stay!!!!!
-
2011-09-02historical
-
2011-08-12price Price Change
-
2011-07-25price Price Change
-
2011-07-11New
-
2011-06-30historical
-
2011-06-03price
-
2011-06-01price Price Change
-
2011-05-03New
-
2008-11-18historical
-
2008-11-18soldstatus $189,900 Closed Sale
-
2008-10-17historical
-
2008-10-16price $189,900
-
2008-10-01price $198,990
-
2008-09-25price $208,999
-
2008-08-24status
-
2008-08-24historical
-
2008-08-19price $219,900
-
2008-07-11$229,900
-
2008-07-11historical
-
2007-09-05
-
2007-05-29soldstatus $186,000
-
2007-05-24soldstatus $186,000
-
2007-04-19historical
-
2007-03-20$189,900
-
2007-03-20historical
-
2007-03-09
-
2007-01-16historical
-
2006-12-29
-
2003-05-21soldstatus $149,000
-
1983-12-05soldstatus $95,000
-
1983-10-01soldstatus $95,000
-
1977-03-04soldstatus $68,500
ⓘ Source: listings_history table (triggers on properties + properties_extension) + one-shot
backfill from property_details.listing_events for pre-trigger history.
Tax reassessment forecast IL · Partial reset (capped growth)
- Current annual tax
- $8,383 · $699/mo
- Projected year-2 tax
- $8,383 · $699/mo
- Expected delta
- $0/yr ($0/mo · 0.0%)
ⓘ Screening estimate from a state-policy table — verify with the county assessor before closing.
Climate risk First Street
- Flood 1/10 Low FEMA zone X (unshaded) · 0% chance over 30 yrs
- Wildfire 1/10 Low
- Heat 3/10 Moderate 7 d/yr ≥101°F today · 16 d/yr by 30 yrs out
- Wind 2/10 Low
- Air quality 2/10 Low 1 unhealthy d/yr today · 1 by 30 yrs out
Nearby sold comps map
Loading sold comps map…
Walkable amenities ~0.75 mi
Loading nearby amenities…
Taxation est. · year 1
- Rental income
- $32,796
- − Mortgage interest
- −$18,198
- − Property taxes
- −$8,383
- − Insurance
- −$1,624
- − Repairs & maintenance
- −$2,624
- − Management
- −$2,624
- − Depreciation
- −$9,451
- Taxable loss
- −$10,107
- Est. tax savings @ 24.0%
- +$2,426
- After-tax cash flow
- $-2,117/yr
For passive investors: Depreciation is non-cash, so a rental often shows a tax loss while cash-flowing — sheltering income. Rental losses are passive: they offset passive income freely, and up to $25,000/yr can offset ordinary (W-2) income if you actively participate and your MAGI is under $100k (phasing out to $0 by $150k); unused losses carry forward. On sale, claimed depreciation is recaptured at up to 25%, and gains may owe capital-gains tax (a 1031 exchange can defer both). Figures are a year-1 estimate at your 24.0% rate — not tax advice; consult a CPA.
Schools (NCES district)
- District
- Homewood Flossmoor Chsd 233
- NCES district ID
- 1719560
- Math proficiency
- 21% ▼ -15.00%
- Reading proficiency
- 27% ▼ -13.00%
- Median HH income
- $83,564
- Composite
- 24.42/100
- National rank
- #7681
- State rank
- #272 of 620 in IL
Livability — Flossmoor
- Score
- 80/100
- State rank
- #107
- US rank
- #1718
Category grades
Schools grade is shown separately in the Schools card above.
Census & demographics
- Census place
- Flossmoor, IL
- City population
- 9,885
- Population (ZIP)
- 9,885
Population outlook (Cook County) Hauer SSP2
- Today (2025)
- 5,347,519 people
- By 2030
- 5,357,703 · +0.2%
- By 2040
- 5,324,924 · -0.4%
- By 2050
- 5,230,762 · -2.2%
- By 2075
- 4,785,735 · -10.5%
- By 2100
- 4,188,836 · -21.7%
Race, ethnicity, and origin ACS 2023
- Neighborhood character
- Majority Black (63%)
- Race & ethnicity
- Black 63% White 28% Hispanic / Latino 5% Two or more races 4% Asian 2%
- Common ancestry
- Iranian 3% Romanian 3% Portuguese 2%
- Foreign-born
- 5% · Canada
- Languages at home
- 92% English-only · Spanish 4% Other Asian/Pacific 2% Other Indo-European 1%
Political lean MEDSL · Cook
- 2024 margin
- Solid D (+42.0) · D 70.4% · R 28.4% · Other 1.2%
- 2008→2024 swing
- -11.4pp toward R · 2008: 53.4pp · 2024: 42.0pp
- All cycles
- 2024: D+42.0 2020: D+50.3 2016: D+53.0 2012: D+49.4 2008: D+53.4
Not yet ingested
- Civics
- —
Market trends
- HPI YoY
- ▼ -67.78%
- Current HPI
- 189.5534
- Rent YoY
- —
- Metro
- —
- State GDP YoY
- ▲ 1.59%
- F500 in state
- 60
Industry mix (Fortune 500 HQ in IL)
| Industry | F500 HQs | Revenue |
|---|---|---|
| Insurance | 4 | $201B |
|
||
| Consumer Goods | 4 | $87B |
|
||
| Industrial Machinery | 3 | $64B |
|
||
| Healthcare | 2 | $55B |
|
||
| Retail / Pharmacy | 1 | $148B |
|
||
| Agriculture / Food | 1 | $86B |
|
||
Price history
+396.2% since first listed37 events — show timeline
- 2026-05-16 Listed $339,873 MRED as Distributed by MLS Grid
- 2011-10-31 Sold (MLS) $169,000 MRED as Distributed by MLS Grid
- 2011-10-26 Sold (Public Records) $169,000 Public Records
- 2011-09-12 Pending — MRED as Distributed by MLS Grid
- 2011-09-09 Listed $169,900 MRED as Distributed by MLS Grid
- 2011-09-02 Listing Removed — MRED as Distributed by MLS Grid
- 2011-08-12 Price Changed — MRED as Distributed by MLS Grid
- 2011-07-25 Price Changed — MRED as Distributed by MLS Grid
- 2011-07-11 Listed — MRED as Distributed by MLS Grid
- 2011-06-30 Listing Removed — MRED as Distributed by MLS Grid
- 2011-06-03 Price Changed — MRED as Distributed by MLS Grid
- 2011-06-01 Price Changed — MRED as Distributed by MLS Grid
- 2011-05-03 Listed — MRED as Distributed by MLS Grid
- 2008-11-18 Listing Removed — MRED as Distributed by MLS Grid
- 2008-11-18 Sold (MLS) $189,900 MRED as Distributed by MLS Grid
- 2008-10-17 Contingent — MRED as Distributed by MLS Grid
- 2008-10-16 Price Changed $189,900 MRED as Distributed by MLS Grid
- 2008-10-01 Price Changed $198,990 MRED as Distributed by MLS Grid
- 2008-09-25 Price Changed $208,999 MRED as Distributed by MLS Grid
- 2008-08-24 Relisted — MRED as Distributed by MLS Grid
- 2008-08-24 Listing Removed — MRED as Distributed by MLS Grid
- 2008-08-19 Price Changed $219,900 MRED as Distributed by MLS Grid
- 2008-07-11 Listed $229,900 MRED as Distributed by MLS Grid
- 2008-07-11 Listing Removed — MRED as Distributed by MLS Grid
- 2007-09-05 Listed — MRED as Distributed by MLS Grid
- 2007-05-29 Sold (Public Records) $186,000 Public Records
- 2007-05-24 Sold (MLS) $186,000 MRED as Distributed by MLS Grid
- 2007-04-19 Listing Removed — MRED as Distributed by MLS Grid
- 2007-03-20 Listing Removed — MRED as Distributed by MLS Grid
- 2007-03-20 Listed $189,900 MRED as Distributed by MLS Grid
- 2007-03-09 Listed — MRED as Distributed by MLS Grid
- 2007-01-16 Listing Removed — MRED as Distributed by MLS Grid
- 2006-12-29 Listed — MRED as Distributed by MLS Grid
- 2003-05-21 Sold (Public Records) $149,000 Public Records
- 1983-12-05 Sold (Public Records) $95,000 Public Records
- 1983-10-01 Sold (Public Records) $95,000 Public Records
- 1977-03-04 Sold (Public Records) $68,500 Public Records
Property tax history
+1.1%/yrLatest (2023): $8,383 · +43.8% YoY. Source: county tax records.
Cash-flow waterfall
monthlySold comps — $/sqft
last 12 mo · ≤1 miLoading sold comps…