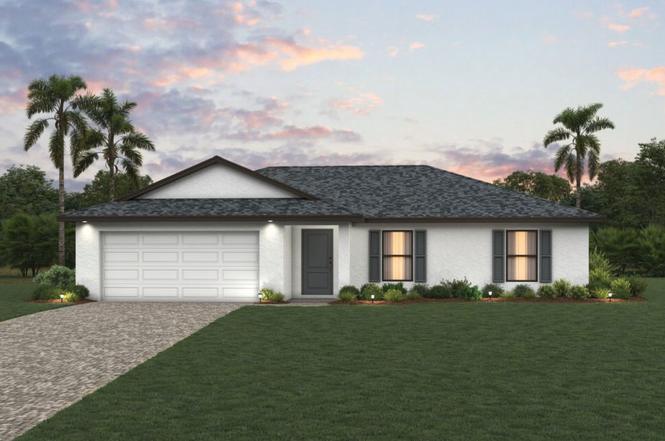
6012 Keystone Cir · Port LaBelle, FL
Flood risk 3/10 · Minor
- FEMA flood zone
- X (unshaded)
- Chance of flooding over 30 yrs
- 0.17%
- Est. flood insurance / yr
- $507 – $1,088
Fire risk 4/10 · Minor
- Est. fire insurance / yr
- $947 – $1,759
Heat risk 9/10 · Severe
- Hot days now (above 108°F)
- 7 days/yr
- Hot days in 30 yrs
- 26 days/yr
Wind risk 10/10 · Severe
- Chance of severe wind over 30 yrs
- 99.0%
Air-quality risk 2/10 · Minimal
- Unhealthy air days now
- 2 days/yr
- Unhealthy air days in 30 yrs
- 2 days/yr
Risk factors via First Street. Map © Google.
Why this score? — see what drove the C grade
The composite is a weighted blend of 9 inputs, each scored 0–100. Each bar is that input's sub-score; the figure is the points it added to the 100-point composite (weight × sub-score).
- Cash flow +19.5/30.0
- Appreciation +10.0/10.0
- ARV discount +7.5/15.0
- DSCR +6.2/10.0
- 1% rule +3.8/10.0
- Schools +3.1/10.0
- Livability +3.1/5.0
- Rent growth +2.5/5.0
- Condition / age +2.5/5.0
$249,990
🖨 Deal sheet 📄 Offer letter ✓ Due diligence
Listing remarks
Was $272,500 - Now $249,990! NEW CONSTRUCTION WITH WARRANTY! * * MOVE-IN READY! * * SPECIAL INCENTIVES: Up to $10,000 toward closing costs, rate buydowns, and prepaids when using preferred lender and title. The Santa Maria showcases a bright, open-concept floorplan that seamlessly blends the Great Room, kitchen, & dining area into one spacious main living space with upgraded plank tile floors. A vaulted ceiling enhances the sense of openness, while sliding glass doors extend the living area to a breezy lanai—perfect for indoor-outdoor entertaining. The kitchen is thoughtfully designed with an island-style layout featuring a statement breakfast bar, Quartz countertops, &
Key facts
- Vaulted ceiling
- Sliding glass doors
- Breezy lanai
Tags
Property features AI
Finance
- Financial info: Pets allowed
- HOA & community: No association fee reported
Exterior
- Parking: Attached garage with 2 covered spaces; Driveway; Paved parking; Garage door opener
- Security: Smoke detector(s)
- Utilities: Public water; Septic sewer; Cable available
- Home design: Single-story home; Entry level: 1; New construction; Faces north
- Construction: Built with block, concrete and stucco; Shingle roof
- Exterior features: Patio (open); Porch; Security / high-impact doors; Paved road access; Rectangular lot; Lot exposures to the south; Lot dimensions approximately 80 x 125 x 80 x 122 (survey)
Interior
- Kitchen: Dishwasher; Icemaker; Microwave; Range; Refrigerator (with ice maker); Eat-in kitchen; Pantry; Breakfast bar
- Bedrooms: Guest quarters; Primary suite on main level
- Flooring: Carpet; Tile
- Bathrooms: 2 full bathrooms; Separate shower(s); shower-only configuration in at least one bathroom; Dual sinks
- Heating & cooling: Central heating (electric); Central air conditioning (electric)
- Interior features: Impact glass windows; Breakfast bar; Dual sinks; Eat-in kitchen; Pantry; Shower only in at least one bath; Separate shower; Cable TV ready; Walk-in closet(s); Split bedroom floor plan; Main level primary
- Laundry & utility: Washer hookup inside; Dryer hookup inside
Neighborhood map
What this means for you Summary
Snapshot
- This is a 3-bed/2.0-bath land listed at $250k.
Deal economics
- At list price, monthly cash flow is $282 ($3k/yr) — positive.
- The deal already cash-flows at list — no discount required.
- To meet the 1% rule (rent ≥ 1% of price), the offer needs to be $220k (11.9% below list).
- Recommended offer: $220k (12.0% below list) — sets the bar for market timing.
- Cap rate 7.6% vs local median 5.1% in Port LaBelle — top-decile yield for the area; either an underpriced asset or a hidden risk that comps aren't pricing in. Stress-test before assuming the spread holds.
Location & tenants
- Location reads 62/100 on livability (#750 in FL) — a middle-class / working-renter tenant base. Strengths: cost of living A+, housing A+; Watch: schools F, amenities F, commute F.
- Hendry (town): math 35% / reading 40% proficiency, ranked #65 of 73 in FL (top 89%) — families likely to look elsewhere, expect single-tenant / working-renter base with shorter leases; 75% free/reduced lunch — lower-income household profile, screen leases tightly.
- Market conditions: 942 active listings in the ZIP; 21 comparable units currently listed for rent nearby; rentals at typical pace (median 16d on market — plan ~3-4 weeks tenant-placement turnaround); 557 units permitted in Hendry County in 2024 (45 in 5+ unit buildings).
- At $2,203/mo this rent would consume 46% of the median local household income ($57k/yr) (locally 498% of renters already pay >50% of income on rent) — very limited rent-growth headroom before tenants either downsize or default.
Forward outlook
- In year one you build about $27k of equity ($2k loan paydown + $25k appreciation (10.0% local appreciation)).
- Hendry County population projected to shrink 7% by 2050 — rents likely to lag national; underwrite the cash flow, not the appreciation.
- At projected returns (10.0% appreciation + 3.0% rent growth), your $70k cash investment doubles in ~3 years — after that, you're playing with house money.
- By year 2, paydown + projected appreciation supports a ~$43k cash-out refi (75% LTV) — recoverable capital for the next deal without selling this one.
Negotiation context
- It's been on market 125 days — a 12% lower offer ($220k) is reasonable based on typical stale-listing flexibility.
- 2 sale attempts; this cycle's ask has dropped $30k (11%) from the opening price — seller is motivated, your offer sets the floor, not the list.
- Current owner paid $22k; list at $250k implies a 1036% gain — meaningful room to come down on a strong offer.
Risks & watch-outs
- Climate carrying-cost: severe wind risk, 99% chance of damaging wind over 30y; extreme-heat days projected 7→26/yr by 2055 (HVAC capex compounding) — expect insurance premiums to compound above CPI over the hold.
Questions for the listing agent
- It's been on market 125 days. Have you received any prior offers? Is the seller open to a 12% concession, seller financing, or rate buy-down credit?
- Why hasn't it sold? Are there any deal-killer items the seller is aware of (foundation, flood, title, zoning, code violations)?
- Is there a deadline driving the sale (1031 exchange, divorce, estate, relocation)? That informs how much negotiation room exists.
- Schools are F-rated, which usually means shorter tenancies and higher turnover. Who's the typical renter profile here, and what's been the actual vacancy rate?
- What's the average days-on-market for RENTAL listings here right now (not sales)? A rising rental-DOM trend means longer vacancies and softer asking-rent achievability than the comps imply.
- What's the recent tenant-quality profile in this submarket — average credit score on applications, eviction rate, late-payment / NSF rate, and stable-employment percentage? A property-management company in the area should have these aggregated.
- How much new for-sale + rental construction is in the pipeline within 1–3 miles? Heavy new supply typically softens prices + rents 12–24 months out; constrained supply supports both.
Investment metrics
- 1% rule
- 0.88% ✗
- Cap rate
- 7.65%
- Cash-on-cash
- 4.83%
- DSCR
- 1.22
- GRM
- 9.5
CMA / ARV
No comps found within radius.
Projected returns pro-forma
10.0% appreciation · 3.0% rent growth · sell at horizon
- IRR
- 27.8%
- Equity multiple
- 3.20×
- Total profit
- $153,980
- Equity at exit
- $225,211
- IRR
- 24.2%
- Equity multiple
- 7.27×
- Total profit
- $439,058
- Equity at exit
- $485,676
Cash invested: $69,997 (down + closing). Projections, not guarantees.
Landlord ↔ Tenant lean methodology
- Overall (STATE)
- 87 Strongly Landlord-Friendly
- State Florida
- 87 Strongly Landlord-Friendly · R+3
- County
- — inherits STATE
- City
- — inherits STATE
ZIP-level market 33935
- Home prices YoY
- 16.3%
- Active inventory
- 942
- Price-to-rent
- 9.5×
Monthly cashflow live
- Estimated rent
- $2,203 high interval (Pro) →
- Mortgage (P&I)
- −$1,311
- Tax from tax record
- −$43 /mo · $514/yr
- Insurance
- −$104
- HOA
- −$0
- Vacancy / Maint / Mgmt
- −$463
- Net cashflow
- $282
Break-even live
UW: 25.0% down · 7.5% · 30yr · 1.5% tax · 5.0% vac · 8.0% maint · 8.0% mgmt
Financing live
Cash to close
- Down payment
- $62,498
- Closing costs
- $7,500
- Reserves months
- —
- Total cash needed
- —
Loan-product check · same deal, 3 products live
Conventional
25% down · 7.5% · 30yr
- Down + closing
- —
- Monthly P&I
- —
- Monthly cashflow
- —
- DSCR
- —
- Eligible?
- —
Personal DTI + credit; lowest rate.
DSCR
20% down · 8.5% · 30yr
- Down + closing
- —
- Monthly P&I
- —
- Monthly cashflow
- —
- DSCR
- —
- Eligible?
- —
No personal income docs; deal must DSCR.
Hard money
10% down · 12.0% · 12mo
- Down + closing
- —
- Monthly P&I
- —
- Monthly cashflow
- —
- DSCR
- —
- Eligible?
- —
Short-term bridge; refi at stabilization.
Rent comps 21 comps
| Address | Beds | Baths | Sqft | Rent | $/sqft | DOM | Units | Dist |
|---|---|---|---|---|---|---|---|---|
| 6210 Forest Ct Labelle, FL | 3.0 | 2.5 | 1503 | $2,200 | $1.46 | 23d | 1 | 0.11mi |
| 7016 Palpano Cir Labelle, FL | 3.0 | 2.5 | 1507 | $2,100 | $1.39 | 15d | 1 | 0.51mi |
| 7061 Tide Cir Labelle, FL | 4.0 | 2.0 | 1500 | $1,695 | $1.13 | 23d | 1 | 0.61mi |
| 8030 Olive Cir Labelle, FL | 4.0 | 2.0 | 1499 | $2,300 | $1.53 | 3d | 1 | 0.66mi |
| 6018 Acorn Cir Labelle, FL | 3.0 | 2.0 | 1408 | $2,200 | $1.56 | 15d | 1 | 0.72mi |
| 9011 Penny Cir Labelle, FL | 3.0 | 2.0 | 1731 | $2,400 | $1.39 | 23d | 1 | 0.76mi |
| 9001 Penny Cir Labelle, FL | 3.0 | 2.0 | 1472 | $2,300 | $1.56 | 23d | 1 | 0.85mi |
| 9001 Penny Cir Labelle, FL | 3.0 | 2.0 | 1472 | $2,300 | $1.56 | 15d | 1 | 0.85mi |
| 8049 Memory Cir Labelle, FL | 4.0 | 2.0 | 1686 | $2,000 | $1.19 | 3d | 1 | 0.86mi |
| 8004 Spice Ct Labelle, FL | 3.0 | 2.0 | 1292 | $2,000 | $1.55 | 19d | 1 | 0.92mi |
| 801 SW Raintree Blvd Labelle, FL | 3.0 | 2.0 | 1285 | $1,700 | $1.32 | 23d | 1 | 1.00mi |
| 7038 Lotus Cir Labelle, FL | 4.0 | 3.0 | 1680 | $2,200 | $1.31 | 15d | 1 | 1.08mi |
| 8033 Melody Cir Labelle, FL | 3.0 | 2.0 | 1215 | $1,999 | $1.65 | 15d | 1 | 1.09mi |
| 9012 S Indio Ct Labelle, FL | 3.0 | 2.0 | 1400 | $2,100 | $1.50 | 19d | 1 | 1.09mi |
| 9013 Ike Ct Labelle, FL | 3.0 | 2.0 | 1367 | $2,100 | $1.54 | 2d | 1 | 1.13mi |
| 9035 W Crow Cir Labelle, FL | 4.0 | 2.0 | 1530 | $1,950 | $1.27 | 3d | 1 | 1.14mi |
| 8002 Vega Ct Labelle, FL | 3.0 | 2.0 | 1389 | $1,900 | $1.37 | 23d | 1 | 1.24mi |
| 9007 Meadow Cir Labelle, FL | 4.0 | 2.0 | 1500 | $1,695 | $1.13 | 3d | 1 | 1.25mi |
| 9018 W Justice Cir Labelle, FL | 4.0 | 2.0 | 1499 | $1,950 | $1.30 | 11d | 1 | 1.34mi |
| 5029 S Rosebud Cir Labelle, FL | 3.0 | 2.0 | 1389 | $1,780 | $1.28 | 23d | 1 | 1.35mi |
| 1064 Calumet Rd Labelle, FL | 3.0 | 2.5 | 1503 | $2,200 | $1.46 | 23d | 1 | 1.48mi |
Listing history 20 events
-
2026-06-18days on market $249,990 Active 125 DOM
-
2026-06-17days on market $249,990 Active 124 DOM
-
2026-06-16days on market $249,990 Active 123 DOM
-
2026-06-15days on market $249,990 Active 122 DOM
-
2026-06-13days on market $249,990 Active 120 DOM
-
2026-06-13days on market $249,990 Active 119 DOM
-
2026-06-10remarks 689-char remark
-
2026-06-10days on market $249,990 Active 117 DOM
-
2026-06-09days on market $249,990 Active 116 DOM
-
2026-06-08pricedays on market $249,990 Active 115 DOM
-
2026-06-07days on market $259,990 Active 114 DOM
-
2026-06-03days on market $259,990 Active 110 DOM
-
2026-06-02days on market $259,990 Active 109 DOM
-
2026-06-01days on market $259,990 Active 108 DOM
-
2026-05-31days on market $259,990 Active 107 DOM
-
2026-05-21price $259,990
-
2026-05-11price $272,500
-
2026-02-17$279,990 Active
-
2026-02-13$279,990 Active
-
2025-01-10soldstatus $22,000
ⓘ Source: listings_history table (triggers on properties + properties_extension) + one-shot
backfill from property_details.listing_events for pre-trigger history.
Tax reassessment forecast FL · Resets to sale price
- Current annual tax
- $514 · $43/mo
- Projected year-2 tax
- $2,075 · $173/mo
- Expected delta
- +$1,561/yr (+$130/mo · 303.6%)
ⓘ Screening estimate from a state-policy table — verify with the county assessor before closing.
Climate risk First Street
- Flood 3/10 Moderate FEMA zone X (unshaded) · 17% chance over 30 yrs
- Wildfire 4/10 Moderate
- Heat 9/10 Extreme 7 d/yr ≥108°F today · 26 d/yr by 30 yrs out
- Wind 10/10 Extreme 99% chance of damaging wind over 30 yrs
- Air quality 2/10 Low 2 unhealthy d/yr today · 2 by 30 yrs out
Nearby sold comps map
Loading sold comps map…
Walkable amenities ~0.75 mi
Loading nearby amenities…
Taxation est. · year 1
- Rental income
- $26,430
- − Mortgage interest
- −$14,003
- − Property taxes
- −$514
- − Insurance
- −$1,250
- − Repairs & maintenance
- −$2,114
- − Management
- −$2,114
- − Depreciation
- −$7,272
- Taxable loss
- −$838
- Est. tax savings @ 24.0%
- +$201
- After-tax cash flow
- $3,585/yr
For passive investors: Depreciation is non-cash, so a rental often shows a tax loss while cash-flowing — sheltering income. Rental losses are passive: they offset passive income freely, and up to $25,000/yr can offset ordinary (W-2) income if you actively participate and your MAGI is under $100k (phasing out to $0 by $150k); unused losses carry forward. On sale, claimed depreciation is recaptured at up to 25%, and gains may owe capital-gains tax (a 1031 exchange can defer both). Figures are a year-1 estimate at your 24.0% rate — not tax advice; consult a CPA.
Schools (NCES district)
- District
- Hendry
- NCES district ID
- 1200780
- Math proficiency
- 35% ▼ -11.00%
- Reading proficiency
- 40% ▼ -4.00%
- Median HH income
- $37,043
- Composite
- 31.16/100
- National rank
- #6054
- State rank
- #65 of 73 in FL
Livability — Port LaBelle
- Score
- 62/100
- State rank
- #750
- US rank
- #16264
Category grades
Schools grade is shown separately in the Schools card above.
Census & demographics
- Census place
- Port LaBelle, FL
- County
- Hendry County · 23,186 people
- Metro
- Clewiston, FL
- Population (ZIP)
- 23,186
- Household income
- $57,009
- Rent vs Own
- Severe rent burden
- 498.0
Population outlook (Hendry County) Hauer SSP2
- Today (2025)
- 38,866 people
- By 2030
- 38,558 · -0.8%
- By 2040
- 37,743 · -2.9%
- By 2050
- 36,117 · -7.1%
- By 2075
- 30,070 · -22.6%
- By 2100
- 21,966 · -43.5%
Race, ethnicity, and origin ACS 2023
- Neighborhood character
- Majority Hispanic (56%)
- Race & ethnicity
- Hispanic / Latino 56% White 39% Two or more races 21% Black 2% Native American 2%
- Hispanic origin (detail)
- Mexican 40% Puerto Rican 3% Cuban 5%
- Common ancestry
- Lithuanian 2% Serbian 2% Slovak 1%
- Foreign-born
- 27% · Canada, Jamaica
- Languages at home
- 50% English-only · Spanish 50%
Political lean MEDSL · Hendry
- 2024 margin
- Solid R (+38.3) · D 30.4% · R 68.7%
- 2008→2024 swing
- -31.1pp toward R · 2008: -7.2pp · 2024: -38.3pp
- All cycles
- 2024: R+38.3 2020: R+23.0 2016: R+14.2 2012: R+5.9 2008: R+7.2
Not yet ingested
- Civics
- —
Market trends
- HPI YoY
- ▲ 75.20%
- Current HPI
- 537.4928
- Rent YoY
- —
- Metro
- Clewiston, FL
- State GDP YoY
- ▲ 3.28%
- F500 in state
- 36
Industry mix (Fortune 500 HQ in FL)
| Industry | F500 HQs | Revenue |
|---|---|---|
| Industrial Technology | 2 | $29B |
|
||
| Insurance | 2 | $17B |
|
||
| Retail | 1 | $60B |
|
||
| Technology Distribution | 1 | $58B |
|
||
| Homebuilding | 1 | $35B |
|
||
| Technology Manufacturing | 1 | $35B |
|
||
Price history
+1081.8% since first listed5 events — show timeline
- 2026-05-21 Price Changed $259,990 FORTMLS
- 2026-05-11 Price Changed $272,500 FORTMLS
- 2026-02-17 Listed $279,990 Zillow
- 2026-02-13 Listed $279,990 FORTMLS
- 2025-01-10 Sold (Public Records) $22,000 Public Records
Property tax history
+12.5%/yrLatest (2025): $514 · +9.4% YoY. Source: county tax records.
Cash-flow waterfall
monthlySold comps — $/sqft
last 12 mo · ≤1 miLoading sold comps…