 Multi-family
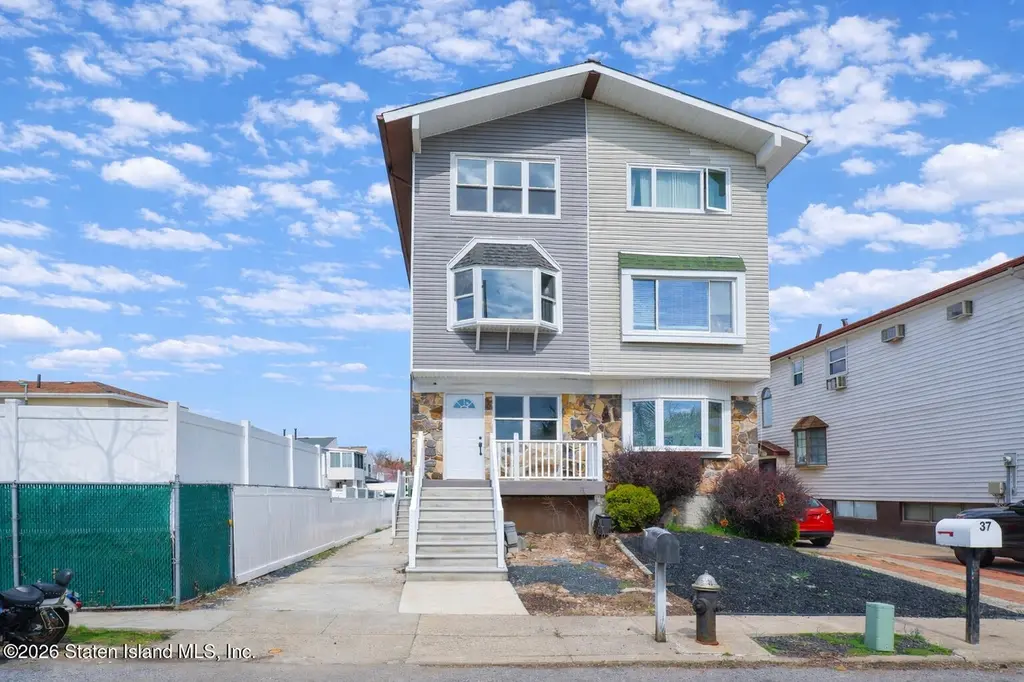
39 Strawberry Ln · New York, NY
Flood risk 1/10 · Minimal
- FEMA flood zone
- X (unshaded)
- Chance of flooding over 30 yrs
- 0.0%
- Est. flood insurance / yr
- $507 – $1,088
Fire risk 1/10 · Minimal
- Est. fire insurance / yr
- $691 – $1,283
Heat risk 7/10 · Major
- Hot days now (above 98°F)
- 7 days/yr
- Hot days in 30 yrs
- 16 days/yr
Wind risk 6/10 · Moderate
- Chance of severe wind over 30 yrs
- 69.0%
Air-quality risk 4/10 · Minor
- Unhealthy air days now
- 5 days/yr
- Unhealthy air days in 30 yrs
- 7 days/yr
Risk factors via First Street. Map © Google.
Why this score? — see what drove the F grade
The composite is a weighted blend of 9 inputs, each scored 0–100. Each bar is that input's sub-score; the figure is the points it added to the 100-point composite (weight × sub-score).
- ARV discount +15.0/15.0
- Schools +5.0/10.0
- Rent growth +4.5/5.0
- Livability +3.8/5.0
- Condition / age +2.5/5.0
- Cash flow +2.3/30.0
- 1% rule +0.0/10.0
- DSCR +0.0/10.0
- Appreciation +0.0/10.0
$698,000
🖨 Deal sheet (PDF) 📄 Offer letter ✓ Due diligence
Multi-family units
County records classify this as Multi-Family (2-4 Unit). Listing-text estimate: 1 unit. estimate disagrees with records
Listing remarks MLS
HUGE SEMI M/D IN ATLANTIC VILLAGE WITH FABULOUS OCEAN VIEW ON ALL SIDE,HARDWD FLRS,MINT COND.NEW BATHS,NEW WINDOWS,ALL MIRRORED CLOSETS,DOORS, CER.TILE IN KIT,2 LEGAL ELEC.METERS.POOL15X36,OWNER FINANCING.SUB TO E & O. Level 1: B: FULL,FINISHED,2BRS,FULL BATH,UTIL RM,CLOSETS L1: LG LR/DR,EIK,BALCONY,TERRACE IN THE BACK L2: ENTR.STEPS,LG LR,DR,EIK,HUGE DECK,ALL HARDWOOD FLRS,LAUNDRY CLOSET L3: MBR,BR,BR,FULL BATH
Key facts
- 2,709 sq ft lot
- Built 1982
- Listed 63 days
Property features AI
Finance
- HOA & community: Part of Atlantic Village association with monthly fees
Exterior
- Utilities: 220-volt electrical service
- Home design: 3-story property; Built in 2025 (approx); Vinyl siding; Excellent condition
- Construction: Vinyl siding construction; 3 stories
- Exterior features: Balcony; Water view
Interior
- Kitchen: Refrigerator
- Bathrooms: 3 full bathrooms; 1 half bathroom
- Heating & cooling: Natural gas forced air heating; Central air conditioning
- Interior features: Finished basement; Central air
Neighborhood map
What this means for you Summary
Snapshot
- This is a 3-bed/3.5-bath multifamily listed at $698k.
Deal economics
- At list price, monthly cash flow is $-2k ($-30k/yr) — negative.
- To cash-flow at today's rent, offer at most $262k (62.5% below list).
- To meet the 1% rule (rent ≥ 1% of price), the offer needs to be $269k (61.5% below list).
- Recommended offer: $262k (62.5% below list) — sets the bar for cash-flow.
- Cap rate 2.0% vs local median 2.6% in New York — below-typical yield; the buyer is paying a premium for something (appreciation thesis, condition, location) that the cap rate doesn't capture.
Location & tenants
- Location reads 75/100 on livability (#268 in NY, #4,188 nationally) — a middle-class / working-renter tenant base. Strengths: amenities A+, commute A+, health & safety A; Watch: crime F, cost of living F.
- Market conditions: Rents rising fast (+8.0%/yr); 396 active listings in the ZIP; high-income renter base; 480 units permitted in Richmond County in 2024 (22 in 5+ unit buildings).
Forward outlook
- Local home prices are declining (-3.0%/yr); year-one equity from $5k of loan paydown is wiped out by about $21k of value loss. Plan a longer hold.
- Richmond County population projected to shrink 5% by 2050 — rents likely to lag national; underwrite the cash flow, not the appreciation.
Negotiation context
- It's been on market 63 days — a 6% lower offer ($656k) is reasonable based on typical stale-listing flexibility.
- 3 sale attempts since 28y ago; this cycle's ask has dropped $150k (18%) from the opening price — seller is motivated, your offer sets the floor, not the list.
- Current owner paid $400k; list at $698k implies a 74% gain — meaningful room to come down on a strong offer.
Risks & watch-outs
- Climate carrying-cost: major wind risk, 69% chance of damaging wind over 30y; extreme-heat days projected 7→16/yr by 2055 (HVAC capex compounding) — expect insurance premiums to compound above CPI over the hold.
Questions for the listing agent
- What do current leases actually rent for vs. the listed asking? Can we see a recent rent roll and the last 12 months of T-12 income?
- It's been on market 63 days. Have you received any prior offers? Is the seller open to a 62% concession, seller financing, or rate buy-down credit?
- Why hasn't it sold? Are there any deal-killer items the seller is aware of (foundation, flood, title, zoning, code violations)?
- Is there a deadline driving the sale (1031 exchange, divorce, estate, relocation)? That informs how much negotiation room exists.
- Schools are B-rated — typically a magnet for longer-tenancy family renters. What's the average tenant stay here, and is there a school-zone premium baked into asking?
- Crime grade is F in this area — have there been break-ins, vandalism, or insurance claims at this property in the last 3 years? What carrier currently insures it and at what premium?
- The area grade is low — what's the realistic commute time and amenity access for the typical tenant pool here? Any planned neighborhood developments (good or bad) we should know about?
- What's the average days-on-market for RENTAL listings here right now (not sales)? A rising rental-DOM trend means longer vacancies and softer asking-rent achievability than the comps imply.
- What's the recent tenant-quality profile in this submarket — average credit score on applications, eviction rate, late-payment / NSF rate, and stable-employment percentage? A property-management company in the area should have these aggregated.
- How much new apartment / multifamily construction is in the pipeline within 1–3 miles? Heavy new supply (>2% of stock underway) typically softens rents 12–24 months out; light construction supports rent growth.
Investment metrics
- 1% rule
- 0.38% ✗
- Cap rate
- 2.05%
- Cash-on-cash
- -15.16%
- DSCR
- 0.33
- GRM
- 21.6
CMA / ARV
- ARV (on-the-fly)
- $842,940
- Comps found
- 5
Show comp detail 5 sales within ~0.75 mi
| Address | Dist | Beds/Ba | Sqft | Sold | Price | $/sf | Match |
|---|---|---|---|---|---|---|---|
| 4796 Hylan Blvd | 0.39mi | 3/3.5 | 2,100 (+11%) | 8mo | $990,000 | $471 | 57 |
| 4396 Hylan Blvd | 0.39mi | 4/2.5 (+1) | 2,089 (+10%) | 6mo | $949,000 | $454 | 50 |
| 36 Pacific Ave | 0.64mi | 4/2.5 (+1) | 1,750 (-7%) | 1mo | $780,000 | $446 | 48 |
| 79 Robinson Ave | 0.74mi | 2/1.5 (-1) | 1,800 (-5%) | 7mo | $800,000 | $444 | 39 |
| 22 Crest Loop | 0.66mi | 4/2.5 (+1) | 2,120 (+12%) | 6mo | $860,000 | $406 | 35 |
Match score weights: distance 35% · size 25% · config 20% · recency 20%. Top-matched comps best support the ARV.
Projected returns pro-forma
-3.0% appreciation · 8.0% rent growth · sell at horizon
- IRR
- -40.9%
- Equity multiple
- -0.31×
- Total profit
- $-256,214
- Equity at exit
- $104,074
- IRR
- -40.1%
- Equity multiple
- -0.85×
- Total profit
- $-361,320
- Equity at exit
- $60,350
Cash invested: $195,440 (down + closing). Projections, not guarantees.
Landlord ↔ Tenant lean methodology
- Overall (CITY)
- 0 Strongly Tenant-Friendly
- State New York
- 15 Strongly Tenant-Friendly · D+10
- County
- — inherits STATE
- City New York
- 0 Strongly Tenant-Friendly · D+34
ZIP-level market 10312
- Rents YoY
- 8.0%
- Active inventory
- 396
- Price-to-rent
- 21.6×
Monthly cashflow live
- Estimated rent
- $2,687 medium interval (Pro) →
- Mortgage (P&I)
- −$3,660
- Tax from tax record
- −$640 /mo · $7,677/yr
- Insurance
- −$291
- HOA
- −$0
- Vacancy / Maint / Mgmt
- −$564
- Net cashflow
- $-2,468
Break-even live
Sensitivity live
| Price | -10% $-2,073 | -5% $-2,271 | +0% $-2,468 | +5% $-2,666 | +10% $-2,863 |
|---|---|---|---|---|---|
| Rent | -10% $-2,681 | -5% $-2,574 | +0% $-2,468 | +5% $-2,362 | +10% $-2,256 |
| Rate | -1.0pp $-2,117 | -0.5pp $-2,291 | base $-2,468 | +0.5pp $-2,649 | +1.0pp $-2,833 |
UW: 25.0% down · 7.5% · 30yr · 1.5% tax · 5.0% vac · 8.0% maint · 8.0% mgmt
Financing live
Cash to close
- Down payment
- $174,500
- Closing costs
- $20,940
- Reserves months
- —
- Total cash needed
- —
Loan-product check · same deal, 3 products live
Conventional
25% down · 7.5% · 30yr
- Down + closing
- —
- Monthly P&I
- —
- Monthly cashflow
- —
- DSCR
- —
- Eligible?
- —
Personal DTI + credit; lowest rate.
DSCR
20% down · 8.5% · 30yr
- Down + closing
- —
- Monthly P&I
- —
- Monthly cashflow
- —
- DSCR
- —
- Eligible?
- —
No personal income docs; deal must DSCR.
Hard money
10% down · 12.0% · 12mo
- Down + closing
- —
- Monthly P&I
- —
- Monthly cashflow
- —
- DSCR
- —
- Eligible?
- —
Short-term bridge; refi at stabilization.
Listing history 17 events
-
2026-06-08days on market $698,000 Active 63 DOM
-
2026-06-08pricedays on market $698,000 Active 62 DOM
-
2026-06-04days on market $798,000 Active 59 DOM
-
2026-06-03days on market $798,000 Active 58 DOM
-
2026-06-01days on market $798,000 Active 56 DOM
-
2026-05-31days on market $798,000 Active 55 DOM
-
2026-05-14price $798,000
-
2026-04-06$848,000 Active
-
2025-05-02soldstatus $400,000
-
2025-02-19soldstatus $750,000
-
2016-02-17historical
-
2004-12-15soldstatus $400,000
-
2003-09-11$449,900
-
1998-09-01soldstatus $245,000
-
1998-07-29soldstatus $245,000 424-char remark
Show marketing remark (424 chars)
HUGE SEMI M/D IN ATLANTIC VILLAGE WITH FABULOUS OCEAN VIEW ON ALL SIDE,HARDWD FLRS,MINT COND.NEW BATHS,NEW WINDOWS,ALL MIRRORED CLOSETS,DOORS, CER.TILE IN KIT,2 LEGAL ELEC.METERS.POOL15X36,OWNER FINANCING.SUB TO E & O. Level 1: B: FULL,FINISHED,2BRS,FULL BATH,UTIL RM,CLOSETS L1: LG LR/DR,EIK,BALCONY,TERRACE IN THE BACK L2: ENTR.STEPS,LG LR,DR,EIK,HUGE DECK,ALL HARDWOOD FLRS,LAUNDRY CLOSET L3: MBR,BR,BR,FULL BATH
-
1998-01-13$254,900 424-char remark
Show marketing remark (424 chars)
HUGE SEMI M/D IN ATLANTIC VILLAGE WITH FABULOUS OCEAN VIEW ON ALL SIDE,HARDWD FLRS,MINT COND.NEW BATHS,NEW WINDOWS,ALL MIRRORED CLOSETS,DOORS, CER.TILE IN KIT,2 LEGAL ELEC.METERS.POOL15X36,OWNER FINANCING.SUB TO E & O. Level 1: B: FULL,FINISHED,2BRS,FULL BATH,UTIL RM,CLOSETS L1: LG LR/DR,EIK,BALCONY,TERRACE IN THE BACK L2: ENTR.STEPS,LG LR,DR,EIK,HUGE DECK,ALL HARDWOOD FLRS,LAUNDRY CLOSET L3: MBR,BR,BR,FULL BATH
-
1986-01-21soldstatus $180,000
ⓘ Source: listings_history table (triggers on properties + properties_extension) + one-shot
backfill from property_details.listing_events for pre-trigger history.
Tax reassessment forecast NY · Partial reset (capped growth)
- Current annual tax
- $7,677 · $640/mo
- Projected year-2 tax
- $9,737 · $811/mo
- Expected delta
- +$2,059/yr (+$172/mo · 26.8%)
ⓘ Screening estimate from a state-policy table — verify with the county assessor before closing.
Climate risk First Street
- Flood 1/10 Low FEMA zone X (unshaded) · 0% chance over 30 yrs
- Wildfire 1/10 Low
- Heat 7/10 Severe 7 d/yr ≥98°F today · 16 d/yr by 30 yrs out
- Wind 6/10 Major 69% chance of damaging wind over 30 yrs
- Air quality 4/10 Moderate 5 unhealthy d/yr today · 7 by 30 yrs out
Nearby sold comps map
Loading sold comps map…
Walkable amenities ~0.75 mi
Loading nearby amenities…
Taxation est. · year 1
- Rental income
- $32,244
- − Mortgage interest
- −$39,099
- − Property taxes
- −$7,677
- − Insurance
- −$3,490
- − Repairs & maintenance
- −$2,580
- − Management
- −$2,580
- − Depreciation
- −$20,305
- Taxable loss
- −$43,487
- Est. tax savings @ 24.0%
- +$10,437
- After-tax cash flow
- $-19,182/yr
For passive investors: Depreciation is non-cash, so a rental often shows a tax loss while cash-flowing — sheltering income. Rental losses are passive: they offset passive income freely, and up to $25,000/yr can offset ordinary (W-2) income if you actively participate and your MAGI is under $100k (phasing out to $0 by $150k); unused losses carry forward. On sale, claimed depreciation is recaptured at up to 25%, and gains may owe capital-gains tax (a 1031 exchange can defer both). Figures are a year-1 estimate at your 24.0% rate — not tax advice; consult a CPA.
Schools (NCES district)
No district data.
Livability — New York
- Score
- 75/100
- State rank
- #268
- US rank
- #4188
Category grades
Schools grade is shown separately in the Schools card above.
Census & demographics
- Census place
- New York, NY
- County
- Richmond County · 404,174 people
- City population
- 7,731,280
- Metro
- New York-Newark-Jersey City, NY-NJ-PA
- Population (ZIP)
- 63,469
- Household income
- $110,719
- Rent vs Own
- Severe rent burden
- 1081.0
Population outlook (Richmond County) Hauer SSP2
- Today (2025)
- 482,784 people
- By 2030
- 481,831 · -0.2%
- By 2040
- 473,159 · -2.0%
- By 2050
- 457,242 · -5.3%
- By 2075
- 408,029 · -15.5%
- By 2100
- 341,459 · -29.3%
Race, ethnicity, and origin ACS 2023
- Neighborhood character
- Predominantly White (74%)
- Race & ethnicity
- White 74% Hispanic / Latino 13% Asian 9% Two or more races 8%
- Hispanic origin (detail)
- Puerto Rican 8% Dominican 2%
- Common ancestry
- Scotch-Irish 5% Romanian 3% Subsaharan African 1%
- Foreign-born
- 20% · China, Canada, South Korea
- Languages at home
- 72% English-only · Russian/Polish/Slavic 7% Chinese 6% Other Indo-European 6%
Political lean MEDSL · Richmond
- 2024 margin
- Strong R (+29.8) · D 35.1% · R 64.9%
- 2008→2024 swing
- -25.7pp toward R · 2008: -4.0pp · 2024: -29.8pp
- All cycles
- 2024: R+29.8 2020: R+14.9 2016: R+16.8 2012: D+0.8 2008: R+4.0
Not yet ingested
- Civics
- —
Market trends
- HPI YoY
- ▼ -584.96%
- Current HPI
- 311.4886
- Rent YoY
- ▲ 8.04%
- Metro
- New York-Newark-Jersey City, NY-NJ-PA
- State GDP YoY
- ▲ 2.60%
- F500 in state
- 92
Industry mix (Fortune 500 HQ in NY)
| Industry | F500 HQs | Revenue |
|---|---|---|
| Financial Services | 10 | $950B |
|
||
| Consumer Goods | 9 | $162B |
|
||
| Insurance | 4 | $225B |
|
||
| Telecommunications | 2 | $144B |
|
||
| Pharmaceuticals | 2 | $112B |
|
||
| Media / Entertainment | 2 | $69B |
|
||
Price history
+343.3% since first listed11 events — show timeline
- 2026-05-14 Price Changed $798,000 SIBORMLS
- 2026-04-06 Listed $848,000 SIBORMLS
- 2025-05-02 Sold (Public Records) $400,000 Public Records
- 2025-02-19 Sold (Public Records) $750,000 Public Records
- 2016-02-17 Listing Removed — SIBORMLS
- 2004-12-15 Sold (Public Records) $400,000 Public Records
- 2003-09-11 Listed $449,900 SIBORMLS
- 1998-09-01 Sold (Public Records) $245,000 Public Records
- 1998-07-29 Sold (MLS) $245,000 SIBORMLS
- 1998-01-13 Listed $254,900 SIBORMLS
- 1986-01-21 Sold (Public Records) $180,000 Public Records
Property tax history
+3.5%/yrLatest (2025): $7,677 · +6.0% YoY. Source: county tax records.
Cash-flow waterfall
monthlySold comps — $/sqft
last 12 mo · ≤1 miLoading sold comps…