1983 Law St · New Orleans, LA
Flood risk 8/10 · Major
- FEMA flood zone
- X (shaded)
- Chance of flooding over 30 yrs
- 0.77%
- Est. flood insurance / yr
- $507 – $1,088
Fire risk 1/10 · Minimal
- Est. fire insurance / yr
- $1,269 – $2,357
Heat risk 10/10 · Severe
- Hot days now (above 108°F)
- 7 days/yr
- Hot days in 30 yrs
- 21 days/yr
Wind risk 10/10 · Severe
- Chance of severe wind over 30 yrs
- 99.0%
Air-quality risk 4/10 · Minor
- Unhealthy air days now
- 4 days/yr
- Unhealthy air days in 30 yrs
- 4 days/yr
Risk factors via First Street. Map © Google.
Why this score? — see what drove the C- grade
The composite is a weighted blend of 9 inputs, each scored 0–100. Each bar is that input's sub-score; the figure is the points it added to the 100-point composite (weight × sub-score).
- Cash flow +16.5/30.0
- ARV discount +15.0/15.0
- DSCR +5.1/10.0
- Livability +4.0/5.0
- 1% rule +3.8/10.0
- Rent growth +2.5/5.0
- Condition / age +2.5/5.0
- Schools +1.6/10.0
- Appreciation +0.0/10.0
$169,900
🖨 Deal sheet (PDF) 📄 Offer letter ✓ Due diligence
Listing remarks MLS
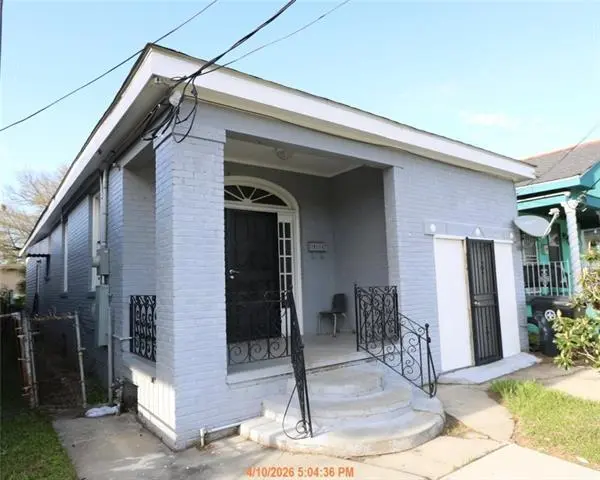
Welcome home to 1983 Law Street! This 4-bedroom, 2-bathroom residence offers 1,400 square feet of comfortable, carpet-free living -- ideal for allergy-sensitive households. Enjoy relaxing mornings on the charming front porch, and come home to the convenience of off-street parking. Inside, you'll find a functional layout with a versatile fourth bedroom perfect as a guest room, home office, or den. Situated in the heart of New Orleans' vibrant 7th Ward, this home sits directly across from a neighborhood park -- your own green space just steps from the front door. Located in Flood Zone X, no flood insurance is required, offering buyers valuable peace of mind and savings. With easy access to local dining, culture, and the energy that makes New Orleans one of a kind, 1983 Law Street is the perfect place to put down roots. Don't miss this one!
Key facts
- Front porch
- Flood zone x
- Off-street parking
Tags
Property features AI
Exterior
- Parking: Driveway; One off-street parking space
- Utilities: Public water; Public sewer
- Home design: Single-story; Entry level on raised foundation; Facing direction not specified; Property type not specified
- Construction: Brick veneer exterior; Asphalt shingle roof; Raised and slab foundation; Year built not specified
- Exterior features: City lot; Rectangular lot; Lot dimensions approximately 28 x 96
Interior
- Bathrooms: 2 full bathrooms
- Heating & cooling: Central heating; Central air conditioning
- Interior features: 9 total rooms; Average condition
Neighborhood map
What this means for you Summary
Snapshot
- This is a 2-bed/1.0-bath single-family listed at $170k.
Deal economics
- At list price, monthly cash flow is $32 ($384/yr) — positive.
- The deal already cash-flows at list — no discount required.
- To meet the 1% rule (rent ≥ 1% of price), the offer needs to be $149k (12.3% below list).
- Recommended offer: $149k (12.3% below list) — sets the bar for 1% rule.
- Cap rate 7.0% vs local median 4.4% in New Orleans — top-decile yield for the area; either an underpriced asset or a hidden risk that comps aren't pricing in. Stress-test before assuming the spread holds.
Location & tenants
- Location reads 81/100 on livability (#3 in LA, #1,383 nationally) — a professional / high-income tenant draw. Strengths: amenities A+, commute A+, health & safety A+; Watch: crime C-, employment D.
- Orleans Parish (urban): math 11% / reading 27% proficiency, ranked #69 of 98 in LA (top 70%) — low school quality limits family demand, transient renter base, plan for 1-2y turnover; 68% free/reduced lunch — lower-income household profile, screen leases tightly.
- Zoned schools: Benjamin Franklin Elem. Math And Science (math 12% / reading 23%, grade F, #479 of 646 statewide, top 75%, 747 students, 98% FRL, charter) — zoned schools average 98% FRL vs 68% district-wide (30 pts higher); higher-poverty schools than district average — tighter screening recommended.
- Market conditions: Rents soft (-0.2%/yr); 381 active listings in the ZIP; 40 comparable units currently listed for rent nearby; rentals at typical pace (median 22d on market — plan ~3-4 weeks tenant-placement turnaround); 710 units permitted in Orleans Parish in 2024 (244 in 5+ unit buildings).
- This rent runs 34% of the median local income ($53k/yr) — at the standard rent-burdened threshold; future hikes will face affordability resistance.
Forward outlook
- Local home prices are declining (-3.0%/yr); year-one equity from $1k of loan paydown is wiped out by about $5k of value loss. Plan a longer hold.
- Orleans County population projected at +61% by 2050 — long-run rental-demand tailwind backs the buy-and-hold thesis.
Negotiation context
- It's been on market 34 days — a 3% lower offer ($165k) is reasonable based on typical stale-listing flexibility.
- 3 sale attempts with the ask held roughly flat each time — persistent listings suggest the price (not the market) is what's stuck; bring a comps-based counter.
- Current owner paid $10k; list at $170k implies a 1599% gain — meaningful room to come down on a strong offer.
Risks & watch-outs
- Watch-outs: flood insurance adds $66/mo.
- Climate carrying-cost: severe flood risk; severe wind risk, 99% chance of damaging wind over 30y; extreme-heat days projected 7→21/yr by 2055 (HVAC capex compounding) — expect insurance premiums to compound above CPI over the hold.
Questions for the listing agent
- It's been on market 34 days. Have you received any prior offers? Is the seller open to a 12% concession, seller financing, or rate buy-down credit?
- What's the actual annual flood-insurance premium (NFIP or private), and is the property in a SFHA with mandatory coverage?
- Is there a deadline driving the sale (1031 exchange, divorce, estate, relocation)? That informs how much negotiation room exists.
- What's the average days-on-market for RENTAL listings here right now (not sales)? A rising rental-DOM trend means longer vacancies and softer asking-rent achievability than the comps imply.
- What's the recent tenant-quality profile in this submarket — average credit score on applications, eviction rate, late-payment / NSF rate, and stable-employment percentage? A property-management company in the area should have these aggregated.
- How much new for-sale + rental construction is in the pipeline within 1–3 miles? Heavy new supply typically softens prices + rents 12–24 months out; constrained supply supports both.
Investment metrics
- 1% rule
- 0.88% ✗
- Cap rate
- 6.99%
- Cash-on-cash
- 2.48%
- DSCR
- 1.11
- GRM
- 9.5
CMA / ARV
- ARV (on-the-fly)
- $209,603
- Comps found
- 10
Show comp detail 10 sales within ~0.75 mi
| Address | Dist | Beds/Ba | Sqft | Sold | Price | $/sf | Match |
|---|---|---|---|---|---|---|---|
| 2633 New Orleans St | 0.05mi | 3/1.0 (+1) | 925 (+6%) | 12mo | $45,000 | $49 | 73 |
| 2317 Florida Ave | 0.68mi | 2/1.0 | 845 (-4%) | 1mo | $64,900 | $77 | 62 |
| 2037 Saint Anthony St | 0.42mi | 2/1.0 | 960 (+10%) | 4mo | $126,000 | $131 | 61 |
| 2115 Laharpe St | 0.65mi | 2/1.5 | 898 (+2%) | 4mo | $249,900 | $278 | 60 |
| 1714 N Broad St | 0.48mi | 2/3.0 | 912 (+4%) | 10mo | $245,000 | $269 | 55 |
| 1672 Rousselin Dr | 0.51mi | 1/1.0 (-1) | 810 (-8%) | 13mo | $260,000 | $321 | 48 |
| 1714 Aubry St | 0.52mi | 3/1.0 (+1) | 1,008 (+15%) | 3mo | $73,000 | $72 | 43 |
| 2810 O'reilly St | 0.53mi | 2/1.0 | 963 (+10%) | 21mo | $274,000 | $285 | 42 |
| 3311 Republic St | 0.62mi | 2/2.5 | 811 (-8%) | 16mo | $168,000 | $207 | 39 |
| 1548 N Roman St | 0.72mi | 2/2.0 | 940 (+7%) | 21mo | $225,000 | $239 | 33 |
Match score weights: distance 35% · size 25% · config 20% · recency 20%. Top-matched comps best support the ARV.
Projected returns pro-forma
-3.0% appreciation · 0.0% rent growth · sell at horizon
- IRR
- -18.4%
- Equity multiple
- 0.37×
- Total profit
- $-29,854
- Equity at exit
- $25,333
- IRR
- -17.9%
- Equity multiple
- 0.15×
- Total profit
- $-40,223
- Equity at exit
- $14,690
Cash invested: $47,572 (down + closing). Projections, not guarantees.
Landlord ↔ Tenant lean methodology
- Overall (STATE)
- 90 Strongly Landlord-Friendly
- State Louisiana
- 90 Strongly Landlord-Friendly · R+12
- County
- — inherits STATE
- City
- — inherits STATE
ZIP-level market 70119
- Home prices YoY
- -34.8%
- Rents YoY
- -0.2%
- Active inventory
- 381
- Price-to-rent
- 9.5×
Monthly cashflow live
- Estimated rent
- $1,489 high interval (Pro) →
- Mortgage (P&I)
- −$891
- Tax from tax record
- −$116 /mo · $1,396/yr
- Insurance
- −$71
- Flood insurance flood zone
- −$66 /mo · $798/yr
- HOA
- −$0
- Vacancy / Maint / Mgmt
- −$313
- Net cashflow
- $32
Break-even live
Sensitivity live
| Price | -10% $128 | -5% $80 | +0% $32 | +5% $-16 | +10% $-64 |
|---|---|---|---|---|---|
| Rent | -10% $-86 | -5% $-27 | +0% $32 | +5% $91 | +10% $150 |
| Rate | -1.0pp $118 | -0.5pp $75 | base $32 | +0.5pp $-12 | +1.0pp $-57 |
UW: 25.0% down · 7.5% · 30yr · 1.5% tax · 5.0% vac · 8.0% maint · 8.0% mgmt
Financing live
Cash to close
- Down payment
- $42,475
- Closing costs
- $5,097
- Reserves months
- —
- Total cash needed
- —
Loan-product check · same deal, 3 products live
Conventional
25% down · 7.5% · 30yr
- Down + closing
- —
- Monthly P&I
- —
- Monthly cashflow
- —
- DSCR
- —
- Eligible?
- —
Personal DTI + credit; lowest rate.
DSCR
20% down · 8.5% · 30yr
- Down + closing
- —
- Monthly P&I
- —
- Monthly cashflow
- —
- DSCR
- —
- Eligible?
- —
No personal income docs; deal must DSCR.
Hard money
10% down · 12.0% · 12mo
- Down + closing
- —
- Monthly P&I
- —
- Monthly cashflow
- —
- DSCR
- —
- Eligible?
- —
Short-term bridge; refi at stabilization.
Rent comps 40 comps
| Address | Beds | Baths | Sqft | Rent | $/sqft | DOM | Units | Dist |
|---|---|---|---|---|---|---|---|---|
| 1996 Hope St New Orleans, LA | 3.0 | 1.0 | 910 | $1,550 | $1.70 | 5d | 1 | 0.09mi |
| 2514 Saint Anthony St New Orleans, LA | 2.0 | 1.0 | 850 | $1,500 | $1.76 | 5d | 1 | 0.19mi |
| 2514 Saint Anthony St New Orleans, LA | 2.0 | 1.0 | 850 | $1,500 | $1.76 | 5d | 1 | 0.19mi |
| 2305 A P Tureaud Ave Unit 2307 A P Tureaud New Orleans, LA | 3.0 | 2.0 | 700 | $2,112 | $3.02 | 25d | 1 | 0.19mi |
| 2310 George Nick Connor Dr New Orleans, LA | 3.0 | 2.0 | 1050 | $1,600 | $1.52 | 25d | 1 | 0.19mi |
| 2510 Saint Anthony St New Orleans, LA | 2.0 | 1.0 | 850 | $1,500 | $1.76 | 5d | 1 | 0.19mi |
| 2510 Saint Anthony St New Orleans, LA | 2.0 | 1.0 | 850 | $1,500 | $1.76 | 5d | 1 | 0.19mi |
| 2432 Saint Anthony St New Orleans, LA | 2.0 | 1.0 | 768 | $1,300 | $1.69 | 16d | 1 | 0.20mi |
| 2434 Saint Anthony St New Orleans, LA | 2.0 | 1.0 | 768 | $1,300 | $1.69 | 16d | 1 | 0.20mi |
| 1922 Industry St Unit B New Orleans, LA | 2.0 | 2.0 | 963 | $1,325 | $1.38 | 4d | 1 | 0.23mi |
| 1739 Duels St New Orleans, LA | 2.0 | 1.0 | 768 | $1,450 | $1.89 | 25d | 1 | 0.24mi |
| 2817 Annette St New Orleans, LA | 3.0 | 1.0 | 1100 | $1,350 | $1.23 | 25d | 1 | 0.24mi |
| 1737 Duels St New Orleans, LA | 2.0 | 1.0 | 768 | $1,450 | $1.89 | 25d | 1 | 0.24mi |
| 3230 Pauger St New Orleans, LA | 1.0 | 1.0 | 600 | $1,200 | $2.00 | 25d | 1 | 0.25mi |
| 1765 N Tonti St Unit 1767 New Orleans, LA | 1.0 | 1.0 | 693 | $1,295 | $1.87 | 4d | 1 | 0.26mi |
| 3110 Pauger St New Orleans, LA | 2.0 | 2.0 | 992 | $1,300 | $1.31 | 25d | 1 | 0.27mi |
| 2130 N Broad St Unit 1A New Orleans, LA | 2.0 | 1.0 | 925 | $1,500 | $1.62 | 25d | 1 | 0.27mi |
| 2311 Saint Anthony St Unit 1A New Orleans, LA | 2.0 | 1.0 | 1100 | $1,450 | $1.32 | 25d | 1 | 0.28mi |
| 2311 Saint Anthony St Unit 1B New Orleans, LA | 2.0 | 1.0 | 750 | $1,350 | $1.80 | 25d | 1 | 0.28mi |
| 2239 Saint Anthony St New Orleans, LA | 2.0 | 1.0 | 900 | $1,100 | $1.22 | 25d | 1 | 0.28mi |
| 1776 N Miro St New Orleans, LA | 2.0 | 1.0 | 700 | $1,100 | $1.57 | 25d | 1 | 0.29mi |
| 2109 A P Tureaud Ave New Orleans, LA | 2.0 | 1.0 | 936 | $1,450 | $1.55 | 16d | 1 | 0.32mi |
| 2741 Bruxelles St New Orleans, LA | 2.0 | 1.0 | 732 | $1,500 | $2.05 | 5d | 1 | 0.37mi |
| 2741 Bruxelles St New Orleans, LA | 2.0 | 1.0 | 732 | $1,500 | $2.05 | 5d | 1 | 0.37mi |
| 1818 Paul Morphy St Unit B New Orleans, LA | 3.0 | 2.0 | 1065 | $1,800 | $1.69 | 25d | 1 | 0.42mi |
| 2632 Oreilly St New Orleans, LA | 3.0 | 1.5 | 950 | $1,450 | $1.53 | 25d | 1 | 0.44mi |
| 2817 Paris Ave New Orleans, LA | 3.0 | 1.0 | 1018 | $1,700 | $1.67 | 22d | 1 | 0.45mi |
| 2512 Elysian Fields Ave Unit C New Orleans, LA | 2.0 | 1.0 | 800 | $1,300 | $1.62 | 5d | 1 | 0.45mi |
| 2512 Elysian Fields Ave Unit C New Orleans, LA | 2.0 | 1.0 | 800 | $1,300 | $1.62 | 5d | 1 | 0.45mi |
| 2512 Elysian Fields Ave Unit 1 New Orleans, LA | 2.0 | 1.0 | 879 | $1,400 | $1.59 | 19d | 1 | 0.45mi |
| 2910 Bruxelles St New Orleans, LA | 3.0 | 2.0 | 1074 | $1,600 | $1.49 | 5d | 1 | 0.46mi |
| 2525 D'Abadie St Unit 2525 New Orleans, LA | 2.0 | 1.0 | 1000 | $1,500 | $1.50 | 22d | 1 | 0.46mi |
| 2525 D'Abadie St New Orleans, LA | 2.0 | 1.0 | 960 | $1,400 | $1.46 | 22d | 1 | 0.46mi |
| 1636 N Miro St New Orleans, LA | 1.0 | 1.0 | 600 | $1,295 | $2.16 | 5d | 1 | 0.50mi |
| 1636 N Miro St New Orleans, LA | 1.0 | 1.0 | 600 | $1,295 | $2.16 | 16d | 1 | 0.50mi |
| 1634 N Rocheblave St New Orleans, LA | 2.0 | 1.0 | 900 | $1,400 | $1.56 | 25d | 1 | 0.50mi |
| 2025 N Johnson St New Orleans, LA | 3.0 | 1.0 | 650 | $1,350 | $2.08 | 25d | 1 | 0.50mi |
| 1868 Benefit St New Orleans, LA | 2.0 | 1.0 | 700 | $1,100 | $1.57 | 25d | 1 | 0.50mi |
| 3023 Bruxelles St New Orleans, LA | 3.0 | 1.0 | 960 | $2,200 | $2.29 | 16d | 1 | 0.50mi |
| 1811 New Orleans St New Orleans, LA | 2.0 | 2.0 | 900 | $1,700 | $1.89 | 5d | 1 | 0.52mi |
Listing history 22 events
-
2026-06-21days on market $169,900 Active 34 DOM
-
2026-06-18days on market $169,900 Active 31 DOM
-
2026-06-17days on market $169,900 Active 30 DOM
-
2026-06-16days on market $169,900 Active 29 DOM
-
2026-06-15days on market $169,900 Active 28 DOM
-
2026-06-13days on market $169,900 Active 26 DOM
-
2026-06-10days on market $169,900 Active 23 DOM
-
2026-06-09days on market $169,900 Active 22 DOM
-
2026-06-08days on market $169,900 Active 21 DOM
-
2026-06-07days on market $169,900 Active 20 DOM
-
2026-06-05days on market $169,900 Active 17 DOM
-
2026-06-03days on market $169,900 Active 16 DOM
-
2026-06-02days on market $169,900 Active 15 DOM
-
2026-06-01days on market $169,900 Active 14 DOM
-
2026-05-31days on market $169,900 Active 13 DOM
-
2026-05-16$169,900 Active
Show marketing remark (849 chars)
Welcome home to 1983 Law Street! This 4-bedroom, 2-bathroom residence offers 1,400 square feet of comfortable, carpet-free living -- ideal for allergy-sensitive households. Enjoy relaxing mornings on the charming front porch, and come home to the convenience of off-street parking. Inside, you'll find a functional layout with a versatile fourth bedroom perfect as a guest room, home office, or den. Situated in the heart of New Orleans' vibrant 7th Ward, this home sits directly across from a neighborhood park -- your own green space just steps from the front door. Located in Flood Zone X, no flood insurance is required, offering buyers valuable peace of mind and savings. With easy access to local dining, culture, and the energy that makes New Orleans one of a kind, 1983 Law Street is the perfect place to put down roots. Don't miss this one!
-
2026-05-16$169,900 Active 849-char remark
Show marketing remark (849 chars)
Welcome home to 1983 Law Street! This 4-bedroom, 2-bathroom residence offers 1,400 square feet of comfortable, carpet-free living -- ideal for allergy-sensitive households. Enjoy relaxing mornings on the charming front porch, and come home to the convenience of off-street parking. Inside, you'll find a functional layout with a versatile fourth bedroom perfect as a guest room, home office, or den. Situated in the heart of New Orleans' vibrant 7th Ward, this home sits directly across from a neighborhood park -- your own green space just steps from the front door. Located in Flood Zone X, no flood insurance is required, offering buyers valuable peace of mind and savings. With easy access to local dining, culture, and the energy that makes New Orleans one of a kind, 1983 Law Street is the perfect place to put down roots. Don't miss this one!
-
2026-02-06soldstatus $10,000
-
2026-02-06soldstatus $10,000
-
2026-02-06soldstatus $10,000
-
2025-03-26$249,000 Active
-
1982-12-10soldstatus $30,000
ⓘ Source: listings_history table (triggers on properties + properties_extension) + one-shot
backfill from property_details.listing_events for pre-trigger history.
Tax reassessment forecast LA · Resets to sale price
- Current annual tax
- $1,396 · $116/mo
- Projected year-2 tax
- $1,396 · $116/mo
- Expected delta
- $0/yr ($0/mo · 0.0%)
ⓘ Screening estimate from a state-policy table — verify with the county assessor before closing.
Climate risk First Street
- Flood 8/10 Severe FEMA zone X (shaded) · 77% chance over 30 yrs
- Wildfire 1/10 Low
- Heat 10/10 Extreme 7 d/yr ≥108°F today · 21 d/yr by 30 yrs out
- Wind 10/10 Extreme 99% chance of damaging wind over 30 yrs
- Air quality 4/10 Moderate 4 unhealthy d/yr today · 4 by 30 yrs out
Nearby sold comps map
Loading sold comps map…
Walkable amenities ~0.75 mi
Loading nearby amenities…
Taxation est. · year 1
- Rental income
- $17,872
- − Mortgage interest
- −$9,517
- − Property taxes
- −$1,396
- − Insurance
- −$1,647
- − Repairs & maintenance
- −$1,430
- − Management
- −$1,430
- − Depreciation
- −$4,943
- Taxable loss
- −$2,490
- Est. tax savings @ 24.0%
- +$598
- After-tax cash flow
- $982/yr
For passive investors: Depreciation is non-cash, so a rental often shows a tax loss while cash-flowing — sheltering income. Rental losses are passive: they offset passive income freely, and up to $25,000/yr can offset ordinary (W-2) income if you actively participate and your MAGI is under $100k (phasing out to $0 by $150k); unused losses carry forward. On sale, claimed depreciation is recaptured at up to 25%, and gains may owe capital-gains tax (a 1031 exchange can defer both). Figures are a year-1 estimate at your 24.0% rate — not tax advice; consult a CPA.
Schools (NCES district)
- District
- Orleans Parish
- NCES district ID
- 2201170
- Math proficiency
- 11% ▼ -52.00%
- Reading proficiency
- 27% ▼ -46.00%
- Median HH income
- $37,011
- Composite
- 15.78/100
- National rank
- #9271
- State rank
- #69 of 98 in LA
Livability — New Orleans
- Score
- 81/100
- State rank
- #3
- US rank
- #1383
Category grades
Schools grade is shown separately in the Schools card above.
Census & demographics
- Census place
- New Orleans, LA
- County
- Orleans Parish · 338,817 people
- City population
- 338,817
- Metro
- New Orleans-Metairie, LA
- Population (ZIP)
- 37,253
- Household income
- $53,143
- Rent vs Own
- Severe rent burden
- 3381.0
Population outlook (Orleans County) Hauer SSP2
- Today (2025)
- 513,025 people
- By 2030
- 575,781 · +12.2%
- By 2040
- 700,174 · +36.5%
- By 2050
- 826,541 · +61.1%
- By 2075
- 1,123,374 · +119.0%
- By 2100
- 1,355,609 · +164.2%
Race, ethnicity, and origin ACS 2023
- Neighborhood character
- Diverse neighborhood (Simpson 0.64)
- Race & ethnicity
- Black 44% White 40% Two or more races 10% Hispanic / Latino 9% Asian 1%
- Hispanic origin (detail)
- Mexican 2%
- Common ancestry
- Lithuanian 8% Slovak 2% Romanian 1%
- Foreign-born
- 6% · Canada, Jamaica
- Languages at home
- 91% English-only · Spanish 6% French/Haitian/Cajun 1% Other Indo-European 0%
Political lean MEDSL · Orleans
- 2024 margin
- Solid D (+67.0) · D 82.2% · R 15.2% · Other 2.7%
- 2008→2024 swing
- +6.7pp toward D · 2008: 60.3pp · 2024: 67.0pp
- All cycles
- 2024: D+67.0 2020: D+68.2 2016: D+66.2 2012: D+62.5 2008: D+60.3
Not yet ingested
- Civics
- —
Market trends
- HPI YoY
- ▼ -135.38%
- Current HPI
- 253.1929
- Rent YoY
- ▼ -0.20%
- Metro
- New Orleans-Metairie, LA
- State GDP YoY
- ▲ 3.29%
- F500 in state
- 10
Industry mix (Fortune 500 HQ in LA)
| Industry | F500 HQs | Revenue |
|---|---|---|
| Telecommunications | 2 | $23B |
|
||
| Utilities | 1 | $12B |
|
||
| Wholesale / Distribution | 1 | $5B |
|
||
| Advertising | 1 | $2B |
|
||
Price history
+466.3% since first listed7 events — show timeline
- 2026-05-16 Listed $169,900 AcadianaMLS
- 2026-05-16 Listed $169,900 GSREIN
- 2026-02-06 Sold (Public Records) $10,000 Public Records
- 2026-02-06 Sold (Public Records) $10,000 Public Records
- 2026-02-06 Sold (Public Records) $10,000 Public Records
- 2025-03-26 Listed $249,000 AcadianaMLS
- 1982-12-10 Sold (Public Records) $30,000 Public Records
Property tax history
+20.3%/yrLatest (2026): $1,396 · +1.1% YoY. Source: county tax records.
Cash-flow waterfall
monthlySold comps — $/sqft
last 12 mo · ≤1 miLoading sold comps…