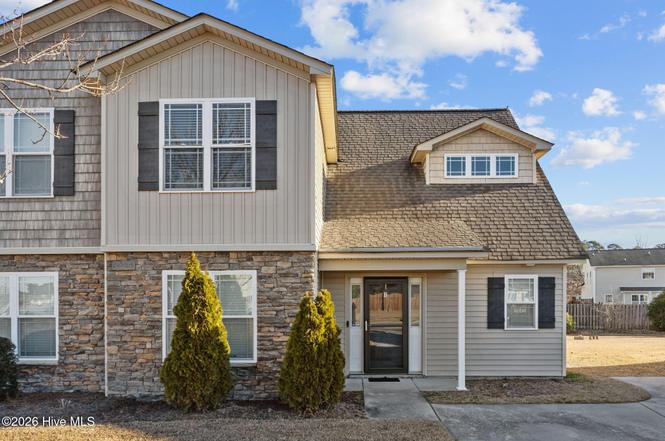
2204 Sweet Bay Dr Unit B · Greenville, NC
Flood risk 1/10 · Minimal
- FEMA flood zone
- X (unshaded)
- Chance of flooding over 30 yrs
- 0.0%
- Est. flood insurance / yr
- $507 – $1,088
Fire risk 4/10 · Minor
- Est. fire insurance / yr
- $906 – $1,684
Heat risk 8/10 · Major
- Hot days now (above 106°F)
- 7 days/yr
- Hot days in 30 yrs
- 17 days/yr
Wind risk 8/10 · Major
- Chance of severe wind over 30 yrs
- 80.0%
Air-quality risk 3/10 · Minor
- Unhealthy air days now
- 3 days/yr
- Unhealthy air days in 30 yrs
- 3 days/yr
Risk factors via First Street. Map © Google.
Why this score? — see what drove the D+ grade
The composite is a weighted blend of 9 inputs, each scored 0–100. Each bar is that input's sub-score; the figure is the points it added to the 100-point composite (weight × sub-score).
- Cash flow +17.4/30.0
- ARV discount +7.5/15.0
- DSCR +5.4/10.0
- 1% rule +4.6/10.0
- Rent growth +3.9/5.0
- Livability +3.9/5.0
- Schools +3.6/10.0
- Condition / age +2.5/5.0
- Appreciation +0.0/10.0
$210,000
🖨 Deal sheet (PDF) 📄 Offer letter ✓ Due diligence
Listing remarks
In a prime location near the medical facilities, this beautiful 3-bedroom, 2.5-bathroom duplex boasts a spacious open floor plan perfect for hosting. The covered patio in the backyard offers an ideal setting to unwind and enjoy the outdoors.
Key facts
- $42 HOA
- Built 2009
- Listed 101 days
Neighborhood map
What this means for you Summary
Snapshot
- This is a 3-bed/2.5-bath other listed at $210k.
Deal economics
- At list price, monthly cash flow is $157 ($2k/yr) — positive.
- The deal already cash-flows at list — no discount required.
- To meet the 1% rule (rent ≥ 1% of price), the offer needs to be $201k (4.4% below list).
- Recommended offer: $191k (9.0% below list) — sets the bar for market timing.
- Cap rate 7.2% vs local median 3.8% in Greenville — top-decile yield for the area; either an underpriced asset or a hidden risk that comps aren't pricing in. Stress-test before assuming the spread holds.
Location & tenants
- Location reads 77/100 on livability (#30 in NC, #2,977 nationally) — a middle-class / working-renter tenant base. Strengths: commute A+, cost of living A+, health & safety A+; Watch: crime F, employment F.
- Pitt County Schools (rural): math 41% / reading 44% proficiency, ranked #100 of 178 in NC (top 56%) — families likely to look elsewhere, expect single-tenant / working-renter base with shorter leases.
- Zoned schools: Lakeforest Elementary (math 22% / reading 30%, grade F, #1,085 of 1,410 statewide, top 77%, 804 students, 98% FRL); Farmville Middle (math 31% / reading 35%, grade F, #305 of 475 statewide, top 65%, 611 students, 100% FRL); Farmville Central High (math 42% / reading 47%, grade F, #352 of 535 statewide, top 68%, 789 students, 99% FRL) — zoned schools average 99% FRL vs 56% district-wide (43 pts higher); higher-poverty schools than district average — tighter screening recommended.
- Market conditions: Rents rising fast (+5.4%/yr); 356 active listings in the ZIP; 13 comparable units currently listed for rent nearby; rentals at typical pace (median 23d on market — plan ~3-4 weeks tenant-placement turnaround); 1,300 units permitted in Pitt County in 2024 (204 in 5+ unit buildings).
- At $2,007/mo this rent would consume 49% of the median local household income ($49k/yr) (locally 3319% of renters already pay >50% of income on rent) — very limited rent-growth headroom before tenants either downsize or default.
Forward outlook
- Local home prices are declining (-3.0%/yr); year-one equity from $1k of loan paydown is wiped out by about $6k of value loss. Plan a longer hold.
- Pitt County population projected at +22% by 2050 — long-run rental-demand tailwind backs the buy-and-hold thesis.
Negotiation context
- It's been on market 101 days — a 9% lower offer ($191k) is reasonable based on typical stale-listing flexibility.
Risks & watch-outs
- Climate carrying-cost: severe wind risk, 80% chance of damaging wind over 30y; extreme-heat days projected 7→17/yr by 2055 (HVAC capex compounding) — expect insurance premiums to compound above CPI over the hold.
Questions for the listing agent
- It's been on market 101 days. Have you received any prior offers? Is the seller open to a 9% concession, seller financing, or rate buy-down credit?
- What does the HOA fee cover, when was the last increase, and are there any pending special assessments or reserve-fund shortfalls?
- Why hasn't it sold? Are there any deal-killer items the seller is aware of (foundation, flood, title, zoning, code violations)?
- Is there a deadline driving the sale (1031 exchange, divorce, estate, relocation)? That informs how much negotiation room exists.
- Crime grade is F in this area — have there been break-ins, vandalism, or insurance claims at this property in the last 3 years? What carrier currently insures it and at what premium?
- The area grade is low — what's the realistic commute time and amenity access for the typical tenant pool here? Any planned neighborhood developments (good or bad) we should know about?
- What's the average days-on-market for RENTAL listings here right now (not sales)? A rising rental-DOM trend means longer vacancies and softer asking-rent achievability than the comps imply.
- What's the recent tenant-quality profile in this submarket — average credit score on applications, eviction rate, late-payment / NSF rate, and stable-employment percentage? A property-management company in the area should have these aggregated.
- How much new for-sale + rental construction is in the pipeline within 1–3 miles? Heavy new supply typically softens prices + rents 12–24 months out; constrained supply supports both.
Investment metrics
- 1% rule
- 0.96% ✗
- Cap rate
- 7.19%
- Cash-on-cash
- 3.19%
- DSCR
- 1.14
- GRM
- 8.7
CMA / ARV
No comps found within radius.
Projected returns pro-forma
-3.0% appreciation · 5.44% rent growth · sell at horizon
- IRR
- -8.6%
- Equity multiple
- 0.68×
- Total profit
- $-18,995
- Equity at exit
- $31,312
- IRR
- 3.8%
- Equity multiple
- 1.31×
- Total profit
- $18,140
- Equity at exit
- $18,157
Cash invested: $58,800 (down + closing). Projections, not guarantees.
Landlord ↔ Tenant lean methodology
- Overall (STATE)
- 85 Strongly Landlord-Friendly
- State North Carolina
- 85 Strongly Landlord-Friendly · R+3
- County
- — inherits STATE
- City
- — inherits STATE
ZIP-level market 27834
- Rents YoY
- 5.4%
- Active inventory
- 356
- Price-to-rent
- 8.7×
Monthly cashflow live
- Estimated rent
- $2,007 high interval (Pro) →
- Mortgage (P&I)
- −$1,101
- Tax from tax record
- −$198 /mo · $2,381/yr
- Insurance
- −$88
- HOA
- −$42
- Vacancy / Maint / Mgmt
- −$422
- Net cashflow
- $157
Break-even live
Sensitivity live
| Price | -10% $275 | -5% $216 | +0% $157 | +5% $97 | +10% $38 |
|---|---|---|---|---|---|
| Rent | -10% $-2 | -5% $77 | +0% $157 | +5% $236 | +10% $315 |
| Rate | -1.0pp $262 | -0.5pp $210 | base $157 | +0.5pp $102 | +1.0pp $47 |
UW: 25.0% down · 7.5% · 30yr · 1.5% tax · 5.0% vac · 8.0% maint · 8.0% mgmt
Financing live
Cash to close
- Down payment
- $52,500
- Closing costs
- $6,300
- Reserves months
- —
- Total cash needed
- —
Loan-product check · same deal, 3 products live
Conventional
25% down · 7.5% · 30yr
- Down + closing
- —
- Monthly P&I
- —
- Monthly cashflow
- —
- DSCR
- —
- Eligible?
- —
Personal DTI + credit; lowest rate.
DSCR
20% down · 8.5% · 30yr
- Down + closing
- —
- Monthly P&I
- —
- Monthly cashflow
- —
- DSCR
- —
- Eligible?
- —
No personal income docs; deal must DSCR.
Hard money
10% down · 12.0% · 12mo
- Down + closing
- —
- Monthly P&I
- —
- Monthly cashflow
- —
- DSCR
- —
- Eligible?
- —
Short-term bridge; refi at stabilization.
Rent comps 13 comps
| Address | Beds | Baths | Sqft | Rent | $/sqft | DOM | Units | Dist |
|---|---|---|---|---|---|---|---|---|
| 4129 Laurel Ridge Dr Unit F Greenville, NC | 2.0 | 3.5 | 1050 | $2,500 | $2.38 | 22d | 1 | 0.09mi |
| 4129 Laurel Ridge Dr Greenville, NC | 2.0 | 4.0 | 1050 | $2,500 | $2.38 | 22d | 1 | 0.09mi |
| 4511 Laurel Ridge Dr Unit B Greenville, NC | 3.0 | 2.5 | 1619 | $1,950 | $1.20 | 22d | 1 | 0.10mi |
| 1005 Allen Ridge Dr Greenville, NC | 2.0–3.0 | 2.0 | 1134 | $1,999 | $1.76 | 15d | 13 | 0.23mi |
| 974 Ellery Dr Greenville, NC | 3.0 | 2.0 | 1901 | $1,995 | $1.05 | 22d | 1 | 0.27mi |
| 2221 Brookville Dr Unit B Greenville, NC | 3.0 | 2.0 | 1508 | $1,700 | $1.13 | 22d | 1 | 0.32mi |
| 2308 Sweet Bay Dr Unit B Greenville, NC | 3.0 | 2.0 | 1446 | $1,925 | $1.33 | 22d | 1 | 0.41mi |
| 2500 Brookville Dr Greenville, NC | 3.0 | 2.0 | 1423 | $1,800 | $1.26 | 15d | 1 | 0.55mi |
| 1632 Cambria Dr Unit B Greenville, NC | 3.0 | 3.0 | 1919 | $2,000 | $1.04 | 22d | 1 | 0.55mi |
| 1951 Cambria Dr Unit B Greenville, NC | 3.0 | 3.0 | 1552 | $1,800 | $1.16 | 22d | 1 | 0.74mi |
| 1548 Manning Forest Dr Unit M7 Greenville, NC | 2.0 | 1.5 | 1094 | $1,300 | $1.19 | 15d | 1 | 0.81mi |
| 828 Sarah Rebecca Dr Greenville, NC | 3.0 | 2.5 | 1636 | $2,000 | $1.22 | 22d | 1 | 1.19mi |
| 3709 Nantucket Rd Unit A Greenville, NC | 3.0 | 2.0 | 1427 | $1,700 | $1.19 | 15d | 1 | 1.45mi |
HOA detail
- Monthly dues
- $42 · $504/yr
Listing history 11 events
-
2026-06-08status $210,000 Pending 101 DOM
-
2026-06-07days on market $210,000 Active 101 DOM
-
2026-06-05days on market $210,000 Active 98 DOM
-
2026-06-03days on market $210,000 Active 97 DOM
-
2026-06-02days on market $210,000 Active 96 DOM
-
2026-06-01days on market $210,000 Active 95 DOM
-
2026-05-31days on market $210,000 Active 94 DOM
-
2026-05-30days on market $210,000 Active 93 DOM
-
2026-04-14status Pending
-
2026-01-28price $220,000
-
2026-01-14$230,000 Active
ⓘ Source: listings_history table (triggers on properties + properties_extension) + one-shot
backfill from property_details.listing_events for pre-trigger history.
Tax reassessment forecast NC · Resets to sale price
- Current annual tax
- $2,381 · $198/mo
- Projected year-2 tax
- $2,381 · $198/mo
- Expected delta
- $0/yr ($0/mo · 0.0%)
ⓘ Screening estimate from a state-policy table — verify with the county assessor before closing.
Climate risk First Street
- Flood 1/10 Low FEMA zone X (unshaded) · 0% chance over 30 yrs
- Wildfire 4/10 Moderate
- Heat 8/10 Severe 7 d/yr ≥106°F today · 17 d/yr by 30 yrs out
- Wind 8/10 Severe 80% chance of damaging wind over 30 yrs
- Air quality 3/10 Moderate 3 unhealthy d/yr today · 3 by 30 yrs out
Nearby sold comps map
Loading sold comps map…
Walkable amenities ~0.75 mi
Loading nearby amenities…
Taxation est. · year 1
- Rental income
- $24,086
- − Mortgage interest
- −$11,763
- − Property taxes
- −$2,381
- − Insurance
- −$1,050
- − Repairs & maintenance
- −$1,927
- − Management
- −$1,927
- − HOA
- −$504
- − Depreciation
- −$6,109
- Taxable loss
- −$1,574
- Est. tax savings @ 24.0%
- +$378
- After-tax cash flow
- $2,256/yr
For passive investors: Depreciation is non-cash, so a rental often shows a tax loss while cash-flowing — sheltering income. Rental losses are passive: they offset passive income freely, and up to $25,000/yr can offset ordinary (W-2) income if you actively participate and your MAGI is under $100k (phasing out to $0 by $150k); unused losses carry forward. On sale, claimed depreciation is recaptured at up to 25%, and gains may owe capital-gains tax (a 1031 exchange can defer both). Figures are a year-1 estimate at your 24.0% rate — not tax advice; consult a CPA.
Schools (NCES district)
- District
- Pitt County Schools
- NCES district ID
- 3700012
- Math proficiency
- 41% ▬ 0.00%
- Reading proficiency
- 44% ▲ 2.00%
- Median HH income
- $40,631
- Composite
- 35.67/100
- National rank
- #4877
- State rank
- #100 of 178 in NC
Livability — Greenville
- Score
- 77/100
- State rank
- #30
- US rank
- #2977
Category grades
Schools grade is shown separately in the Schools card above.
Census & demographics
- Census place
- Greenville, NC
- County
- Pitt County · 142,592 people
- City population
- 115,121
- Metro
- Greenville, NC
- Population (ZIP)
- 56,347
- Household income
- $48,935
- Rent vs Own
- Severe rent burden
- 3319.0
Population outlook (Pitt County) Hauer SSP2
- Today (2025)
- 194,585 people
- By 2030
- 203,756 · +4.7%
- By 2040
- 220,807 · +13.5%
- By 2050
- 236,614 · +21.6%
- By 2075
- 275,940 · +41.8%
- By 2100
- 300,058 · +54.2%
Race, ethnicity, and origin ACS 2023
- Neighborhood character
- Diverse neighborhood (Simpson 0.59)
- Race & ethnicity
- Black 54% White 33% Hispanic / Latino 8% Two or more races 3% Asian 2%
- Hispanic origin (detail)
- Mexican 7%
- Common ancestry
- Lithuanian 1% Slovak 1% Romanian 1%
- Foreign-born
- 7% · Canada, China
- Languages at home
- 91% English-only · Spanish 6% Other Asian/Pacific 1%
Political lean MEDSL · Pitt
- 2024 margin
- Lean D (+6.0) · D 52.5% · R 46.5% · Other 1.1%
- 2008→2024 swing
- -2.8pp toward R · 2008: 8.8pp · 2024: 6.0pp
- All cycles
- 2024: D+6.0 2020: D+9.4 2016: D+7.4 2012: D+6.7 2008: D+8.8
Not yet ingested
- Civics
- —
Market trends
- HPI YoY
- ▼ -187.99%
- Current HPI
- 190.6869
- Rent YoY
- ▲ 5.44%
- Metro
- Greenville, NC
- State GDP YoY
- ▲ 3.28%
- F500 in state
- 26
Industry mix (Fortune 500 HQ in NC)
| Industry | F500 HQs | Revenue |
|---|---|---|
| Financial Services | 2 | $213B |
|
||
| Retail | 2 | $95B |
|
||
| Industrial Conglomerate | 1 | $38B |
|
||
| Metals / Steel | 1 | $35B |
|
||
| Utilities | 1 | $30B |
|
||
| Industrial Machinery | 1 | $19B |
|
||
Price history
-4.3% since first listed3 events — show timeline
- 2026-04-14 Pending — Hive MLS
- 2026-01-28 Price Changed $220,000 Hive MLS
- 2026-01-14 Listed $230,000 Hive MLS
Property tax history
+5.2%/yrLatest (2025): $2,381 · +0.5% YoY. Source: county tax records.
Cash-flow waterfall
monthlySold comps — $/sqft
last 12 mo · ≤1 miLoading sold comps…