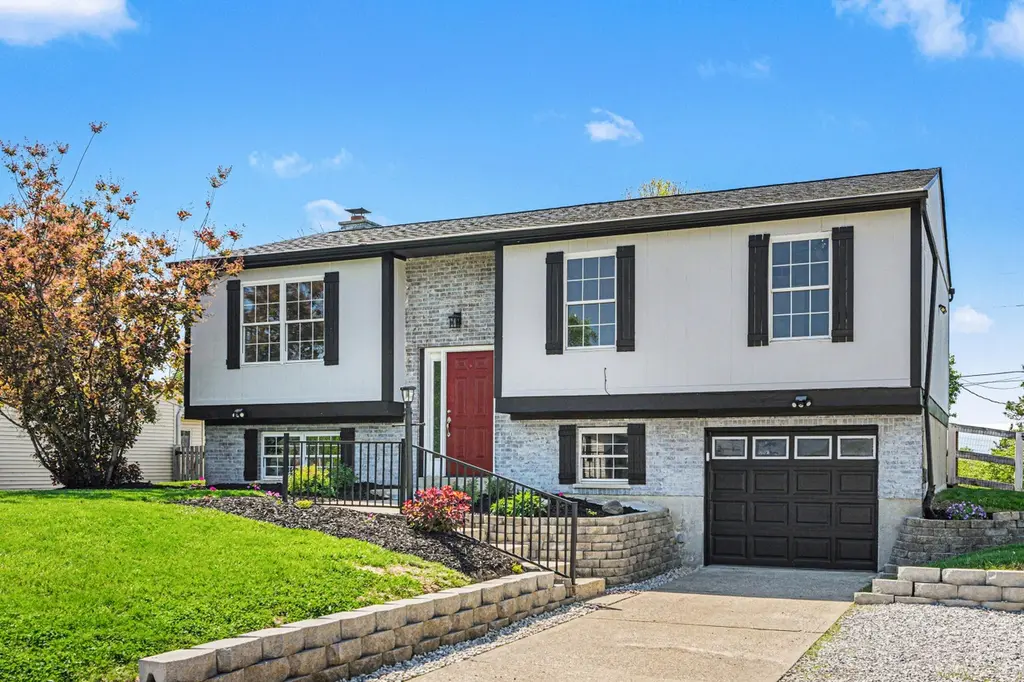
6351 Briargate Dr · Burlington, KY
Flood risk 1/10 · Minimal
- FEMA flood zone
- X (unshaded)
- Chance of flooding over 30 yrs
- 0.0%
- Est. flood insurance / yr
- $473 – $860
Fire risk 1/10 · Minimal
- Est. fire insurance / yr
- $839 – $1,559
Heat risk 4/10 · Minor
- Hot days now (above 101°F)
- 7 days/yr
- Hot days in 30 yrs
- 19 days/yr
Wind risk 2/10 · Minimal
- Chance of severe wind over 30 yrs
- 2.0%
Air-quality risk 2/10 · Minimal
- Unhealthy air days now
- 1 days/yr
- Unhealthy air days in 30 yrs
- 3 days/yr
Risk factors via First Street. Map © Google.
Why this score? — see what drove the F grade
The composite is a weighted blend of 9 inputs, each scored 0–100. Each bar is that input's sub-score; the figure is the points it added to the 100-point composite (weight × sub-score).
- Cash flow +9.4/30.0
- Schools +4.1/10.0
- Livability +3.9/5.0
- DSCR +2.6/10.0
- Rent growth +2.5/5.0
- Condition / age +2.5/5.0
- 1% rule +2.3/10.0
- ARV discount +0.0/15.0
- Appreciation +0.0/10.0
$315,000
🖨 Deal sheet (PDF) 📄 Offer letter ✓ Due diligence
Listing remarks MLS
Sold when submitted - Boone Co Master Commissioner Sale
Key facts
- Stone fire pit
- New cabinets
- Ss appliances
Tags
Property features AI
Exterior
- Parking: Driveway; Detached garage with garage door opener (1-car); Off-street parking; On-street parking; Garage faces front
- Utilities: Public water; Public sewer; Cable available
- Home design: Single family residence; Bi-level
- Construction: Built in 1978; Vertical siding and brick exterior; Shingle roof; Poured concrete foundation
- Exterior features: Covered patio/porch; Deck; Fire pit; Wood fencing; Level lot; Shed(s); Partially wooded yard; Has view
Interior
- Kitchen: Stainless steel appliances; Electric range; Dishwasher; Microwave; Garbage disposal
- Bedrooms: Primary Bedroom (14 x 12); Bedroom 2 (10 x 12); Bedroom 3 (10 x 10); Bedroom 4 (12 x 11); Bonus Room (10 x 11)
- Bathrooms: 2 full bathrooms
- Heating & cooling: Heat pump; Forced air; Electric heating; Central air
- Interior features: Pantry; Granite counters; Crown molding; Chandelier; Ceiling fan(s); Central vacuum; Multi-panel doors; Recessed lighting; Wood-burning fireplace; Partial basement
- Laundry & utility: Laundry room on lower level
Neighborhood map
What this means for you Summary
Snapshot
- This is a 4-bed/1.5-bath single-family listed at $315k.
Deal economics
- At list price, monthly cash flow is $-225 ($-3k/yr) — negative.
- To cash-flow at today's rent, offer at most $275k (12.6% below list).
- To meet the 1% rule (rent ≥ 1% of price), the offer needs to be $230k (26.9% below list).
- Recommended offer: $230k (26.9% below list) — sets the bar for 1% rule.
- Cap rate 5.4% vs local median 4.2% in Burlington — meaningfully above typical; check what's discounted (condition, days-on-market, listing class) to confirm the premium yield is real.
Location & tenants
- Location reads 77/100 on livability (#83 in KY, #2,792 nationally) — a middle-class / working-renter tenant base. Strengths: crime A+, employment A+, cost of living A+; Watch: health & safety C-, amenities F, commute F.
- Boone County (suburban): math 43% / reading 49% proficiency, ranked #12 of 165 in KY (top 7%) — families likely to look elsewhere, expect single-tenant / working-renter base with shorter leases.
- Zoned schools: Stephens Elementary School (math 35% / reading 40%, grade F, #251 of 676 statewide, top 37%, 571 students, 48% FRL); Camp Ernst Middle School (math 28% / reading 43%, grade F, #94 of 217 statewide, top 44%, 723 students, 48% FRL); Randall K. Cooper High School (math 46% / reading 50%, grade D, #17 of 254 statewide, top 6%, 1,462 students, 30% FRL).
- Market conditions: 161 active listings in the ZIP; 1 comparable units currently listed for rent nearby; high-income renter base; 1,430 units permitted in Boone County in 2024 (928 in 5+ unit buildings).
Forward outlook
- Local home prices are declining (-3.0%/yr); year-one equity from $2k of loan paydown is wiped out by about $9k of value loss. Plan a longer hold.
- Boone County population projected at +24% by 2050 — long-run rental-demand tailwind backs the buy-and-hold thesis.
Negotiation context
- Only 8 days on market — expect competitive offers; lowballing is unlikely to land.
- 11 sale attempts since 31y ago with the ask held roughly flat each time — persistent listings suggest the price (not the market) is what's stuck; bring a comps-based counter.
- Current owner paid $228k; 38% above their basis — modest negotiation headroom, anchor on the comps not their cost.
Questions for the listing agent
- What do current leases actually rent for vs. the listed asking? Can we see a recent rent roll and the last 12 months of T-12 income?
- Built in 1978 — when were the roof, HVAC, electrical panel, plumbing, and water heater last replaced?
- Is there a deadline driving the sale (1031 exchange, divorce, estate, relocation)? That informs how much negotiation room exists.
- The area grade is low — what's the realistic commute time and amenity access for the typical tenant pool here? Any planned neighborhood developments (good or bad) we should know about?
- What's the average days-on-market for RENTAL listings here right now (not sales)? A rising rental-DOM trend means longer vacancies and softer asking-rent achievability than the comps imply.
- What's the recent tenant-quality profile in this submarket — average credit score on applications, eviction rate, late-payment / NSF rate, and stable-employment percentage? A property-management company in the area should have these aggregated.
- How much new for-sale + rental construction is in the pipeline within 1–3 miles? Heavy new supply typically softens prices + rents 12–24 months out; constrained supply supports both.
Investment metrics
- 1% rule
- 0.73% ✗
- Cap rate
- 5.44%
- Cash-on-cash
- -3.06%
- DSCR
- 0.86
- GRM
- 11.4
CMA / ARV
- ARV (on-the-fly)
- $245,640
- Comps found
- 12
Show comp detail 12 sales within ~0.75 mi
| Address | Dist | Beds/Ba | Sqft | Sold | Price | $/sf | Match |
|---|---|---|---|---|---|---|---|
| 6329 Clovernook Dr | 0.14mi | 3/1.5 (-1) | 1,028 (-4%) | 2mo | $225,000 | $219 | 81 |
| 6348 Briargate Dr | 0.03mi | 3/2.5 (-1) | 1,132 (+6%) | 9mo | $225,000 | $199 | 72 |
| 1891 Clearbrook Dr | 0.06mi | 3/1.5 (-1) | 1,101 (+3%) | 19mo | $299,900 | $272 | 71 |
| 6470 Southgate Pl | 0.38mi | 3/2.0 (-1) | 1,028 (-4%) | 1mo | $295,000 | $287 | 68 |
| 1651 Deer Run Dr | 0.32mi | 3/2.5 (-1) | 1,040 (-3%) | 7mo | $285,000 | $274 | 66 |
| 1656 Deer Run Dr | 0.41mi | 3/2.5 (-1) | 1,040 (-3%) | 3mo | $267,000 | $257 | 65 |
| 6532 Rosetta Dr | 0.42mi | 3/1.5 (-1) | 1,040 (-3%) | 9mo | $239,200 | $230 | 63 |
| 1772 Deer Run Dr | 0.32mi | 4/2.0 | 1,182 (+11%) | 15mo | $249,500 | $211 | 53 |
| 6416 Heathersfield Dr | 0.36mi | 3/2.0 (-1) | 1,028 (-4%) | 22mo | $274,900 | $267 | 51 |
| 6536 Oak Crest Dr | 0.60mi | 4/3.0 | 1,095 (+2%) | 14mo | $235,000 | $215 | 50 |
| 6536 Rosetta Dr | 0.43mi | 3/2.0 (-1) | 1,120 (+5%) | 23mo | $205,000 | $183 | 46 |
| 6522 Rogers Ln | 0.56mi | 3/1.0 (-1) | 960 (-10%) | 13mo | $206,000 | $215 | 39 |
Match score weights: distance 35% · size 25% · config 20% · recency 20%. Top-matched comps best support the ARV.
Projected returns pro-forma
-3.0% appreciation · 3.0% rent growth · sell at horizon
- IRR
- -21.4%
- Equity multiple
- 0.26×
- Total profit
- $-65,404
- Equity at exit
- $46,968
- IRR
- -15.1%
- Equity multiple
- 0.14×
- Total profit
- $-75,573
- Equity at exit
- $27,235
Cash invested: $88,200 (down + closing). Projections, not guarantees.
Landlord ↔ Tenant lean methodology
- Overall (STATE)
- 83 Strongly Landlord-Friendly
- State Kentucky
- 83 Strongly Landlord-Friendly · R+16
- County
- — inherits STATE
- City
- — inherits STATE
ZIP-level market 41005
- Home prices YoY
- -25.4%
- Active inventory
- 161
- Price-to-rent
- 11.4×
Monthly cashflow live
- Estimated rent
- $2,303 medium interval (Pro) →
- Mortgage (P&I)
- −$1,652
- Tax from tax record
- −$261 /mo · $3,134/yr
- Insurance
- −$131
- HOA
- −$0
- Vacancy / Maint / Mgmt
- −$484
- Net cashflow
- $-225
Break-even live
Sensitivity live
| Price | -10% $-46 | -5% $-136 | +0% $-225 | +5% $-314 | +10% $-403 |
|---|---|---|---|---|---|
| Rent | -10% $-407 | -5% $-316 | +0% $-225 | +5% $-134 | +10% $-43 |
| Rate | -1.0pp $-66 | -0.5pp $-145 | base $-225 | +0.5pp $-306 | +1.0pp $-389 |
UW: 25.0% down · 7.5% · 30yr · 1.5% tax · 5.0% vac · 8.0% maint · 8.0% mgmt
Financing live
Cash to close
- Down payment
- $78,750
- Closing costs
- $9,450
- Reserves months
- —
- Total cash needed
- —
Loan-product check · same deal, 3 products live
Conventional
25% down · 7.5% · 30yr
- Down + closing
- —
- Monthly P&I
- —
- Monthly cashflow
- —
- DSCR
- —
- Eligible?
- —
Personal DTI + credit; lowest rate.
DSCR
20% down · 8.5% · 30yr
- Down + closing
- —
- Monthly P&I
- —
- Monthly cashflow
- —
- DSCR
- —
- Eligible?
- —
No personal income docs; deal must DSCR.
Hard money
10% down · 12.0% · 12mo
- Down + closing
- —
- Monthly P&I
- —
- Monthly cashflow
- —
- DSCR
- —
- Eligible?
- —
Short-term bridge; refi at stabilization.
Rent comps 1 comps
| Address | Beds | Baths | Sqft | Rent | $/sqft | DOM | Units | Dist |
|---|---|---|---|---|---|---|---|---|
| 6060 Taylor Dr Burlington, KY | 1.0–3.0 | 1.0–2.0 | 1100 | $1,770 | $1.61 | 3d | 13 | 0.63mi |
Listing history 34 events
-
2026-05-02status Pending
-
2026-04-23$315,000 Active
-
2026-02-25soldstatus $228,000 Sold 55-char remark
Show marketing remark (55 chars)
Sold when submitted - Boone Co Master Commissioner Sale
-
2026-02-25$228,000 Active 55-char remark
Show marketing remark (55 chars)
Sold when submitted - Boone Co Master Commissioner Sale
-
2024-10-23soldstatus $280,000
-
2024-10-22soldstatus $280,000 Sold 549-char remark
Show marketing remark (549 chars)
Brand New Roof! Decorated and upgraded throughout. Truly a stunning home from top to bottom. Gorgeous kitchen with newer stainless appliances. Upgraded LVP flooring. Both bathrooms are BEAUTIFUL. Finished lower level with wood burning fireplace and a 4th bedroom and a warm great room. Central vacuum and closet systems. Full laundry/mud/storage room coming from the garage. Nice rear deck overlooking your large rear yard with firepit area. Home backs up to a large vacant field. Extended garage. Extra parking in front for 2 cars, off street.
-
2024-09-09status Pending 549-char remark
Show marketing remark (549 chars)
Brand New Roof! Decorated and upgraded throughout. Truly a stunning home from top to bottom. Gorgeous kitchen with newer stainless appliances. Upgraded LVP flooring. Both bathrooms are BEAUTIFUL. Finished lower level with wood burning fireplace and a 4th bedroom and a warm great room. Central vacuum and closet systems. Full laundry/mud/storage room coming from the garage. Nice rear deck overlooking your large rear yard with firepit area. Home backs up to a large vacant field. Extended garage. Extra parking in front for 2 cars, off street.
-
2024-08-22$280,000 Active 549-char remark
Show marketing remark (549 chars)
Brand New Roof! Decorated and upgraded throughout. Truly a stunning home from top to bottom. Gorgeous kitchen with newer stainless appliances. Upgraded LVP flooring. Both bathrooms are BEAUTIFUL. Finished lower level with wood burning fireplace and a 4th bedroom and a warm great room. Central vacuum and closet systems. Full laundry/mud/storage room coming from the garage. Nice rear deck overlooking your large rear yard with firepit area. Home backs up to a large vacant field. Extended garage. Extra parking in front for 2 cars, off street.
-
2024-08-22historical
Show marketing remark (549 chars)
Brand New Roof! Decorated and upgraded throughout. Truly a stunning home from top to bottom. Gorgeous kitchen with newer stainless appliances. Upgraded LVP flooring. Both bathrooms are BEAUTIFUL. Finished lower level with wood burning fireplace and a 4th bedroom and a warm great room. Central vacuum and closet systems. Full laundry/mud/storage room coming from the garage. Nice rear deck overlooking your large rear yard with firepit area. Home backs up to a large vacant field. Extended garage. Extra parking in front for 2 cars, off street.
-
2024-08-01$297,000 Active
-
2024-08-01historical
-
2024-07-25price $297,000
-
2024-07-09$300,000 Active
-
2019-12-09historical
-
2019-12-09soldstatus $178,000
-
2019-12-06soldstatus $178,000 Closed
-
2019-11-01status Pending
-
2019-10-25price $179,900
-
2019-10-24status Active
-
2019-10-16status Pending
-
2019-10-12$182,000 Active
-
2015-07-29soldstatus $133,000
-
2015-07-24soldstatus $132,900
-
2015-06-01$132,900
-
2015-03-24soldstatus $85,278
-
2015-03-13soldstatus $82,500
-
2015-01-22$78,900
-
2003-02-05soldstatus $120,000
-
2003-01-22soldstatus $120,000
-
2002-11-11$120,000
-
1995-12-11soldstatus $88,000
-
1995-12-08soldstatus $88,000
-
1995-10-26$92,500
-
1993-08-17soldstatus $84,500
ⓘ Source: listings_history table (triggers on properties + properties_extension) + one-shot
backfill from property_details.listing_events for pre-trigger history.
Tax reassessment forecast KY · Resets to sale price
- Current annual tax
- $3,134 · $261/mo
- Projected year-2 tax
- $3,134 · $261/mo
- Expected delta
- $0/yr ($0/mo · 0.0%)
ⓘ Screening estimate from a state-policy table — verify with the county assessor before closing.
Climate risk First Street
- Flood 1/10 Low FEMA zone X (unshaded) · 0% chance over 30 yrs
- Wildfire 1/10 Low
- Heat 4/10 Moderate 7 d/yr ≥101°F today · 19 d/yr by 30 yrs out
- Wind 2/10 Low 2% chance of damaging wind over 30 yrs
- Air quality 2/10 Low 1 unhealthy d/yr today · 3 by 30 yrs out
Nearby sold comps map
Loading sold comps map…
Walkable amenities ~0.75 mi
Loading nearby amenities…
Taxation est. · year 1
- Rental income
- $27,639
- − Mortgage interest
- −$17,645
- − Property taxes
- −$3,134
- − Insurance
- −$1,575
- − Repairs & maintenance
- −$2,211
- − Management
- −$2,211
- − Depreciation
- −$9,164
- Taxable loss
- −$8,301
- Est. tax savings @ 24.0%
- +$1,992
- After-tax cash flow
- $-705/yr
For passive investors: Depreciation is non-cash, so a rental often shows a tax loss while cash-flowing — sheltering income. Rental losses are passive: they offset passive income freely, and up to $25,000/yr can offset ordinary (W-2) income if you actively participate and your MAGI is under $100k (phasing out to $0 by $150k); unused losses carry forward. On sale, claimed depreciation is recaptured at up to 25%, and gains may owe capital-gains tax (a 1031 exchange can defer both). Figures are a year-1 estimate at your 24.0% rate — not tax advice; consult a CPA.
Schools (NCES district)
- District
- Boone County
- NCES district ID
- 2100510
- Math proficiency
- 43% ▼ -10.00%
- Reading proficiency
- 49% ▼ -12.00%
- Median HH income
- $68,096
- Composite
- 41.18/100
- National rank
- #3550
- State rank
- #12 of 165 in KY
Livability — Burlington
- Score
- 77/100
- State rank
- #83
- US rank
- #2792
Category grades
Schools grade is shown separately in the Schools card above.
Census & demographics
- Census place
- Burlington, KY
- County
- Boone County · 99,563 people
- City population
- 25,718
- Metro
- Cincinnati, OH-KY-IN
- Population (ZIP)
- 25,718
- Household income
- $112,083
- Rent vs Own
- Severe rent burden
- 399.0
Population outlook (Boone County) Hauer SSP2
- Today (2025)
- 144,066 people
- By 2030
- 152,005 · +5.5%
- By 2040
- 166,776 · +15.8%
- By 2050
- 178,974 · +24.2%
- By 2075
- 204,515 · +42.0%
- By 2100
- 215,306 · +49.4%
Race, ethnicity, and origin ACS 2023
- Neighborhood character
- Predominantly White (86%)
- Race & ethnicity
- White 86% Hispanic / Latino 6% Two or more races 5% Black 2% Asian 2%
- Hispanic origin (detail)
- Mexican 3%
- Common ancestry
- Italian 3% Serbian 3% Lithuanian 2%
- Foreign-born
- 6% · Canada
- Languages at home
- 92% English-only · Spanish 5% Other Asian/Pacific 1%
Political lean MEDSL · Boone
- 2024 margin
- Solid R (+37.2) · D 30.6% · R 67.8% · Other 1.7%
- 2008→2024 swing
- -2.7pp toward R · 2008: -34.5pp · 2024: -37.2pp
- All cycles
- 2024: R+37.2 2020: R+35.7 2016: R+41.8 2012: R+38.7 2008: R+34.5
Not yet ingested
- Civics
- —
Market trends
- HPI YoY
- ▼ -75.14%
- Current HPI
- 220.1076
- Rent YoY
- —
- Metro
- Cincinnati, OH-KY-IN
- State GDP YoY
- ▲ 1.81%
- F500 in state
- 4
Industry mix (Fortune 500 HQ in KY)
| Industry | F500 HQs | Revenue |
|---|---|---|
| Healthcare | 1 | $118B |
|
||
| Food / Beverage | 1 | $7B |
|
||
Price history
+272.8% since first listed34 events — show timeline
- 2026-05-02 Pending — NKMLS
- 2026-04-23 Listed $315,000 NKMLS
- 2026-02-25 Listed $228,000 NKMLS
- 2026-02-25 Sold (MLS) $228,000 NKMLS
- 2024-10-23 Sold (Public Records) $280,000 Public Records
- 2024-10-22 Sold (MLS) $280,000 NKMLS
- 2024-09-09 Pending — NKMLS
- 2024-08-22 Listing Removed — NKMLS
- 2024-08-22 Listed $280,000 NKMLS
- 2024-08-01 Listing Removed — NKMLS
- 2024-08-01 Listed $297,000 NKMLS
- 2024-07-25 Price Changed $297,000 NKMLS
- 2024-07-09 Listed $300,000 NKMLS
- 2019-12-09 Listing Removed — NKMLS
- 2019-12-09 Sold (Public Records) $178,000 Public Records
- 2019-12-06 Sold (MLS) $178,000 NKMLS
- 2019-11-01 Pending — NKMLS
- 2019-10-25 Price Changed $179,900 NKMLS
- 2019-10-24 Relisted — NKMLS
- 2019-10-16 Pending — NKMLS
- 2019-10-12 Listed $182,000 NKMLS
- 2015-07-29 Sold (Public Records) $133,000 Public Records
- 2015-07-24 Sold (MLS) $132,900 NKMLS
- 2015-06-01 Listed $132,900 NKMLS
- 2015-03-24 Sold (Public Records) $85,278 Public Records
- 2015-03-13 Sold (MLS) $82,500 NKMLS
- 2015-01-22 Listed $78,900 NKMLS
- 2003-02-05 Sold (Public Records) $120,000 Public Records
- 2003-01-22 Sold (MLS) $120,000 NKMLS
- 2002-11-11 Listed $120,000 NKMLS
- 1995-12-11 Sold (Public Records) $88,000 Public Records
- 1995-12-08 Sold (MLS) $88,000 NKMLS
- 1995-10-26 Listed $92,500 NKMLS
- 1993-08-17 Sold (Public Records) $84,500 Public Records
Property tax history
+8.9%/yrLatest (2025): $3,134 · +57.8% YoY. Source: county tax records.
Cash-flow waterfall
monthlySold comps — $/sqft
last 12 mo · ≤1 miLoading sold comps…