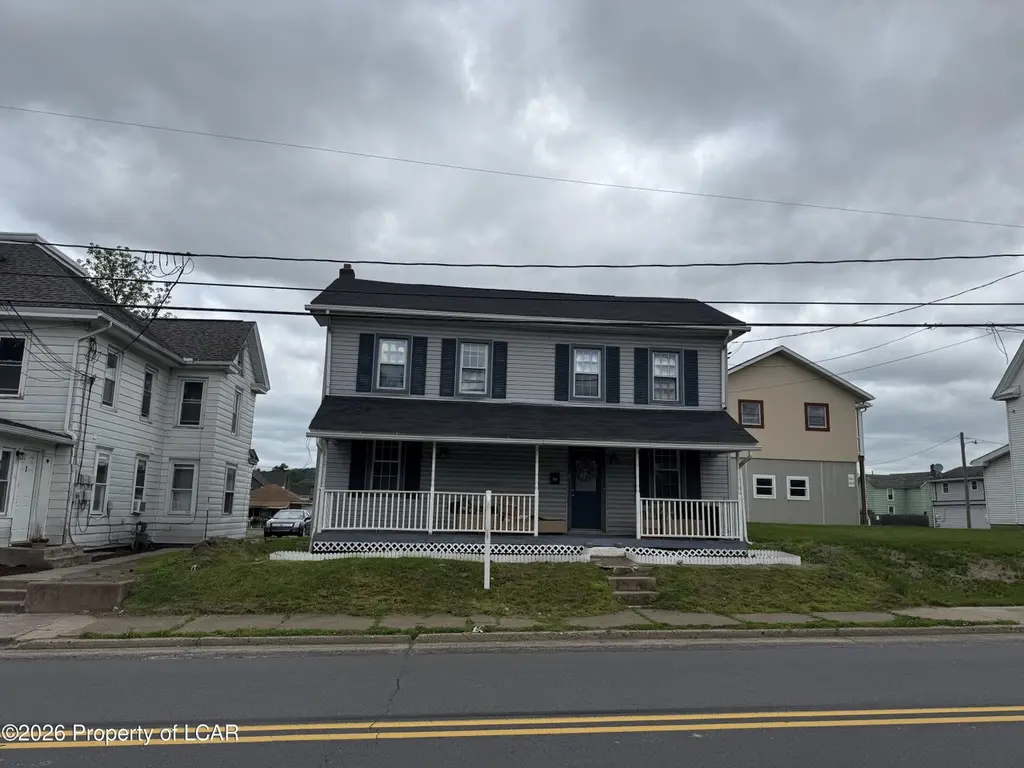
619 3rd St · Nescopeck, PA
Flood risk 1/10 · Minimal
- FEMA flood zone
- X (unshaded)
- Chance of flooding over 30 yrs
- 0.0%
- Est. flood insurance / yr
- $507 – $1,088
Fire risk 1/10 · Minimal
- Est. fire insurance / yr
- $511 – $949
Heat risk 4/10 · Minor
- Hot days now (above 97°F)
- 7 days/yr
- Hot days in 30 yrs
- 16 days/yr
Wind risk 3/10 · Minor
- Chance of severe wind over 30 yrs
- 4.0%
Air-quality risk 2/10 · Minimal
- Unhealthy air days now
- 1 days/yr
- Unhealthy air days in 30 yrs
- 2 days/yr
Risk factors via First Street. Map © Google.
Why this score? — see what drove the D+ grade
The composite is a weighted blend of 9 inputs, each scored 0–100. Each bar is that input's sub-score; the figure is the points it added to the 100-point composite (weight × sub-score).
- Cash flow +13.1/30.0
- ARV discount +8.9/15.0
- Appreciation +6.6/10.0
- DSCR +3.9/10.0
- Schools +3.7/10.0
- Livability +3.7/5.0
- 1% rule +3.2/10.0
- Rent growth +2.5/5.0
- Condition / age +2.5/5.0
$220,000
🖨 Deal sheet (PDF) 📄 Offer letter ✓ Due diligence
Listing remarks
Charming Nescopeck home offering comfortable living and small-town appeal. This well-maintained property features a functional layout, inviting living spaces, and convenient access to local amenities, schools, and major routes. A great opportunity for first-time buyers or investors seeking value and potential.
Key facts
- 0.23 acre lot
- Garage
- Built 1900
Property features AI
Exterior
- Parking: Detached 1-car garage
- Utilities: Public water; Public sewer
- Home design: Single-family residence; Two-story
- Construction: Vinyl siding
- Exterior features: Public water; Public sewer; Lot approximately 50 x 200 (0.23 acre); Residential zoning
Interior
- Bathrooms: 2 full bathrooms
- Heating & cooling: Electric baseboard heat
- Interior features: Eat-in kitchen; Basement with dirt floor
Neighborhood map
What this means for you Summary
Snapshot
- This is a 3-bed/2.0-bath single-family listed at $220k.
Deal economics
- At list price, monthly cash flow is $-6 ($-73/yr) — negative.
- To cash-flow at today's rent, offer at most $219k (0.5% below list).
- To meet the 1% rule (rent ≥ 1% of price), the offer needs to be $181k (17.9% below list).
- Recommended offer: $181k (17.9% below list) — sets the bar for 1% rule.
Location & tenants
- Location reads 73/100 on livability (#571 in PA) — a middle-class / working-renter tenant base. Strengths: crime A+, cost of living A+, housing A+; Watch: amenities F, commute F, employment D-.
- Berwick Area SD (other): math 32% / reading 57% proficiency, ranked #291 of 539 in PA (top 54%) — families likely to look elsewhere, expect single-tenant / working-renter base with shorter leases.
- Zoned schools: Nescopeck El Sch (math 54% / reading 64%, grade B-, #377 of 1,518 statewide, top 28%, 156 students, 100% FRL); Berwick Area Ms (math 19% / reading 54%, grade F, #307 of 512 statewide, top 61%, 844 students, 100% FRL); Berwick Area Hs (math 57% / reading 70%, grade B-, #69 of 437 statewide, top 16%, 782 students, 100% FRL) — zoned schools average 100% FRL vs 46% district-wide (54 pts higher); higher-poverty schools than district average — tighter screening recommended.
- Market conditions: 69 active listings in the ZIP; 349 units permitted in Luzerne County in 2024 (16 in 5+ unit buildings).
Forward outlook
- In year one you build about $9k of equity ($2k loan paydown + $7k appreciation (3.2% local appreciation)).
- Luzerne County population projected at +4% by 2050 — modest demand growth; plan on rents tracking national, not racing it.
- At projected returns (3.2% appreciation + 3.0% rent growth), your $62k cash investment doubles in ~6 years — after that, you're playing with house money.
- By year 5, paydown + projected appreciation supports a ~$37k cash-out refi (75% LTV) — recoverable capital for the next deal without selling this one.
Negotiation context
- Only 6 days on market — expect competitive offers; lowballing is unlikely to land.
- 2 sale attempts since 8y ago with the ask held roughly flat each time — persistent listings suggest the price (not the market) is what's stuck; bring a comps-based counter.
- Current owner paid $140k; list at $220k implies a 57% gain — meaningful room to come down on a strong offer.
Risks & watch-outs
- Watch-outs: built in 1900 — expect roof / HVAC / electrical / plumbing capex.
Questions for the listing agent
- What do current leases actually rent for vs. the listed asking? Can we see a recent rent roll and the last 12 months of T-12 income?
- Built in 1900 — when were the roof, HVAC, electrical panel, plumbing, and water heater last replaced?
- Is there a deadline driving the sale (1031 exchange, divorce, estate, relocation)? That informs how much negotiation room exists.
- Schools are B-rated — typically a magnet for longer-tenancy family renters. What's the average tenant stay here, and is there a school-zone premium baked into asking?
- The area grade is low — what's the realistic commute time and amenity access for the typical tenant pool here? Any planned neighborhood developments (good or bad) we should know about?
- What's the average days-on-market for RENTAL listings here right now (not sales)? A rising rental-DOM trend means longer vacancies and softer asking-rent achievability than the comps imply.
- What's the recent tenant-quality profile in this submarket — average credit score on applications, eviction rate, late-payment / NSF rate, and stable-employment percentage? A property-management company in the area should have these aggregated.
- How much new for-sale + rental construction is in the pipeline within 1–3 miles? Heavy new supply typically softens prices + rents 12–24 months out; constrained supply supports both.
Investment metrics
- 1% rule
- 0.82% ✗
- Cap rate
- 6.26%
- Cash-on-cash
- -0.12%
- DSCR
- 0.99
- GRM
- 10.1
CMA / ARV
- ARV (on-the-fly)
- $227,150
- Comps found
- 12
Show comp detail 12 sales within ~0.75 mi
| Address | Dist | Beds/Ba | Sqft | Sold | Price | $/sf | Match |
|---|---|---|---|---|---|---|---|
| 622 E 4th St | 0.11mi | 3/1.5 | 2,000 (+4%) | 3mo | $265,000 | $133 | 84 |
| 528 E 4th St | 0.14mi | 4/2.0 (+1) | 2,038 (+6%) | 4mo | $241,500 | $118 | 76 |
| 319 3rd St | 0.32mi | 3/2.0 | 1,829 (-5%) | 8mo | $138,000 | $75 | 70 |
| 714 1st St | 0.18mi | 3/1.5 | 1,797 (-7%) | 13mo | $207,000 | $115 | 68 |
| 313 W 5th St | 0.38mi | 4/2.5 (+1) | 1,960 (+2%) | 10mo | $272,000 | $139 | 64 |
| 504 3rd St | 0.15mi | 4/1.5 (+1) | 1,874 (-3%) | 21mo | $165,000 | $88 | 64 |
| 810 E 2nd St | 0.17mi | 2/2.0 (-1) | 1,736 (-10%) | 18mo | $210,000 | $121 | 55 |
| 539 E 2nd St | 0.63mi | 4/1.0 (+1) | 2,024 (+5%) | 1mo | $105,000 | $52 | 52 |
| 338 E Front St | 0.65mi | 3/2.5 | 2,030 (+6%) | 8mo | $220,000 | $108 | 52 |
| 300 Mercer St | 0.30mi | 2/2.0 (-1) | 1,701 (-12%) | 15mo | $197,000 | $116 | 49 |
| 319 5th St | 0.35mi | 4/2.5 (+1) | 2,127 (+10%) | 15mo | $259,000 | $122 | 47 |
| 835 E 2nd St | 0.65mi | 3/3.0 | 2,212 (+15%) | 5mo | $280,000 | $127 | 37 |
Match score weights: distance 35% · size 25% · config 20% · recency 20%. Top-matched comps best support the ARV.
Projected returns pro-forma
3.2% appreciation · 3.0% rent growth · sell at horizon
- IRR
- 7.9%
- Equity multiple
- 1.46×
- Total profit
- $28,398
- Equity at exit
- $101,380
- IRR
- 10.5%
- Equity multiple
- 2.60×
- Total profit
- $98,795
- Equity at exit
- $158,177
Cash invested: $61,600 (down + closing). Projections, not guarantees.
Landlord ↔ Tenant lean methodology
- Overall (STATE)
- 62 Landlord-Friendly
- State Pennsylvania
- 62 Landlord-Friendly · EVEN
- County
- — inherits STATE
- City
- — inherits STATE
ZIP-level market 18635
- Home prices YoY
- 1.3%
- Active inventory
- 69
- Price-to-rent
- 10.1×
Monthly cashflow live
- Estimated rent
- $1,807 medium interval (Pro) →
- Mortgage (P&I)
- −$1,154
- Tax from tax record
- −$188 /mo · $2,262/yr
- Insurance
- −$92
- HOA
- −$0
- Vacancy / Maint / Mgmt
- −$380
- Net cashflow
- $-6
Break-even live
Sensitivity live
| Price | -10% $118 | -5% $56 | +0% $-6 | +5% $-68 | +10% $-131 |
|---|---|---|---|---|---|
| Rent | -10% $-149 | -5% $-77 | +0% $-6 | +5% $65 | +10% $137 |
| Rate | -1.0pp $105 | -0.5pp $50 | base $-6 | +0.5pp $-63 | +1.0pp $-121 |
UW: 25.0% down · 7.5% · 30yr · 1.5% tax · 5.0% vac · 8.0% maint · 8.0% mgmt
Financing live
Cash to close
- Down payment
- $55,000
- Closing costs
- $6,600
- Reserves months
- —
- Total cash needed
- —
Loan-product check · same deal, 3 products live
Conventional
25% down · 7.5% · 30yr
- Down + closing
- —
- Monthly P&I
- —
- Monthly cashflow
- —
- DSCR
- —
- Eligible?
- —
Personal DTI + credit; lowest rate.
DSCR
20% down · 8.5% · 30yr
- Down + closing
- —
- Monthly P&I
- —
- Monthly cashflow
- —
- DSCR
- —
- Eligible?
- —
No personal income docs; deal must DSCR.
Hard money
10% down · 12.0% · 12mo
- Down + closing
- —
- Monthly P&I
- —
- Monthly cashflow
- —
- DSCR
- —
- Eligible?
- —
Short-term bridge; refi at stabilization.
Listing history 5 events
-
2026-06-22days on market $220,000 Active 6 DOM
-
2026-06-19days on market $220,000 Active 3 DOM
-
2026-06-18days on market $220,000 Active 2 DOM
-
2026-06-17remarks 311-char remark
-
2026-06-17$220,000 Active 1 DOM
ⓘ Source: listings_history table (triggers on properties + properties_extension) + one-shot
backfill from property_details.listing_events for pre-trigger history.
Tax reassessment forecast PA · Partial reset (capped growth)
- Current annual tax
- $2,262 · $188/mo
- Projected year-2 tax
- $2,869 · $239/mo
- Expected delta
- +$607/yr (+$51/mo · 26.8%)
ⓘ Screening estimate from a state-policy table — verify with the county assessor before closing.
Climate risk First Street
- Flood 1/10 Low FEMA zone X (unshaded) · 0% chance over 30 yrs
- Wildfire 1/10 Low
- Heat 4/10 Moderate 7 d/yr ≥97°F today · 16 d/yr by 30 yrs out
- Wind 3/10 Moderate 4% chance of damaging wind over 30 yrs
- Air quality 2/10 Low 1 unhealthy d/yr today · 2 by 30 yrs out
Nearby sold comps map
Loading sold comps map…
Walkable amenities ~0.75 mi
Loading nearby amenities…
Taxation est. · year 1
- Rental income
- $21,687
- − Mortgage interest
- −$12,323
- − Property taxes
- −$2,262
- − Insurance
- −$1,100
- − Repairs & maintenance
- −$1,735
- − Management
- −$1,735
- − Depreciation
- −$6,400
- Taxable loss
- −$3,868
- Est. tax savings @ 24.0%
- +$928
- After-tax cash flow
- $855/yr
For passive investors: Depreciation is non-cash, so a rental often shows a tax loss while cash-flowing — sheltering income. Rental losses are passive: they offset passive income freely, and up to $25,000/yr can offset ordinary (W-2) income if you actively participate and your MAGI is under $100k (phasing out to $0 by $150k); unused losses carry forward. On sale, claimed depreciation is recaptured at up to 25%, and gains may owe capital-gains tax (a 1031 exchange can defer both). Figures are a year-1 estimate at your 24.0% rate — not tax advice; consult a CPA.
Schools (NCES district)
- District
- Berwick Area SD
- NCES district ID
- 4203480
- Math proficiency
- 32% ▼ -14.00%
- Reading proficiency
- 57% ▼ -6.00%
- Median HH income
- $41,964
- Composite
- 37.36/100
- National rank
- #4433
- State rank
- #291 of 539 in PA
Livability — Nescopeck
- Score
- 73/100
- State rank
- #571
- US rank
- #5424
Category grades
Schools grade is shown separately in the Schools card above.
Census & demographics
- Census place
- Nescopeck, PA
- Population (ZIP)
- 3,640
Population outlook (Luzerne County) Hauer SSP2
- Today (2025)
- 319,505 people
- By 2030
- 319,943 · +0.1%
- By 2040
- 322,643 · +1.0%
- By 2050
- 330,817 · +3.5%
- By 2075
- 379,145 · +18.7%
- By 2100
- 431,908 · +35.2%
Race, ethnicity, and origin ACS 2023
- Neighborhood character
- Predominantly White (96%)
- Race & ethnicity
- White 96% Two or more races 2% Hispanic / Latino 1%
- Common ancestry
- Romanian 8% Lithuanian 4% Iranian 3%
- Foreign-born
- 0%
- Languages at home
- 96% English-only · Spanish 3% Russian/Polish/Slavic 1%
Political lean MEDSL · Luzerne
- 2024 margin
- R (+19.2) · D 40.0% · R 59.2%
- 2008→2024 swing
- -27.6pp toward R · 2008: 8.4pp · 2024: -19.2pp
- All cycles
- 2024: R+19.2 2020: R+14.4 2016: R+19.6 2012: D+4.8 2008: D+8.4
Not yet ingested
- Civics
- —
Market trends
- HPI YoY
- ▲ 3.20%
- Current HPI
- 245.2539
- Rent YoY
- —
- Metro
- —
- State GDP YoY
- ▲ 1.68%
- F500 in state
- 34
Industry mix (Fortune 500 HQ in PA)
| Industry | F500 HQs | Revenue |
|---|---|---|
| Healthcare | 2 | $309B |
|
||
| Insurance | 2 | $27B |
|
||
| Telecommunications / Media | 1 | $124B |
|
||
| Industrial Distribution | 1 | $22B |
|
||
| Financial Services | 1 | $20B |
|
||
| Chemicals / Materials | 1 | $18B |
|
||
Price history
+109.5% since first listed4 events — show timeline
- 2026-06-16 Listed $220,000 LCAR
- 2021-06-30 Sold (Public Records) $140,000 Public Records
- 2018-09-29 Listed $110,000 CSVBR
- 2009-10-26 Sold (Public Records) $105,000 Public Records
Property tax history
+1.9%/yrLatest (2026): $2,262 · +1.4% YoY. Source: county tax records.
Cash-flow waterfall
monthlySold comps — $/sqft
last 12 mo · ≤1 miLoading sold comps…