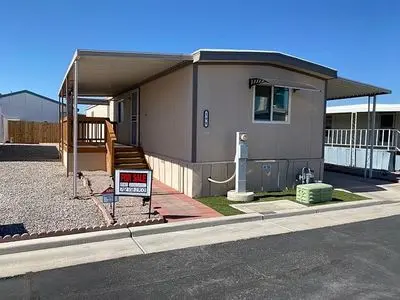
4525 W Twain Ave · Paradise, NV
Flood risk No data
- FEMA flood zone
- —
- Chance of flooding over 30 yrs
- —
- Est. flood insurance / yr
- —
Fire risk No data
- Est. fire insurance / yr
- —
Heat risk 8/10 · Major
- Hot days now (above threshold)
- 6 days/yr
- Hot days in 30 yrs
- 14 days/yr
Wind risk No data
- Chance of severe wind over 30 yrs
- —
Air-quality risk 3/10 · Minor
- Unhealthy air days now
- 2 days/yr
- Unhealthy air days in 30 yrs
- 3 days/yr
Risk factors via First Street. Map © Google.
Why this score? — see what drove the B- grade
The composite is a weighted blend of 9 inputs, each scored 0–100. Each bar is that input's sub-score; the figure is the points it added to the 100-point composite (weight × sub-score).
- Cash flow +30.0/30.0
- 1% rule +10.0/10.0
- DSCR +10.0/10.0
- ARV discount +7.5/15.0
- Livability +3.8/5.0
- Schools +2.6/10.0
- Rent growth +2.5/5.0
- Condition / age +2.5/5.0
- Appreciation +0.0/10.0
$65,000
🖨 Deal sheet (PDF) 📄 Offer letter ✓ Due diligence
Listing remarks
SELLER FINANCING AVAILABLE FOR MINIMUM CREDIT SCORE OF 690. Welcome to Eldorado Estates! All Ages community at 4525 W Twain Avenue Las Vegas, NV 89103 Mostly renovated! Spacious living area separated from the Kitchen features a pass through breakfast bar with ample cabinets and drawers. Kitchen includes all appliances. The master bedroom can accommodate a King bed set includes a ceiling fan with light, a large walk in closet, laminate flooring. The en-suite bathroom has been upgraded with a light bright vanity, toilet, and a large shower with ceramic tile surround and a sliding glass enclosure. A guest bedroom can accommodate a queen size bed set and includes ceiling fan with light,
Key facts
- Clubhouse amenities
- Large walk in closet
- Large walk in shower
Tags
Neighborhood map
What this means for you Summary
Snapshot
- This is a 2-bed/2.0-bath land listed at $65k.
Deal economics
- At list price, monthly cash flow is $556 ($7k/yr) — positive.
- The deal already cash-flows at list — no discount required.
- Meets the 1% rule at list price ($1k rent vs $65k).
Location & tenants
- Location reads 76/100 on livability (#10 in NV, #3,494 nationally) — a middle-class / working-renter tenant base. Strengths: commute A+, housing A-, cost of living B; Watch: employment D+, schools F, crime D-.
- Clark County School District (urban): math 21% / reading 39% proficiency, ranked #11 of 17 in NV (top 65%) — families likely to look elsewhere, expect single-tenant / working-renter base with shorter leases.
- Market conditions: Rents soft (-0.2%/yr); 395 active listings in the ZIP; 9 comparable units currently listed for rent nearby; rentals lingering (median 45d on market — plan ~5-8 weeks vacancy on turnover, expect pricing pressure); 89% of comp listings sitting > 30 days — soft ceiling on asking rent; 14,754 units permitted in Clark County in 2024 (2,301 in 5+ unit buildings).
- This rent runs 31% of the median local income ($49k/yr) — at the standard rent-burdened threshold; future hikes will face affordability resistance.
Forward outlook
- Local home prices are declining (-3.0%/yr); year-one equity from $449 of loan paydown is wiped out by about $2k of value loss. Plan a longer hold.
- Clark County population projected at +36% by 2050 — long-run rental-demand tailwind backs the buy-and-hold thesis.
- At projected returns (-3.0% appreciation + 0.0% rent growth), your $18k cash investment doubles in ~4 years — after that, you're playing with house money.
Negotiation context
- Only 1 days on market — expect competitive offers; lowballing is unlikely to land.
Risks & watch-outs
- Climate carrying-cost: extreme-heat days projected 6→14/yr by 2055 (HVAC capex compounding) — expect insurance premiums to compound above CPI over the hold.
Questions for the listing agent
- Is there a deadline driving the sale (1031 exchange, divorce, estate, relocation)? That informs how much negotiation room exists.
- Schools are F-rated, which usually means shorter tenancies and higher turnover. Who's the typical renter profile here, and what's been the actual vacancy rate?
- Crime grade is D in this area — have there been break-ins, vandalism, or insurance claims at this property in the last 3 years? What carrier currently insures it and at what premium?
- What's the average days-on-market for RENTAL listings here right now (not sales)? A rising rental-DOM trend means longer vacancies and softer asking-rent achievability than the comps imply.
- What's the recent tenant-quality profile in this submarket — average credit score on applications, eviction rate, late-payment / NSF rate, and stable-employment percentage? A property-management company in the area should have these aggregated.
- How much new for-sale + rental construction is in the pipeline within 1–3 miles? Heavy new supply typically softens prices + rents 12–24 months out; constrained supply supports both.
Investment metrics
- 1% rule
- 1.96% ✓
- Cap rate
- 16.57%
- Cash-on-cash
- 36.69%
- DSCR
- 2.63
- GRM
- 4.3
CMA / ARV
No comps found within radius.
Projected returns pro-forma
-3.0% appreciation · 0.0% rent growth · sell at horizon
- IRR
- 29.1%
- Equity multiple
- 2.16×
- Total profit
- $21,198
- Equity at exit
- $9,692
- IRR
- 34.7%
- Equity multiple
- 3.73×
- Total profit
- $49,756
- Equity at exit
- $5,620
Cash invested: $18,200 (down + closing). Projections, not guarantees.
Landlord ↔ Tenant lean methodology
- Overall (STATE)
- 71 Landlord-Friendly
- State Nevada
- 71 Landlord-Friendly · R+1
- County
- — inherits STATE
- City
- — inherits STATE
ZIP-level market 89103
- Rents YoY
- -0.2%
- Active inventory
- 395
- Price-to-rent
- 4.3×
Monthly cashflow live
- Estimated rent
- $1,273 high interval (Pro) →
- Mortgage (P&I)
- −$341
- Tax est. 1.5%
- −$81 /mo · $975/yr
- Insurance
- −$27
- HOA
- −$0
- Vacancy / Maint / Mgmt
- −$267
- Net cashflow
- $556
Break-even live
Sensitivity live
| Price | -10% $601 | -5% $579 | +0% $556 | +5% $534 | +10% $512 |
|---|---|---|---|---|---|
| Rent | -10% $456 | -5% $506 | +0% $556 | +5% $607 | +10% $657 |
| Rate | -1.0pp $589 | -0.5pp $573 | base $556 | +0.5pp $540 | +1.0pp $522 |
UW: 25.0% down · 7.5% · 30yr · 1.5% tax · 5.0% vac · 8.0% maint · 8.0% mgmt
Financing live
Cash to close
- Down payment
- $16,250
- Closing costs
- $1,950
- Reserves months
- —
- Total cash needed
- —
Loan-product check · same deal, 3 products live
Conventional
25% down · 7.5% · 30yr
- Down + closing
- —
- Monthly P&I
- —
- Monthly cashflow
- —
- DSCR
- —
- Eligible?
- —
Personal DTI + credit; lowest rate.
DSCR
20% down · 8.5% · 30yr
- Down + closing
- —
- Monthly P&I
- —
- Monthly cashflow
- —
- DSCR
- —
- Eligible?
- —
No personal income docs; deal must DSCR.
Hard money
10% down · 12.0% · 12mo
- Down + closing
- —
- Monthly P&I
- —
- Monthly cashflow
- —
- DSCR
- —
- Eligible?
- —
Short-term bridge; refi at stabilization.
Rent comps 9 comps
| Address | Beds | Baths | Sqft | Rent | $/sqft | DOM | Units | Dist |
|---|---|---|---|---|---|---|---|---|
| 4610 Elk Springs Ave Apt D Las Vegas, NV | 2.0 | 2.0 | 3688 | $1,250 | $0.34 | 44d | 1 | 0.22mi |
| 4744 W Twain Ave Apt C Las Vegas, NV | 2.0 | 2.0 | 3688 | $1,200 | $0.33 | 44d | 1 | 0.23mi |
| 3649 S Van Dyke Ave Unit C Las Vegas, NV | 2.0 | 2.0 | 3688 | $1,100 | $0.30 | 44d | 1 | 0.28mi |
| 4744 W Sand Creek Ave Unit C Las Vegas, NV | 2.0 | 2.0 | 3688 | $1,250 | $0.34 | 44d | 1 | 0.30mi |
| 4381 W Flamingo Rd Las Vegas, NV | 4.0 | 1.0–4.5 | 3300 | $21,200 | $6.42 | 5d | 8 | 0.47mi |
| 5456 Cabeza Dr Unit B Las Vegas, NV | 2.0 | 2.0 | 4208 | $1,175 | $0.28 | 44d | 1 | 0.93mi |
| 5376 Retablo Ave Unit 2 Las Vegas, NV | 2.0 | 2.0 | 3792 | $1,350 | $0.36 | 44d | 1 | 0.98mi |
| 2781 Eldora Cir Unit B Las Vegas, NV | 2.0 | 2.0 | 3744 | $1,200 | $0.32 | 44d | 1 | 1.36mi |
| 4575 Dean Martin Dr #3304 Las Vegas, NV | 3.0 | 3.5 | 5122 | $11,500 | $2.25 | 44d | 1 | 1.45mi |
Listing history 3 events
-
2026-05-26$65,000 Active
-
1998-07-20soldstatus $1,600,000
-
1974-07-01soldstatus $1,600,000
ⓘ Source: listings_history table (triggers on properties + properties_extension) + one-shot
backfill from property_details.listing_events for pre-trigger history.
Climate risk First Street
- Heat 8/10 Severe
- Air quality 3/10 Moderate 2 unhealthy d/yr today · 3 by 30 yrs out
Nearby sold comps map
Loading sold comps map…
Walkable amenities ~0.75 mi
Loading nearby amenities…
Taxation est. · year 1
- Rental income
- $15,276
- − Mortgage interest
- −$3,641
- − Property taxes
- −$975
- − Insurance
- −$325
- − Repairs & maintenance
- −$1,222
- − Management
- −$1,222
- − Depreciation
- −$1,891
- Taxable income
- $6,000
- Est. tax owed @ 24.0%
- −$1,440
- After-tax cash flow
- $5,238/yr
For passive investors: Depreciation is non-cash, so a rental often shows a tax loss while cash-flowing — sheltering income. Rental losses are passive: they offset passive income freely, and up to $25,000/yr can offset ordinary (W-2) income if you actively participate and your MAGI is under $100k (phasing out to $0 by $150k); unused losses carry forward. On sale, claimed depreciation is recaptured at up to 25%, and gains may owe capital-gains tax (a 1031 exchange can defer both). Figures are a year-1 estimate at your 24.0% rate — not tax advice; consult a CPA.
Schools (NCES district)
- District
- Clark County School District
- NCES district ID
- 3200060
- Math proficiency
- 21% ▼ -13.00%
- Reading proficiency
- 39% ▼ -8.00%
- Median HH income
- $53,611
- Composite
- 26.48/100
- National rank
- #7211
- State rank
- #11 of 17 in NV
Livability — Paradise
- Score
- 76/100
- State rank
- #10
- US rank
- #3494
Category grades
Schools grade is shown separately in the Schools card above.
Census & demographics
- Census place
- Paradise, NV
- County
- Clark County · 2,306,105 people
- City population
- 227,885
- Metro
- Las Vegas-Henderson-Paradise, NV
- Population (ZIP)
- 49,041
- Household income
- $48,901
- Rent vs Own
- Severe rent burden
- 4029.0
Population outlook (Clark County) Hauer SSP2
- Today (2025)
- 2,504,101 people
- By 2030
- 2,693,770 · +7.6%
- By 2040
- 3,061,208 · +22.2%
- By 2050
- 3,400,072 · +35.8%
- By 2075
- 4,139,522 · +65.3%
- By 2100
- 4,596,916 · +83.6%
Race, ethnicity, and origin ACS 2023
- Neighborhood character
- Highly diverse neighborhood (Simpson 0.74)
- Race & ethnicity
- Hispanic / Latino 37% White 29% Two or more races 17% Asian 14% Black 14%
- Hispanic origin (detail)
- Mexican 26% Puerto Rican 1% Cuban 2%
- Common ancestry
- Slovak 1% Portuguese 1% Romanian 1%
- Foreign-born
- 35% · Canada, China, South Korea
- Languages at home
- 52% English-only · Spanish 29% Tagalog/Filipino 5% Chinese 3%
Political lean MEDSL · Clark
- 2024 margin
- Toss-up / Even · D 50.4% · R 47.8% · Other 1.7%
- 2008→2024 swing
- -16.5pp toward R · 2008: 19.1pp · 2024: 2.6pp
- All cycles
- 2024: D+2.6 2020: D+9.3 2016: D+10.7 2012: D+14.5 2008: D+19.1
Not yet ingested
- Civics
- —
Market trends
- HPI YoY
- ▼ -226.11%
- Current HPI
- 252.2496
- Rent YoY
- ▼ -0.16%
- Metro
- Las Vegas-Henderson-Paradise, NV
- State GDP YoY
- ▲ 3.08%
- F500 in state
- 6
Industry mix (Fortune 500 HQ in NV)
| Industry | F500 HQs | Revenue |
|---|---|---|
| Hotels / Casinos | 3 | $36B |
|
||
Price history
-95.9% since first listed3 events — show timeline
- 2026-05-26 Listed $65,000 FSBO.com
- 1998-07-20 Sold (Public Records) $1,600,000 Public Records
- 1974-07-01 Sold (Public Records) $1,600,000 Public Records
Property tax history
+6.6%/yrLatest (2025): $100,241 · +8.0% YoY. Source: county tax records.
Cash-flow waterfall
monthlySold comps — $/sqft
last 12 mo · ≤1 miLoading sold comps…