1950 E Valencia Dr · Bartow, FL
Flood risk 1/10 · Minimal
- FEMA flood zone
- X (unshaded)
- Chance of flooding over 30 yrs
- 0.0%
- Est. flood insurance / yr
- $507 – $1,088
Fire risk 3/10 · Minor
- Est. fire insurance / yr
- $947 – $1,759
Heat risk 8/10 · Major
- Hot days now (above 108°F)
- 7 days/yr
- Hot days in 30 yrs
- 25 days/yr
Wind risk 10/10 · Severe
- Chance of severe wind over 30 yrs
- 99.0%
Air-quality risk 2/10 · Minimal
- Unhealthy air days now
- 2 days/yr
- Unhealthy air days in 30 yrs
- 2 days/yr
Risk factors via First Street. Map © Google.
Why this score? — see what drove the D grade
The composite is a weighted blend of 9 inputs, each scored 0–100. Each bar is that input's sub-score; the figure is the points it added to the 100-point composite (weight × sub-score).
- Cash flow +13.6/30.0
- ARV discount +7.5/15.0
- DSCR +4.1/10.0
- 1% rule +3.8/10.0
- Schools +3.5/10.0
- Livability +3.4/5.0
- Rent growth +3.2/5.0
- Condition / age +2.5/5.0
- Appreciation +0.0/10.0
$167,000
🖨 Deal sheet 📄 Offer letter ✓ Due diligence
Listing remarks
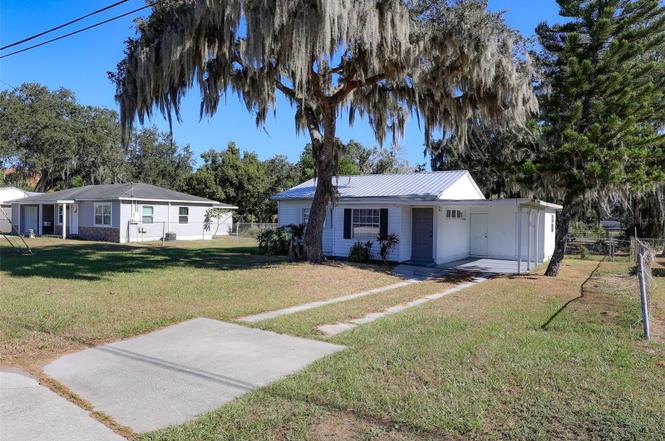
Under contract-accepting backup offers. 1950 E Valencia Drive in Bartow, Florida, is a charming 3-bedroom, 1-bath starter home featuring a newer metal roof and a fully fenced rear yard with a gate for easy access. Its convenient location places you just minutes from Mary Holland Park, the Bartow Public Library, the Bartow Civic Center, and Mosaic Park, offering plenty of recreation and community amenities nearby. This well-situated property is an excellent opportunity for first-time buyers or anyone seeking a comfortable home close to everything Bartow has to offer.
Key facts
- Easy access gate
- Convenient location
- Newer metal roof
Tags
Property features AI
Finance
- Other: Lot approximately 0.18 acre (about 0 to less than 1/4 acre); Chain link fencing
- Financial info: No lease restrictions indicated
Exterior
- Parking: Carport (1 space)
- Utilities: Public water; Public sewer; High-speed internet available; Electricity available and connected
- Home design: Single family residence; One story; Faces west; Residential zoning (R-1)
- Construction: Vinyl siding and frame construction; Metal roof; Slab foundation; Built with approximately 1,063 total building area (public records)
- Exterior features: Private mailbox; Paved road access
Interior
- Kitchen: Microwave; Range; Range hood; Refrigerator
- Bedrooms: 3 bedrooms
- Flooring: Ceramic tile; Laminate
- Bathrooms: 1 full bathroom
- Heating & cooling: Electric heating; Central air conditioning
- Interior features: Ceiling fans; Five total rooms
- Laundry & utility: Washer hookup
Neighborhood map
What this means for you Summary
Snapshot
- This is a 3-bed/1.0-bath single-family listed at $167k.
Deal economics
- At list price, monthly cash flow is $9 ($112/yr) — positive.
- The deal already cash-flows at list — no discount required.
- To meet the 1% rule (rent ≥ 1% of price), the offer needs to be $148k (11.6% below list).
- Recommended offer: $147k (12.0% below list) — sets the bar for market timing.
Location & tenants
- Location reads 68/100 on livability (#526 in FL) — a middle-class / working-renter tenant base. Strengths: cost of living A+, housing A+; Watch: employment C-, crime D-, amenities F.
- Polk (suburban): math 39% / reading 43% proficiency, ranked #62 of 73 in FL (top 85%) — families likely to look elsewhere, expect single-tenant / working-renter base with shorter leases.
- Market conditions: Rents rising (+2.7%/yr); 386 active listings in the ZIP; 3 comparable units currently listed for rent nearby; rentals at typical pace (median 24d on market — plan ~3-4 weeks tenant-placement turnaround); 10,384 units permitted in Polk County in 2024 (1,716 in 5+ unit buildings).
Forward outlook
- Local home prices are declining (-3.0%/yr); year-one equity from $1k of loan paydown is wiped out by about $5k of value loss. Plan a longer hold.
- Polk County population projected at +33% by 2050 — long-run rental-demand tailwind backs the buy-and-hold thesis.
Negotiation context
- It's been on market 195 days — a 12% lower offer ($147k) is reasonable based on typical stale-listing flexibility.
- 2 sale attempts; this cycle's ask has dropped $18k (10%) from the opening price — seller is motivated, your offer sets the floor, not the list.
- Current owner paid $47k; list at $167k implies a 255% gain — meaningful room to come down on a strong offer.
Risks & watch-outs
- Watch-outs: built in 1954 — expect roof / HVAC / electrical / plumbing capex.
- Climate carrying-cost: severe wind risk, 99% chance of damaging wind over 30y; extreme-heat days projected 7→25/yr by 2055 (HVAC capex compounding) — expect insurance premiums to compound above CPI over the hold.
Questions for the listing agent
- It's been on market 195 days. Have you received any prior offers? Is the seller open to a 12% concession, seller financing, or rate buy-down credit?
- Built in 1954 — when were the roof, HVAC, electrical panel, plumbing, and water heater last replaced?
- Why hasn't it sold? Are there any deal-killer items the seller is aware of (foundation, flood, title, zoning, code violations)?
- Is there a deadline driving the sale (1031 exchange, divorce, estate, relocation)? That informs how much negotiation room exists.
- Crime grade is D in this area — have there been break-ins, vandalism, or insurance claims at this property in the last 3 years? What carrier currently insures it and at what premium?
- The area grade is low — what's the realistic commute time and amenity access for the typical tenant pool here? Any planned neighborhood developments (good or bad) we should know about?
- What's the average days-on-market for RENTAL listings here right now (not sales)? A rising rental-DOM trend means longer vacancies and softer asking-rent achievability than the comps imply.
- What's the recent tenant-quality profile in this submarket — average credit score on applications, eviction rate, late-payment / NSF rate, and stable-employment percentage? A property-management company in the area should have these aggregated.
- How much new for-sale + rental construction is in the pipeline within 1–3 miles? Heavy new supply typically softens prices + rents 12–24 months out; constrained supply supports both.
Investment metrics
- 1% rule
- 0.88% ✗
- Cap rate
- 6.36%
- Cash-on-cash
- 0.24%
- DSCR
- 1.01
- GRM
- 9.4
CMA / ARV
No comps found within radius.
Projected returns pro-forma
-3.0% appreciation · 2.72% rent growth · sell at horizon
- IRR
- -16.2%
- Equity multiple
- 0.43×
- Total profit
- $-26,855
- Equity at exit
- $24,900
- IRR
- -8.4%
- Equity multiple
- 0.48×
- Total profit
- $-24,212
- Equity at exit
- $14,439
Cash invested: $46,760 (down + closing). Projections, not guarantees.
Landlord ↔ Tenant lean methodology
- Overall (STATE)
- 87 Strongly Landlord-Friendly
- State Florida
- 87 Strongly Landlord-Friendly · R+3
- County
- — inherits STATE
- City
- — inherits STATE
ZIP-level market 33830
- Home prices YoY
- -19.8%
- Rents YoY
- 2.7%
- Active inventory
- 386
- Price-to-rent
- 9.4×
Monthly cashflow live
- Estimated rent
- $1,476 medium interval (Pro) →
- Mortgage (P&I)
- −$876
- Tax from tax record
- −$211 /mo · $2,538/yr
- Insurance
- −$70
- HOA
- −$0
- Vacancy / Maint / Mgmt
- −$310
- Net cashflow
- $9
Break-even live
UW: 25.0% down · 7.5% · 30yr · 1.5% tax · 5.0% vac · 8.0% maint · 8.0% mgmt
Financing live
Cash to close
- Down payment
- $41,750
- Closing costs
- $5,010
- Reserves months
- —
- Total cash needed
- —
Loan-product check · same deal, 3 products live
Conventional
25% down · 7.5% · 30yr
- Down + closing
- —
- Monthly P&I
- —
- Monthly cashflow
- —
- DSCR
- —
- Eligible?
- —
Personal DTI + credit; lowest rate.
DSCR
20% down · 8.5% · 30yr
- Down + closing
- —
- Monthly P&I
- —
- Monthly cashflow
- —
- DSCR
- —
- Eligible?
- —
No personal income docs; deal must DSCR.
Hard money
10% down · 12.0% · 12mo
- Down + closing
- —
- Monthly P&I
- —
- Monthly cashflow
- —
- DSCR
- —
- Eligible?
- —
Short-term bridge; refi at stabilization.
Rent comps 3 comps
| Address | Beds | Baths | Sqft | Rent | $/sqft | DOM | Units | Dist |
|---|---|---|---|---|---|---|---|---|
| 1290 Henson Ln Bartow, FL | 2.0 | 1.0 | 743 | $850 | $1.14 | 12d | 1 | 0.80mi |
| 1715 1/2 Martin Luther King Junior Blvd Bartow, FL | 2.0 | 1.0 | 624 | $1,200 | $1.92 | 23d | 1 | 1.42mi |
| 1715 Martin Luther King Jr Blvd Bartow, FL | 2.0 | 1.0 | 624 | $1,200 | $1.92 | 23d | 1 | 1.43mi |
Listing history 11 events
-
2026-06-18days on market $167,000 Active 195 DOM
-
2026-06-17days on market $167,000 Active 194 DOM
-
2026-06-16days on market $167,000 Active 193 DOM
-
2026-06-15days on market $167,000 Active 192 DOM
-
2026-06-13days on market $167,000 Active 190 DOM
-
2026-06-10statusdays on market $167,000 Active 187 DOM
-
2026-01-13status Active
-
2026-01-08status Pending
-
2025-12-31price $167,000
-
2025-11-14$185,000 Active
-
2001-08-08soldstatus $47,000
ⓘ Source: listings_history table (triggers on properties + properties_extension) + one-shot
backfill from property_details.listing_events for pre-trigger history.
Tax reassessment forecast FL · Resets to sale price
- Current annual tax
- $2,538 · $211/mo
- Projected year-2 tax
- $2,538 · $211/mo
- Expected delta
- $0/yr ($0/mo · 0.0%)
ⓘ Screening estimate from a state-policy table — verify with the county assessor before closing.
Climate risk First Street
- Flood 1/10 Low FEMA zone X (unshaded) · 0% chance over 30 yrs
- Wildfire 3/10 Moderate
- Heat 8/10 Severe 7 d/yr ≥108°F today · 25 d/yr by 30 yrs out
- Wind 10/10 Extreme 99% chance of damaging wind over 30 yrs
- Air quality 2/10 Low 2 unhealthy d/yr today · 2 by 30 yrs out
Nearby sold comps map
Loading sold comps map…
Walkable amenities ~0.75 mi
Loading nearby amenities…
Taxation est. · year 1
- Rental income
- $17,715
- − Mortgage interest
- −$9,355
- − Property taxes
- −$2,538
- − Insurance
- −$835
- − Repairs & maintenance
- −$1,417
- − Management
- −$1,417
- − Depreciation
- −$4,858
- Taxable loss
- −$2,705
- Est. tax savings @ 24.0%
- +$649
- After-tax cash flow
- $762/yr
For passive investors: Depreciation is non-cash, so a rental often shows a tax loss while cash-flowing — sheltering income. Rental losses are passive: they offset passive income freely, and up to $25,000/yr can offset ordinary (W-2) income if you actively participate and your MAGI is under $100k (phasing out to $0 by $150k); unused losses carry forward. On sale, claimed depreciation is recaptured at up to 25%, and gains may owe capital-gains tax (a 1031 exchange can defer both). Figures are a year-1 estimate at your 24.0% rate — not tax advice; consult a CPA.
Schools (NCES district)
- District
- Polk
- NCES district ID
- 1201590
- Math proficiency
- 39% ▼ -11.00%
- Reading proficiency
- 43% ▼ -4.00%
- Median HH income
- $43,979
- Composite
- 34.74/100
- National rank
- #5132
- State rank
- #62 of 73 in FL
Livability — Bartow
- Score
- 68/100
- State rank
- #526
- US rank
- #9835
Category grades
Schools grade is shown separately in the Schools card above.
Census & demographics
- Census place
- Bartow, FL
- County
- Polk County · 740,051 people
- City population
- 33,740
- Metro
- Lakeland-Winter Haven, FL
- Population (ZIP)
- 33,740
- Household income
- $63,918
- Rent vs Own
- Severe rent burden
- 681.0
Population outlook (Polk County) Hauer SSP2
- Today (2025)
- 752,975 people
- By 2030
- 804,621 · +6.9%
- By 2040
- 906,117 · +20.3%
- By 2050
- 1,000,476 · +32.9%
- By 2075
- 1,197,520 · +59.0%
- By 2100
- 1,271,518 · +68.9%
Race, ethnicity, and origin ACS 2023
- Neighborhood character
- Diverse neighborhood (Simpson 0.62)
- Race & ethnicity
- White 55% Hispanic / Latino 22% Black 18% Two or more races 13% Asian 2%
- Hispanic origin (detail)
- Mexican 13% Puerto Rican 5%
- Common ancestry
- Italian 3% Slovak 1% Lithuanian 1%
- Foreign-born
- 8% · Canada
- Languages at home
- 81% English-only · Spanish 17% Other Indo-European 1% Other Asian/Pacific 1%
Political lean MEDSL · Polk
- 2024 margin
- Strong R (+20.7) · D 39.2% · R 59.9%
- 2008→2024 swing
- -14.6pp toward R · 2008: -6.1pp · 2024: -20.7pp
- All cycles
- 2024: R+20.7 2020: R+14.4 2016: R+14.1 2012: R+6.8 2008: R+6.1
Not yet ingested
- Civics
- —
Market trends
- HPI YoY
- ▼ -82.47%
- Current HPI
- 333.3392
- Rent YoY
- ▲ 2.72%
- Metro
- Lakeland-Winter Haven, FL
- State GDP YoY
- ▲ 3.28%
- F500 in state
- 36
Industry mix (Fortune 500 HQ in FL)
| Industry | F500 HQs | Revenue |
|---|---|---|
| Industrial Technology | 2 | $29B |
|
||
| Insurance | 2 | $17B |
|
||
| Retail | 1 | $60B |
|
||
| Technology Distribution | 1 | $58B |
|
||
| Homebuilding | 1 | $35B |
|
||
| Technology Manufacturing | 1 | $35B |
|
||
Price history
+255.3% since first listed5 events — show timeline
- 2026-01-13 Relisted — Stellar MLS as Distributed by MLS Grid
- 2026-01-08 Pending — Stellar MLS as Distributed by MLS Grid
- 2025-12-31 Price Changed $167,000 Stellar MLS as Distributed by MLS Grid
- 2025-11-14 Listed $185,000 Stellar MLS as Distributed by MLS Grid
- 2001-08-08 Sold (Public Records) $47,000 Public Records
Property tax history
+49.1%/yrLatest (2025): $2,538 · +7.1% YoY. Source: county tax records.
Cash-flow waterfall
monthlySold comps — $/sqft
last 12 mo · ≤1 miLoading sold comps…