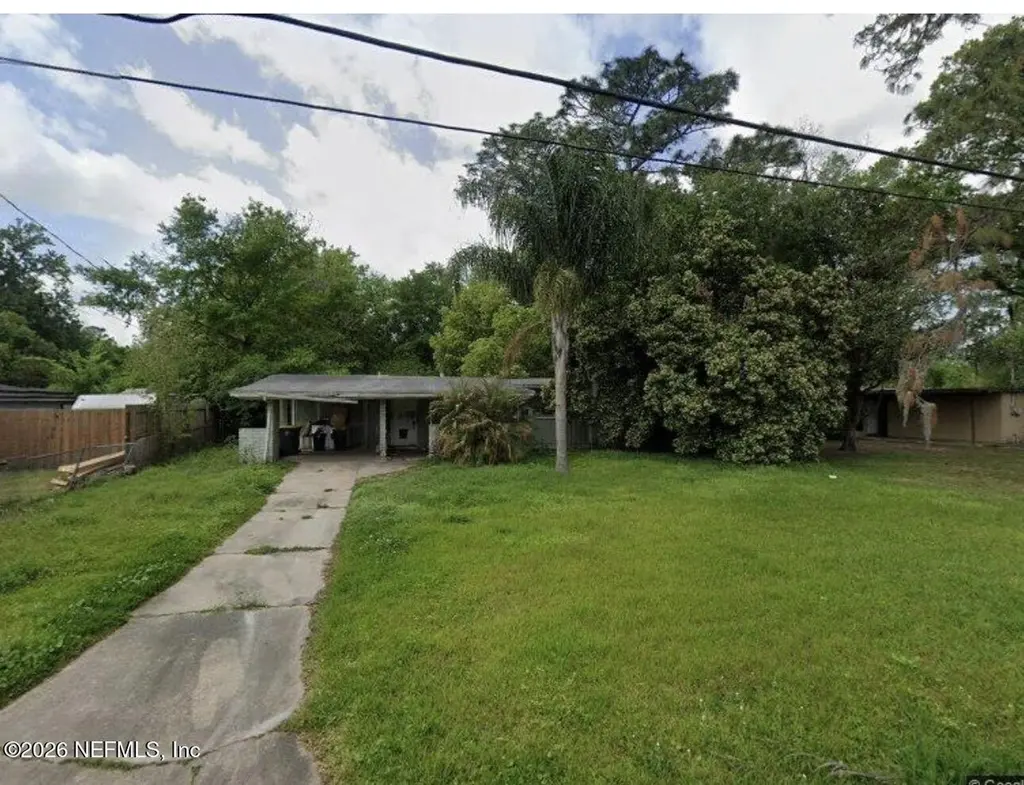
1060 La Marche Dr · Jacksonville, FL
Flood risk 1/10 · Minimal
- FEMA flood zone
- X (unshaded)
- Chance of flooding over 30 yrs
- 0.0%
- Est. flood insurance / yr
- $507 – $1,088
Fire risk 2/10 · Minimal
- Est. fire insurance / yr
- $947 – $1,759
Heat risk 8/10 · Major
- Hot days now (above 107°F)
- 7 days/yr
- Hot days in 30 yrs
- 20 days/yr
Wind risk 9/10 · Severe
- Chance of severe wind over 30 yrs
- 99.0%
Air-quality risk 5/10 · Moderate
- Unhealthy air days now
- 6 days/yr
- Unhealthy air days in 30 yrs
- 7 days/yr
Risk factors via First Street. Map © Google.
Why this score? — see what drove the B grade
The composite is a weighted blend of 9 inputs, each scored 0–100. Each bar is that input's sub-score; the figure is the points it added to the 100-point composite (weight × sub-score).
- Cash flow +30.0/30.0
- DSCR +10.0/10.0
- 1% rule +9.5/10.0
- ARV discount +7.5/15.0
- Livability +4.2/5.0
- Schools +3.9/10.0
- Rent growth +2.9/5.0
- Condition / age +2.5/5.0
- Appreciation +0.0/10.0
$119,500
🖨 Deal sheet (PDF) 📄 Offer letter ✓ Due diligence
Listing remarks MLS
Beautiful home in established neighborhood, waiting for new memory's to cultivate. Brick fire place and porch to relax. One Year Home Warranty included. Security system.
Key facts
- Near dining
- Near shopping
- Major roadways
Tags
Property features AI
Finance
- HOA & community: Not a senior community
Exterior
- Parking: Carport (1 space)
- Utilities: Cable available
- Home design: Single-family residence
- Exterior features: No private pool; Residential use
Interior
- Bedrooms: 3 bedrooms
- Bathrooms: 2 full bathrooms
- Heating & cooling: Central heating; Central air conditioning
- Interior features: Other appliances (unspecified)
Neighborhood map
What this means for you Summary
Snapshot
- This is a 3-bed/2.0-bath single-family listed at $120k.
Deal economics
- At list price, monthly cash flow is $455 ($5k/yr) — positive.
- The deal already cash-flows at list — no discount required.
- Meets the 1% rule at list price ($2k rent vs $120k).
- Cap rate 10.9% vs local median 3.9% in Jacksonville — top-decile yield for the area; either an underpriced asset or a hidden risk that comps aren't pricing in. Stress-test before assuming the spread holds.
Location & tenants
- Location reads 83/100 on livability (#50 in FL, #911 nationally) — a professional / high-income tenant draw. Strengths: amenities A+, commute A+, housing A+.
- Duval (urban): math 46% / reading 45% proficiency, ranked #48 of 73 in FL (top 66%) — families likely to look elsewhere, expect single-tenant / working-renter base with shorter leases.
- Market conditions: Rents rising (+1.7%/yr); 318 active listings in the ZIP; 34 comparable units currently listed for rent nearby; rentals at typical pace (median 18d on market — plan ~3-4 weeks tenant-placement turnaround); 6,503 units permitted in Duval County in 2024 (1,131 in 5+ unit buildings).
- This rent runs 32% of the median local income ($65k/yr) — at the standard rent-burdened threshold; future hikes will face affordability resistance.
Forward outlook
- Local home prices are declining (-3.0%/yr); year-one equity from $826 of loan paydown is wiped out by about $4k of value loss. Plan a longer hold.
- Duval County population projected at +19% by 2050 — long-run rental-demand tailwind backs the buy-and-hold thesis.
- At projected returns (-3.0% appreciation + 1.7% rent growth), your $33k cash investment doubles in ~9 years — after that, you're playing with house money.
Negotiation context
- Only 6 days on market — expect competitive offers; lowballing is unlikely to land.
- 3 sale attempts since 19y ago; this cycle's ask is 5% above the opening price — seller raised mid-cycle; expect resistance to lowballs.
- Current owner paid $46k; list at $120k implies a 160% gain — meaningful room to come down on a strong offer.
Risks & watch-outs
- Watch-outs: built in 1956 — expect roof / HVAC / electrical / plumbing capex.
- Climate carrying-cost: severe wind risk, 99% chance of damaging wind over 30y; extreme-heat days projected 7→20/yr by 2055 (HVAC capex compounding) — expect insurance premiums to compound above CPI over the hold.
Questions for the listing agent
- Built in 1956 — when were the roof, HVAC, electrical panel, plumbing, and water heater last replaced?
- Is there a deadline driving the sale (1031 exchange, divorce, estate, relocation)? That informs how much negotiation room exists.
- Schools are B-rated — typically a magnet for longer-tenancy family renters. What's the average tenant stay here, and is there a school-zone premium baked into asking?
- What's the average days-on-market for RENTAL listings here right now (not sales)? A rising rental-DOM trend means longer vacancies and softer asking-rent achievability than the comps imply.
- What's the recent tenant-quality profile in this submarket — average credit score on applications, eviction rate, late-payment / NSF rate, and stable-employment percentage? A property-management company in the area should have these aggregated.
- How much new for-sale + rental construction is in the pipeline within 1–3 miles? Heavy new supply typically softens prices + rents 12–24 months out; constrained supply supports both.
Investment metrics
- 1% rule
- 1.45% ✓
- Cap rate
- 10.86%
- Cash-on-cash
- 16.30%
- DSCR
- 1.73
- GRM
- 5.7
CMA / ARV
- ARV (on-the-fly)
- $251,532
- Comps found
- 12
Show comp detail 12 sales within ~0.75 mi
| Address | Dist | Beds/Ba | Sqft | Sold | Price | $/sf | Match |
|---|---|---|---|---|---|---|---|
| 951 Grace Ter | 0.32mi | 3/2.0 | 1,559 (-5%) | 0mo | $265,000 | $170 | 76 |
| 1002 Cherbourg Ave E | 0.16mi | 4/2.0 (+1) | 1,543 (-6%) | 5mo | $237,200 | $154 | 73 |
| 6791 Grace Cir N | 0.43mi | 3/2.5 | 1,620 (-2%) | 4mo | $215,000 | $133 | 72 |
| 6791 Grace Ln | 0.34mi | 3/1.5 | 1,587 (-4%) | 10mo | $140,000 | $88 | 68 |
| 6845 Cherbourg Ave S | 0.13mi | 4/2.0 (+1) | 1,505 (-8%) | 8mo | $230,000 | $153 | 68 |
| 964 Grace Ter | 0.27mi | 3/2.5 | 1,792 (+9%) | 8mo | $290,000 | $162 | 64 |
| 6742 Grace Ln | 0.36mi | 3/2.0 | 1,759 (+7%) | 9mo | $145,000 | $82 | 64 |
| 1141 Le Brun Dr | 0.21mi | 4/2.0 (+1) | 1,759 (+7%) | 12mo | $306,020 | $174 | 63 |
| 913 Le Brun Dr | 0.32mi | 4/3.0 (+1) | 1,734 (+6%) | 8mo | $237,000 | $137 | 60 |
| 6922 Rollo Rd | 0.26mi | 3/1.0 | 1,400 (-15%) | 8mo | $189,900 | $136 | 52 |
| 6970 Deauville Rd | 0.41mi | 3/2.0 | 1,410 (-14%) | 11mo | $230,000 | $163 | 48 |
| 949 Granville Rd | 0.42mi | 3/1.0 | 1,425 (-13%) | 8mo | $197,000 | $138 | 48 |
Match score weights: distance 35% · size 25% · config 20% · recency 20%. Top-matched comps best support the ARV.
Projected returns pro-forma
-3.0% appreciation · 1.73% rent growth · sell at horizon
- IRR
- 5.8%
- Equity multiple
- 1.22×
- Total profit
- $7,474
- Equity at exit
- $17,818
- IRR
- 14.0%
- Equity multiple
- 2.06×
- Total profit
- $35,350
- Equity at exit
- $10,332
Cash invested: $33,460 (down + closing). Projections, not guarantees.
Landlord ↔ Tenant lean methodology
- Overall (STATE)
- 87 Strongly Landlord-Friendly
- State Florida
- 87 Strongly Landlord-Friendly · R+3
- County
- — inherits STATE
- City
- — inherits STATE
ZIP-level market 32205
- Rents YoY
- 1.7%
- Active inventory
- 318
- Price-to-rent
- 5.7×
Monthly cashflow live
- Estimated rent
- $1,737 high interval (Pro) →
- Mortgage (P&I)
- −$627
- Tax from tax record
- −$241 /mo · $2,898/yr
- Insurance
- −$50
- HOA
- −$0
- Vacancy / Maint / Mgmt
- −$365
- Net cashflow
- $455
Break-even live
Sensitivity live
| Price | -10% $522 | -5% $488 | +0% $455 | +5% $421 | +10% $387 |
|---|---|---|---|---|---|
| Rent | -10% $317 | -5% $386 | +0% $455 | +5% $523 | +10% $592 |
| Rate | -1.0pp $515 | -0.5pp $485 | base $455 | +0.5pp $424 | +1.0pp $392 |
UW: 25.0% down · 7.5% · 30yr · 1.5% tax · 5.0% vac · 8.0% maint · 8.0% mgmt
Financing live
Cash to close
- Down payment
- $29,875
- Closing costs
- $3,585
- Reserves months
- —
- Total cash needed
- —
Loan-product check · same deal, 3 products live
Conventional
25% down · 7.5% · 30yr
- Down + closing
- —
- Monthly P&I
- —
- Monthly cashflow
- —
- DSCR
- —
- Eligible?
- —
Personal DTI + credit; lowest rate.
DSCR
20% down · 8.5% · 30yr
- Down + closing
- —
- Monthly P&I
- —
- Monthly cashflow
- —
- DSCR
- —
- Eligible?
- —
No personal income docs; deal must DSCR.
Hard money
10% down · 12.0% · 12mo
- Down + closing
- —
- Monthly P&I
- —
- Monthly cashflow
- —
- DSCR
- —
- Eligible?
- —
Short-term bridge; refi at stabilization.
Rent comps 34 comps
| Address | Beds | Baths | Sqft | Rent | $/sqft | DOM | Units | Dist |
|---|---|---|---|---|---|---|---|---|
| 909 La Marche Dr Jacksonville, FL | 3.0 | 1.0 | 1326 | $1,600 | $1.21 | 21d | 1 | 0.19mi |
| 7010 Arques Rd Jacksonville, FL | 3.0 | 1.0 | 1428 | $1,595 | $1.12 | 15d | 1 | 0.20mi |
| 7010 Arques Rd Jacksonville, FL | 3.0 | 1.0 | 1428 | $1,595 | $1.12 | 12d | 1 | 0.20mi |
| 6781 Grace Ln Jacksonville, FL | 4.0 | 3.0 | 1296 | $2,300 | $1.77 | 25d | 1 | 0.35mi |
| 734 Bent Baum Rd Jacksonville, FL | 3.0 | 2.5 | 1725 | $1,650 | $0.96 | 25d | 1 | 0.57mi |
| 909 Westgate Dr Jacksonville, FL | 3.0 | 1.5 | 1051 | $1,595 | $1.52 | 5d | 1 | 0.67mi |
| 863 Westgate Dr Jacksonville, FL | 3.0 | 2.0 | 1287 | $1,800 | $1.40 | 18d | 1 | 0.72mi |
| 1116 Palisades Dr Jacksonville, FL | 3.0 | 2.0 | 1161 | $1,550 | $1.34 | 4d | 1 | 0.88mi |
| 1570 Lane Ave S Jacksonville, FL | 1.0–2.0 | 1.0–1.5 | 862 | $1,425 | $1.65 | 3d | 10 | 0.91mi |
| 6128 Hollow Ct Key Hollow Jacksonville, FL | 3.0 | 3.0 | 1492 | $1,800 | $1.21 | 25d | 1 | 0.94mi |
| 5710 Lenox Ave Jacksonville, FL | 1.0–4.0 | 1.0–2.0 | 988 | $1,299 | $1.31 | 25d | 1 | 0.99mi |
| 6161 Park St Jacksonville, FL | 3.0 | 2.0 | 1209 | $1,473 | $1.22 | 17d | 1 | 1.03mi |
| 5687 Atlee Ave Jacksonville, FL | 3.0 | 1.0 | 1130 | $1,350 | $1.19 | 25d | 1 | 1.06mi |
| 1209 Ellis Rd S Jacksonville, FL | 4.0 | 2.5 | 1665 | $1,698 | $1.02 | 17d | 1 | 1.08mi |
| 5671 Ellis Trace Dr Jacksonville, FL | 3.0 | 2.0 | 1197 | $1,595 | $1.33 | 25d | 1 | 1.09mi |
| 5647 Ellis Trace Dr Jacksonville, FL | 3.0 | 2.0 | 1200 | $1,595 | $1.33 | 16d | 1 | 1.12mi |
| 6037 Marsha Dr Jacksonville, FL | 3.0 | 1.0 | 1296 | $1,250 | $0.96 | 16d | 1 | 1.15mi |
| 7777 Normandy Blvd Jacksonville, FL | 1.0–3.0 | 1.0–2.0 | 1040 | $1,999 | $1.92 | 4d | 19 | 1.15mi |
| 1591 Lane Ave S Jacksonville, FL | 1.0–3.0 | 1.0–2.0 | 954 | $1,485 | $1.56 | 25d | 1 | 1.19mi |
| 214 Santa Barbara Ave Jacksonville, FL | 3.0 | 2.0 | 1127 | $1,308 | $1.16 | 16d | 1 | 1.19mi |
| 1289 Neva St Jacksonville, FL | 3.0 | 2.5 | 1509 | $1,585 | $1.05 | 25d | 1 | 1.23mi |
| 1485 Fouraker Rd Jacksonville, FL | 1.0–3.0 | 1.0–2.0 | 947 | $1,965 | $2.07 | 3d | 55 | 1.24mi |
| 1756 Lane Ave S Unit 1 Jacksonville, FL | 3.0 | 2.0 | 1254 | $1,399 | $1.12 | 9d | 1 | 1.24mi |
| 1252 Mull St Jacksonville, FL | 3.0 | 2.5 | 1509 | $1,496 | $0.99 | 17d | 1 | 1.27mi |
| 8054 Graff Ln Jacksonville, FL | 3.0 | 2.0 | 1117 | $1,699 | $1.52 | 3d | 1 | 1.29mi |
| 1303 Mull St Jacksonville, FL | 3.0 | 2.5 | 1409 | $1,725 | $1.22 | 25d | 1 | 1.34mi |
| 1335 Mull St Jacksonville, FL | 3.0 | 2.5 | 1409 | $1,725 | $1.22 | 25d | 1 | 1.36mi |
| 1128 Comanche St Jacksonville, FL | 4.0 | 2.5 | 1539 | $1,761 | $1.14 | 4d | 1 | 1.37mi |
| 1374 Lake Shore Blvd Jacksonville, FL | 4.0 | 2.0 | 1456 | $2,150 | $1.48 | 9d | 2 | 1.38mi |
| 7841 Mariner St Jacksonville, FL | 3.0 | 2.0 | 1209 | $1,625 | $1.34 | 18d | 1 | 1.40mi |
| 7847 Mariner St Jacksonville, FL | 3.0 | 2.0 | 1209 | $1,599 | $1.32 | 25d | 1 | 1.41mi |
| 5304 Attleboro St Unit NA Jacksonville, FL | 3.0 | 2.5 | 1987 | $1,900 | $0.96 | 25d | 1 | 1.41mi |
| 7810 Spring Branch Dr S Jacksonville, FL | 3.0 | 2.0 | 1284 | $1,960 | $1.53 | 3d | 1 | 1.43mi |
| 6039 Oracle Ct Unit 1 Jacksonville, FL | 3.0 | 2.5 | 2010 | $2,600 | $1.29 | 4d | 1 | 1.45mi |
Listing history 10 events
-
2026-04-29status Pending
-
2026-04-26price $119,500
-
2026-04-26status Active
-
2026-04-23status Pending
-
2026-04-20$113,900 Active
-
2016-12-29soldstatus $45,900
-
2008-02-19historical 170-char remark
Show marketing remark (170 chars)
Beautiful home in established neighborhood, waiting for new memory's to cultivate. Brick fire place and porch to relax. One Year Home Warranty included. Security system.
-
2007-08-19$154,900 170-char remark
Show marketing remark (170 chars)
Beautiful home in established neighborhood, waiting for new memory's to cultivate. Brick fire place and porch to relax. One Year Home Warranty included. Security system.
-
1990-07-01soldstatus $55,000
-
1981-12-23soldstatus $31,733
ⓘ Source: listings_history table (triggers on properties + properties_extension) + one-shot
backfill from property_details.listing_events for pre-trigger history.
Tax reassessment forecast FL · Resets to sale price
- Current annual tax
- $2,898 · $241/mo
- Projected year-2 tax
- $2,898 · $241/mo
- Expected delta
- $0/yr ($0/mo · 0.0%)
ⓘ Screening estimate from a state-policy table — verify with the county assessor before closing.
Climate risk First Street
- Flood 1/10 Low FEMA zone X (unshaded) · 0% chance over 30 yrs
- Wildfire 2/10 Low
- Heat 8/10 Severe 7 d/yr ≥107°F today · 20 d/yr by 30 yrs out
- Wind 9/10 Extreme 99% chance of damaging wind over 30 yrs
- Air quality 5/10 Major 6 unhealthy d/yr today · 7 by 30 yrs out
Nearby sold comps map
Loading sold comps map…
Walkable amenities ~0.75 mi
Loading nearby amenities…
Taxation est. · year 1
- Rental income
- $20,847
- − Mortgage interest
- −$6,694
- − Property taxes
- −$2,898
- − Insurance
- −$598
- − Repairs & maintenance
- −$1,668
- − Management
- −$1,668
- − Depreciation
- −$3,476
- Taxable income
- $3,846
- Est. tax owed @ 24.0%
- −$923
- After-tax cash flow
- $4,531/yr
For passive investors: Depreciation is non-cash, so a rental often shows a tax loss while cash-flowing — sheltering income. Rental losses are passive: they offset passive income freely, and up to $25,000/yr can offset ordinary (W-2) income if you actively participate and your MAGI is under $100k (phasing out to $0 by $150k); unused losses carry forward. On sale, claimed depreciation is recaptured at up to 25%, and gains may owe capital-gains tax (a 1031 exchange can defer both). Figures are a year-1 estimate at your 24.0% rate — not tax advice; consult a CPA.
Schools (NCES district)
- District
- Duval
- NCES district ID
- 1200480
- Math proficiency
- 46% ▼ -11.00%
- Reading proficiency
- 45% ▼ -4.00%
- Median HH income
- $48,987
- Composite
- 38.97/100
- National rank
- #4076
- State rank
- #48 of 73 in FL
Livability — Jacksonville
- Score
- 83/100
- State rank
- #50
- US rank
- #911
Category grades
Schools grade is shown separately in the Schools card above.
Census & demographics
- Census place
- Jacksonville, FL
- County
- Duval County · 1,015,274 people
- City population
- 979,034
- Metro
- Jacksonville, FL
- Population (ZIP)
- 29,148
- Household income
- $64,789
- Rent vs Own
- Severe rent burden
- 1398.0
Population outlook (Duval County) Hauer SSP2
- Today (2025)
- 1,013,010 people
- By 2030
- 1,059,228 · +4.6%
- By 2040
- 1,141,439 · +12.7%
- By 2050
- 1,205,258 · +19.0%
- By 2075
- 1,324,282 · +30.7%
- By 2100
- 1,319,620 · +30.3%
Race, ethnicity, and origin ACS 2023
- Neighborhood character
- Diverse neighborhood (Simpson 0.59)
- Race & ethnicity
- White 59% Black 21% Hispanic / Latino 11% Two or more races 7% Asian 3%
- Hispanic origin (detail)
- Mexican 3% Puerto Rican 4% Cuban 1%
- Common ancestry
- Slovak 3% Lithuanian 2% Romanian 2%
- Foreign-born
- 8% · Canada, Vietnam, Dominican Republic
- Languages at home
- 88% English-only · Spanish 8% Vietnamese 1% French/Haitian/Cajun 1%
Political lean MEDSL · Duval
- 2024 margin
- Toss-up / Even · D 48.7% · R 50.1% · Other 1.2%
- 2008→2024 swing
- +0.4pp no change · 2008: -1.9pp · 2024: -1.5pp
- All cycles
- 2024: R+1.5 2020: D+3.8 2016: R+1.5 2012: R+3.6 2008: R+1.9
Not yet ingested
- Civics
- —
Market trends
- HPI YoY
- ▼ -386.70%
- Current HPI
- 310.4566
- Rent YoY
- ▲ 1.73%
- Metro
- Jacksonville, FL
- State GDP YoY
- ▲ 3.28%
- F500 in state
- 36
Industry mix (Fortune 500 HQ in FL)
| Industry | F500 HQs | Revenue |
|---|---|---|
| Industrial Technology | 2 | $29B |
|
||
| Insurance | 2 | $17B |
|
||
| Retail | 1 | $60B |
|
||
| Technology Distribution | 1 | $58B |
|
||
| Homebuilding | 1 | $35B |
|
||
| Technology Manufacturing | 1 | $35B |
|
||
Price history
+276.6% since first listed10 events — show timeline
- 2026-04-29 Pending — realMLS
- 2026-04-26 Price Changed $119,500 realMLS
- 2026-04-26 Relisted — realMLS
- 2026-04-23 Pending — realMLS
- 2026-04-20 Listed $113,900 realMLS
- 2016-12-29 Sold (Public Records) $45,900 Public Records
- 2008-02-19 Listing Removed — realMLS
- 2007-08-19 Listed $154,900 realMLS
- 1990-07-01 Sold (Public Records) $55,000 Public Records
- 1981-12-23 Sold (Public Records) $31,733 Public Records
Property tax history
+9.1%/yrLatest (2025): $2,898 · +13.1% YoY. Source: county tax records.
Cash-flow waterfall
monthlySold comps — $/sqft
last 12 mo · ≤1 miLoading sold comps…