 🏗️ New Construction
Charleston Plan · Rendon, TX
Flood risk 1/10 · Minimal
- FEMA flood zone
- X (unshaded)
- Chance of flooding over 30 yrs
- 0.0%
- Est. flood insurance / yr
- $507 – $1,088
Fire risk 5/10 · Moderate
- Est. fire insurance / yr
- $1,222 – $2,270
Heat risk 7/10 · Major
- Hot days now (above 110°F)
- 7 days/yr
- Hot days in 30 yrs
- 25 days/yr
Wind risk 6/10 · Moderate
- Chance of severe wind over 30 yrs
- 27.0%
Air-quality risk 3/10 · Minor
- Unhealthy air days now
- 2 days/yr
- Unhealthy air days in 30 yrs
- 3 days/yr
Risk factors via First Street. Map © Google.
Why this score? — see what drove the B- grade
The composite is a weighted blend of 9 inputs, each scored 0–100. Each bar is that input's sub-score; the figure is the points it added to the 100-point composite (weight × sub-score).
- Cash flow +30.0/30.0
- 1% rule +10.0/10.0
- DSCR +10.0/10.0
- ARV discount +7.5/15.0
- Condition / age +4.0/5.0
- Livability +3.2/5.0
- Rent growth +2.9/5.0
- Schools +2.3/10.0
- Appreciation +0.0/10.0
$124,995
🖨 Deal sheet (PDF) 📄 Offer letter ✓ Due diligence
Listing remarks MLS
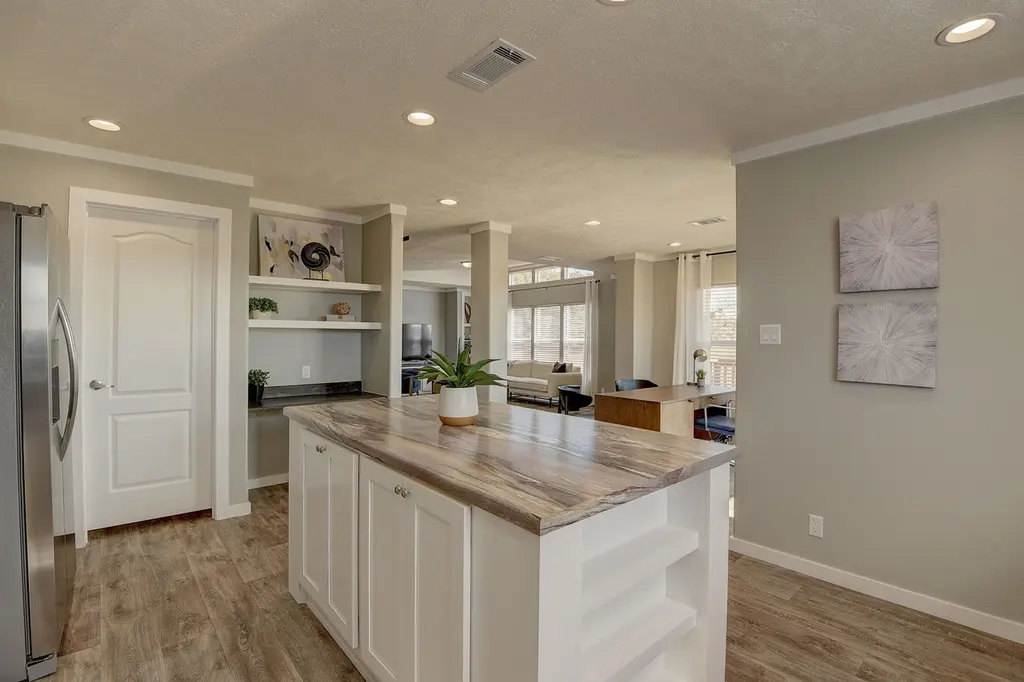
Welcome to this beautifully designed 3-bedroom, 2-bathroom home plan, offering 1,848 square feet of meticulously crafted living space. This home combines modern style with high-quality finishes and fast construction, allowing you to move in sooner than you think! Step into the spacious living room, perfect for relaxation or entertaining guests. The gourmet kitchen is a chef's dream, equipped with top-of-the-line appliances and ample counter space. The elegant master suite provides a tranquil retreat with a luxurious bathroom and a generous walk-in closet. Two additional bedrooms offer flexibility for family, guests, or a home office. Set in a peaceful neighborhood with excellent amenities, this home plan offers comfort, convenience, and a quick build time. Contact us today to learn more about making this home yours, with on-site financing options available!
Key facts
- Listed 60 days
Neighborhood map
What this means for you Summary
Snapshot
- This is a 3-bed/2.0-bath manufactured listed at $125k. Condition is rated good.
Deal economics
- At list price, monthly cash flow is $717 ($9k/yr) — positive.
- The deal already cash-flows at list — no discount required.
- Meets the 1% rule at list price ($2k rent vs $125k).
- Recommended offer: $117k (6.0% below list) — sets the bar for market timing.
- Cap rate 13.2% vs local median 2.3% in Rendon — top-decile yield for the area; either an underpriced asset or a hidden risk that comps aren't pricing in. Stress-test before assuming the spread holds.
Location & tenants
- Location reads 64/100 on livability (#759 in TX) — a middle-class / working-renter tenant base. Strengths: crime A+, employment A+, housing A+; Watch: schools F, amenities F, commute F.
- Everman ISD (suburban): math 21% / reading 32% proficiency, ranked #691 of 826 in TX (top 84%) — low school quality limits family demand, transient renter base, plan for 1-2y turnover; 77% free/reduced lunch — lower-income household profile, screen leases tightly.
- Market conditions: Rents rising (+1.8%/yr); 687 active listings in the ZIP; 40 comparable units currently listed for rent nearby; rentals leasing fast (median 14d on market — plan ~1-2 weeks tenant-placement turnaround); solid renter incomes; 18,938 units permitted in Tarrant County in 2024 (8,336 in 5+ unit buildings).
Forward outlook
- Local home prices are declining (-3.0%/yr); year-one equity from $864 of loan paydown is wiped out by about $4k of value loss. Plan a longer hold.
- Tarrant County population projected at +41% by 2050 — long-run rental-demand tailwind backs the buy-and-hold thesis.
- At projected returns (-3.0% appreciation + 1.8% rent growth), your $35k cash investment doubles in ~6 years — after that, you're playing with house money.
Negotiation context
- It's been on market 61 days — a 6% lower offer ($117k) is reasonable based on typical stale-listing flexibility.
Risks & watch-outs
- Climate carrying-cost: major wind risk, 27% chance of damaging wind over 30y; moderate wildfire risk; extreme-heat days projected 7→25/yr by 2055 (HVAC capex compounding) — expect insurance premiums to compound above CPI over the hold.
Questions for the listing agent
- It's been on market 61 days. Have you received any prior offers? Is the seller open to a 6% concession, seller financing, or rate buy-down credit?
- Why hasn't it sold? Are there any deal-killer items the seller is aware of (foundation, flood, title, zoning, code violations)?
- Is there a deadline driving the sale (1031 exchange, divorce, estate, relocation)? That informs how much negotiation room exists.
- Schools are F-rated, which usually means shorter tenancies and higher turnover. Who's the typical renter profile here, and what's been the actual vacancy rate?
- What's the average days-on-market for RENTAL listings here right now (not sales)? A rising rental-DOM trend means longer vacancies and softer asking-rent achievability than the comps imply.
- What's the recent tenant-quality profile in this submarket — average credit score on applications, eviction rate, late-payment / NSF rate, and stable-employment percentage? A property-management company in the area should have these aggregated.
- How much new for-sale + rental construction is in the pipeline within 1–3 miles? Heavy new supply typically softens prices + rents 12–24 months out; constrained supply supports both.
Investment metrics
- 1% rule
- 1.60% ✓
- Cap rate
- 13.18%
- Cash-on-cash
- 24.58%
- DSCR
- 2.09
- GRM
- 5.2
CMA / ARV
No comps found within radius.
Projected returns pro-forma
-3.0% appreciation · 1.78% rent growth · sell at horizon
- IRR
- 16.6%
- Equity multiple
- 1.66×
- Total profit
- $23,006
- Equity at exit
- $18,637
- IRR
- 24.2%
- Equity multiple
- 2.98×
- Total profit
- $69,231
- Equity at exit
- $10,807
Cash invested: $34,999 (down + closing). Projections, not guarantees.
Landlord ↔ Tenant lean methodology
- Overall (STATE)
- 87 Strongly Landlord-Friendly
- State Texas
- 87 Strongly Landlord-Friendly · R+5
- County
- — inherits STATE
- City
- — inherits STATE
ZIP-level market 76028
- Home prices YoY
- -33.4%
- Rents YoY
- 1.8%
- Active inventory
- 687
- Price-to-rent
- 5.2×
Monthly cashflow live
- Estimated rent
- $2,001 high interval (Pro) →
- Mortgage (P&I)
- −$655
- Tax est. 1.5%
- −$156 /mo · $1,875/yr
- Insurance
- −$52
- HOA
- −$0
- Vacancy / Maint / Mgmt
- −$420
- Net cashflow
- $717
Break-even live
Sensitivity live
| Price | -10% $803 | -5% $760 | +0% $717 | +5% $674 | +10% $630 |
|---|---|---|---|---|---|
| Rent | -10% $559 | -5% $638 | +0% $717 | +5% $796 | +10% $875 |
| Rate | -1.0pp $780 | -0.5pp $749 | base $717 | +0.5pp $684 | +1.0pp $652 |
UW: 25.0% down · 7.5% · 30yr · 1.5% tax · 5.0% vac · 8.0% maint · 8.0% mgmt
Financing live
Cash to close
- Down payment
- $31,249
- Closing costs
- $3,750
- Reserves months
- —
- Total cash needed
- —
Loan-product check · same deal, 3 products live
Conventional
25% down · 7.5% · 30yr
- Down + closing
- —
- Monthly P&I
- —
- Monthly cashflow
- —
- DSCR
- —
- Eligible?
- —
Personal DTI + credit; lowest rate.
DSCR
20% down · 8.5% · 30yr
- Down + closing
- —
- Monthly P&I
- —
- Monthly cashflow
- —
- DSCR
- —
- Eligible?
- —
No personal income docs; deal must DSCR.
Hard money
10% down · 12.0% · 12mo
- Down + closing
- —
- Monthly P&I
- —
- Monthly cashflow
- —
- DSCR
- —
- Eligible?
- —
Short-term bridge; refi at stabilization.
Rent comps 40 comps
| Address | Beds | Baths | Sqft | Rent | $/sqft | DOM | Units | Dist |
|---|---|---|---|---|---|---|---|---|
| 1800 Oak Grove Rd E Burleson, TX | 3.0–4.0 | 2.0 | 1392 | $1,795 | $1.29 | 0d | 14 | 0.15mi |
| 1680 Crested Way Fort Worth, TX | 3.0 | 2.0 | 1411 | $1,895 | $1.34 | 13d | 1 | 0.17mi |
| 1617 Crested Way Fort Worth, TX | 3.0 | 2.0 | 1411 | $2,200 | $1.56 | 44d | 1 | 0.23mi |
| 1644 Limpkin Dr Fort Worth, TX | 3.0 | 2.0 | 1402 | $1,860 | $1.33 | 44d | 1 | 0.28mi |
| 1616 Limpkin Dr Fort Worth, TX | 4.0 | 2.0 | 1600 | $1,980 | $1.24 | 25d | 1 | 0.30mi |
| 1612 Limpkin Dr Fort Worth, TX | 3.0 | 2.0 | 1411 | $1,925 | $1.36 | 44d | 1 | 0.30mi |
| 1633 Limpkin Dr Fort Worth, TX | 3.0 | 2.0 | 1266 | $1,905 | $1.50 | 44d | 1 | 0.32mi |
| 1461 Pine Ln Fort Worth, TX | 3.0 | 2.0 | 1268 | $1,739 | $1.37 | 8d | 1 | 0.41mi |
| 1424 Pine Ln Fort Worth, TX | 3.0 | 2.5 | 1332 | $1,590 | $1.19 | 13d | 1 | 0.43mi |
| 1433 Pine Ln Fort Worth, TX | 3.0 | 3.0 | 1316 | $2,075 | $1.58 | 44d | 1 | 0.44mi |
| 1408 Silver Spruce Ln Fort Worth, TX | 3.0 | 2.0 | 1411 | $1,800 | $1.28 | 19d | 1 | 0.51mi |
| 1432 Silver Oak Ln Fort Worth, TX | 4.0 | 3.0 | 1550 | $2,143 | $1.38 | 25d | 1 | 0.52mi |
| 10628 Wild Oak Dr Fort Worth, TX | 3.0 | 2.5 | 1312 | $1,740 | $1.33 | 4d | 1 | 0.55mi |
| 1312 Nelson Pl Burleson, TX | 3.0 | 2.0 | 1232 | $1,820 | $1.48 | 44d | 1 | 0.70mi |
| 1324 Sierra Blanca Dr Burleson, TX | 3.0 | 2.0 | 1541 | $2,000 | $1.30 | 44d | 1 | 0.76mi |
| 10213 S Race St Fort Worth, TX | 4.0 | 2.0 | 1819 | $1,961 | $1.08 | 23d | 1 | 0.81mi |
| 1421 Castle Ridge Rd Fort Worth, TX | 3.0 | 2.0 | 1268 | $1,815 | $1.43 | 0d | 1 | 0.81mi |
| 1412 Royal Meadows Trl Fort Worth, TX | 3.0 | 2.0 | 1576 | $1,779 | $1.13 | 3d | 1 | 0.88mi |
| 1209 Brownford Dr Burleson, TX | 3.0 | 2.0 | 1495 | $1,875 | $1.25 | 44d | 1 | 0.89mi |
| 1813 Vineridge Ln Burleson, TX | 3.0 | 2.5 | 2045 | $2,055 | $1.00 | 25d | 1 | 0.91mi |
| 1300 Hazelnut Dr Fort Worth, TX | 3.0 | 2.0 | 1448 | $2,300 | $1.59 | 6d | 1 | 0.94mi |
| 10613 Flamewood Dr Fort Worth, TX | 3.0 | 2.0 | 1324 | $1,550 | $1.17 | 44d | 1 | 0.98mi |
| 1832 Wickham Dr Burleson, TX | 3.0 | 2.0 | 1509 | $1,100 | $0.73 | 6d | 1 | 0.99mi |
| 10525 Flamewood Dr Fort Worth, TX | 3.0 | 2.0 | 1446 | $1,849 | $1.28 | 3d | 1 | 1.00mi |
| 10640 Towerwood Dr Fort Worth, TX | 3.0 | 2.0 | 1422 | $1,696 | $1.19 | 8d | 1 | 1.02mi |
| 10632 Towerwood Dr Fort Worth, TX | 3.0 | 2.0 | 1382 | $1,750 | $1.27 | 25d | 1 | 1.03mi |
| 812 Peaceful Brook Dr Fort Worth, TX | 3.0 | 2.0 | 1557 | $1,995 | $1.28 | 44d | 1 | 1.16mi |
| 10436 Phantom Hill Rd Fort Worth, TX | 3.0 | 2.0 | 1498 | $1,885 | $1.26 | 8d | 1 | 1.16mi |
| 1456 Palamedes Dr Fort Worth, TX | 3.0 | 2.0 | 1316 | $2,000 | $1.52 | 5d | 1 | 1.18mi |
| 757 Dema Ln Burleson, TX | 3.0 | 2.0 | 1432 | $1,869 | $1.31 | 3d | 1 | 1.22mi |
| 1421 Sunkiss Dr Fort Worth, TX | 3.0 | 2.0 | 1604 | $1,995 | $1.24 | 3d | 1 | 1.22mi |
| 916 Buffalo Springs Dr Fort Worth, TX | 3.0 | 2.0 | 1329 | $1,840 | $1.38 | 8d | 1 | 1.25mi |
| 741 Dema Ln Burleson, TX | 3.0 | 2.0 | 1447 | $2,000 | $1.38 | 25d | 1 | 1.26mi |
| 1401 Sunkiss Dr Fort Worth, TX | 3.0 | 2.0 | 1600 | $2,095 | $1.31 | 13d | 1 | 1.27mi |
| 1417 Palamedes Dr Fort Worth, TX | 4.0 | 2.5 | 2153 | $2,295 | $1.07 | 8d | 1 | 1.27mi |
| 9637 Sierra Grande Dr Fort Worth, TX | 4.0 | 2.5 | 2131 | $2,155 | $1.01 | 23d | 1 | 1.29mi |
| 9632 Sierra Grande Dr Fort Worth, TX | 3.0 | 2.0 | 1600 | $1,895 | $1.18 | 44d | 1 | 1.31mi |
| 1317 Woodwinds Dr Fort Worth, TX | 4.0 | 2.5 | 2131 | $2,400 | $1.13 | 13d | 1 | 1.33mi |
| 1540 Woodwinds Dr Fort Worth, TX | 4.0 | 2.0 | 1600 | $2,280 | $1.43 | 6d | 1 | 1.33mi |
| 9609 Sierra Grande Dr Fort Worth, TX | 4.0 | 2.0 | 1754 | $2,175 | $1.24 | 8d | 1 | 1.35mi |
Listing history 15 events
-
2026-06-21days on market $124,995 Active 61 DOM
-
2026-06-18days on market $124,995 Active 58 DOM
-
2026-06-17days on market $124,995 Active 57 DOM
-
2026-06-16days on market $124,995 Active 56 DOM
-
2026-06-15days on market $124,995 Active 55 DOM
-
2026-06-13days on market $124,995 Active 53 DOM
-
2026-06-09days on market $124,995 Active 49 DOM
-
2026-06-08days on market $124,995 Active 48 DOM
-
2026-06-07days on market $124,995 Active 47 DOM
-
2026-06-04days on market $124,995 Active 44 DOM
-
2026-06-03days on market $124,995 Active 43 DOM
-
2026-06-02days on market $124,995 Active 42 DOM
-
2026-06-01days on market $124,995 Active 41 DOM
-
2026-05-31days on market $124,995 Active 40 DOM
-
2026-04-22$124,995 Active 870-char remark
Show marketing remark (870 chars)
Welcome to this beautifully designed 3-bedroom, 2-bathroom home plan, offering 1,848 square feet of meticulously crafted living space. This home combines modern style with high-quality finishes and fast construction, allowing you to move in sooner than you think! Step into the spacious living room, perfect for relaxation or entertaining guests. The gourmet kitchen is a chef's dream, equipped with top-of-the-line appliances and ample counter space. The elegant master suite provides a tranquil retreat with a luxurious bathroom and a generous walk-in closet. Two additional bedrooms offer flexibility for family, guests, or a home office. Set in a peaceful neighborhood with excellent amenities, this home plan offers comfort, convenience, and a quick build time. Contact us today to learn more about making this home yours, with on-site financing options available!
ⓘ Source: listings_history table (triggers on properties + properties_extension) + one-shot
backfill from property_details.listing_events for pre-trigger history.
Climate risk First Street
- Flood 1/10 Low FEMA zone X (unshaded) · 0% chance over 30 yrs
- Wildfire 5/10 Major
- Heat 7/10 Severe 7 d/yr ≥110°F today · 25 d/yr by 30 yrs out
- Wind 6/10 Major 27% chance of damaging wind over 30 yrs
- Air quality 3/10 Moderate 2 unhealthy d/yr today · 3 by 30 yrs out
Nearby sold comps map
Loading sold comps map…
Walkable amenities ~0.75 mi
Loading nearby amenities…
Taxation est. · year 1
- Rental income
- $24,010
- − Mortgage interest
- −$7,002
- − Property taxes
- −$1,875
- − Insurance
- −$625
- − Repairs & maintenance
- −$1,921
- − Management
- −$1,921
- − Depreciation
- −$3,636
- Taxable income
- $7,031
- Est. tax owed @ 24.0%
- −$1,687
- After-tax cash flow
- $6,915/yr
For passive investors: Depreciation is non-cash, so a rental often shows a tax loss while cash-flowing — sheltering income. Rental losses are passive: they offset passive income freely, and up to $25,000/yr can offset ordinary (W-2) income if you actively participate and your MAGI is under $100k (phasing out to $0 by $150k); unused losses carry forward. On sale, claimed depreciation is recaptured at up to 25%, and gains may owe capital-gains tax (a 1031 exchange can defer both). Figures are a year-1 estimate at your 24.0% rate — not tax advice; consult a CPA.
Condition & rehab AI · 12 photos
This beautifully designed 3-bedroom, 2-bathroom home is move-in ready with modern finishes and ample living space. It offers a good condition score and minimal maintenance required.
Value-add opportunities
- Resale Painting the interior walls — Fresh paint can enhance the home's curb appeal and make it more inviting
- Rental Landscaping the front yard — A well-maintained front yard can attract more renters and increase rental value
Renovation cost estimate screening
Value-add ROI direction
- Resale Painting the interior walls — Fresh paint can enhance the home's curb appeal and make it more inviting ↑
- Rental Landscaping the front yard — A well-maintained front yard can attract more renters and increase rental value ↑
ⓘ Cost ranges are severity-bucket heuristics (US national rule-of-thumb). Get contractor quotes + a written scope before underwriting a rehab budget.
Schools (NCES district)
- District
- Everman ISD
- NCES district ID
- 4818810
- Math proficiency
- 21% ▼ -18.00%
- Reading proficiency
- 32% ▼ -4.00%
- Median HH income
- $44,803
- Composite
- 22.77/100
- National rank
- #8027
- State rank
- #691 of 826 in TX
Livability — Rendon
- Score
- 64/100
- State rank
- #759
- US rank
- #13917
Category grades
Schools grade is shown separately in the Schools card above.
Census & demographics
- Census place
- Rendon, TX
- County
- Johnson County · 147,987 people
- Metro
- Dallas-Fort Worth-Arlington, TX
- Population (ZIP)
- 81,549
- Household income
- $101,138
- Rent vs Own
- Severe rent burden
- 1117.0
Population outlook (Tarrant County) Hauer SSP2
- Today (2025)
- 2,380,417 people
- By 2030
- 2,578,900 · +8.3%
- By 2040
- 2,974,995 · +25.0%
- By 2050
- 3,350,489 · +40.8%
- By 2075
- 4,216,909 · +77.2%
- By 2100
- 4,741,527 · +99.2%
Race, ethnicity, and origin ACS 2023
- Neighborhood character
- Predominantly White (69%)
- Race & ethnicity
- White 69% Hispanic / Latino 19% Two or more races 11% Black 6% Asian 1%
- Hispanic origin (detail)
- Mexican 17%
- Common ancestry
- Lithuanian 2% Italian 2% Slovak 2%
- Foreign-born
- 5% · Canada
- Languages at home
- 88% English-only · Spanish 10% Other Indo-European 1%
Political lean MEDSL · Tarrant
- 2024 margin
- Lean R (+5.1) · D 46.7% · R 51.9% · Other 1.4%
- 2008→2024 swing
- +6.6pp toward D · 2008: -11.7pp · 2024: -5.1pp
- All cycles
- 2024: R+5.1 2020: D+0.2 2016: R+8.7 2012: R+15.7 2008: R+11.7
Not yet ingested
- Civics
- —
Market trends
- HPI YoY
- ▼ -141.44%
- Current HPI
- 282.466
- Rent YoY
- ▲ 1.78%
- Metro
- Dallas-Fort Worth-Arlington, TX
- State GDP YoY
- ▲ 3.95%
- F500 in state
- 110
Industry mix (Fortune 500 HQ in TX)
| Industry | F500 HQs | Revenue |
|---|---|---|
| Energy | 16 | $1,198B |
|
||
| Technology | 5 | $198B |
|
||
| Engineering / Construction | 4 | $72B |
|
||
| Energy Services | 3 | $60B |
|
||
| Utilities | 3 | $41B |
|
||
| Healthcare | 2 | $330B |
|
||
Price history
1 event — show timeline
- 2026-04-22 Listed $124,995 Zillow
Cash-flow waterfall
monthlySold comps — $/sqft
last 12 mo · ≤1 miLoading sold comps…