900 Century Dr #2 · Ogden, UT
Flood risk 5/10 · Moderate
- FEMA flood zone
- X (unshaded)
- Chance of flooding over 30 yrs
- 0.47%
- Est. flood insurance / yr
- $507 – $1,088
Fire risk 2/10 · Minimal
- Est. fire insurance / yr
- $453 – $841
Heat risk 4/10 · Minor
- Hot days now (above 94°F)
- 7 days/yr
- Hot days in 30 yrs
- 18 days/yr
Wind risk 1/10 · Minimal
- Chance of severe wind over 30 yrs
- —
Air-quality risk 4/10 · Minor
- Unhealthy air days now
- 4 days/yr
- Unhealthy air days in 30 yrs
- 5 days/yr
Risk factors via First Street. Map © Google.
Why this score? — see what drove the C+ grade
The composite is a weighted blend of 9 inputs, each scored 0–100. Each bar is that input's sub-score; the figure is the points it added to the 100-point composite (weight × sub-score).
- Cash flow +24.8/30.0
- 1% rule +10.0/10.0
- DSCR +8.0/10.0
- ARV discount +7.5/15.0
- Livability +4.2/5.0
- Rent growth +3.1/5.0
- Schools +2.4/10.0
- Condition / age +2.2/5.0
- Appreciation +0.0/10.0
$42,900
🖨 Deal sheet 📄 Offer letter ✓ Due diligence
Listing remarks
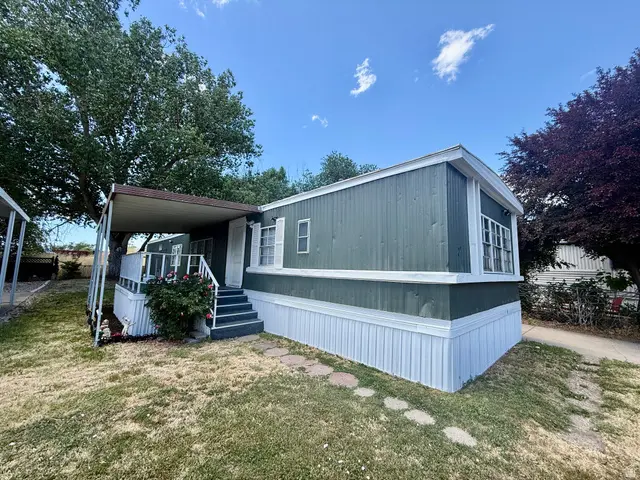
Charming and affordable mobile home offering a bright, functional layout with comfortable living spaces throughout. The open kitchen features black cabinetry, light countertops, stainless steel refrigerator, gas range, and updated flooring, with easy flow into the main living area. The spacious living room offers wood-look flooring, large windows giving warmth and character. Multiple bedrooms provide flexible space for sleeping, office use, hobbies, or storage. The home also includes a full bathroom/laundry combo with washer and dryer included, plus an additional half bath for added convenience. Outside, enjoy a covered porch entry, driveway parking, mature trees, and a manageable yard spac
Key facts
- Wood-look flooring
- Updated flooring
- Black cabinetry
Tags
Property features AI
Finance
- HOA & community: Homeowners association (Nellie) with monthly fee; Association fee covers grounds maintenance, sewer, trash and water; Community amenities include clubhouse, RV parking, playground, storage and snow removal; Pets permitted (rules apply), management and maintenance provided
Exterior
- Parking: One total parking space; One open parking space; Common RV parking
- Utilities: Natural gas connected; Electricity connected; Public sewer connected; Water connected (culinary)
- Home design: Mobile home style; Single-level living; Faces east
- Construction: Aluminum exterior; Membrane roof; Built/standing condition
- Exterior features: Covered deck; Covered patio; Open patio; Open porch; Exterior lighting; Landscaping (full)
Interior
- Kitchen: Range/oven (free standing); Refrigerator
- Bedrooms: Three main-level bedrooms
- Flooring: Carpet; Vinyl
- Bathrooms: One full bathroom; One partial/half bathroom
- Heating & cooling: Forced air gas central heating; Evaporative cooling
- Interior features: Free-standing range/oven; Blinds; Window coverings
- Laundry & utility: Washer; Dryer; Electric dryer hookup
Neighborhood map
What this means for you Summary
Snapshot
- This is a 3-bed/1.5-bath manufactured listed at $43k. Condition is rated fair.
Deal economics
- At list price, monthly cash flow is $90 ($1k/yr) — positive.
- The deal already cash-flows at list — no discount required.
- Meets the 1% rule at list price ($2k rent vs $43k).
Location & tenants
- Location reads 84/100 on livability (#19 in UT, #810 nationally) — a professional / high-income tenant draw. Strengths: amenities A+, commute A+, cost of living A+; Watch: crime F.
- Ogden City District (urban): math 25% / reading 31% proficiency, ranked #72 of 80 in UT (top 90%) — low school quality limits family demand, transient renter base, plan for 1-2y turnover; 75% free/reduced lunch — lower-income household profile, screen leases tightly.
- Zoned schools: Heritage School (math 21% / reading 25%, grade F, #501 of 585 statewide, top 86%, 638 students, 100% FRL); Highland Junior High (math 12% / reading 18%, grade F, #135 of 138 statewide, top 98%, 715 students, 0% FRL); Ben Lomond High (math 11% / reading 28%, grade F, #158 of 171 statewide, top 94%, 1,169 students, 44% FRL) — zoned schools average 48% FRL vs 75% district-wide (27 pts lower); this property's tenant base skews higher-income than the district average.
- Market conditions: Rents rising (+2.3%/yr); 611 active listings in the ZIP; 16 comparable units currently listed for rent nearby; rentals at typical pace (median 24d on market — plan ~3-4 weeks tenant-placement turnaround); solid renter incomes; 1,630 units permitted in Weber County in 2024 (521 in 5+ unit buildings).
Forward outlook
- Local home prices are declining (-3.0%/yr); year-one equity from $297 of loan paydown is wiped out by about $1k of value loss. Plan a longer hold.
- Weber County population projected at +24% by 2050 — long-run rental-demand tailwind backs the buy-and-hold thesis.
Negotiation context
- Only 9 days on market — expect competitive offers; lowballing is unlikely to land.
- 2 sale attempts with the ask held roughly flat each time — persistent listings suggest the price (not the market) is what's stuck; bring a comps-based counter.
Risks & watch-outs
- Watch-outs: HOA is 57% of rent.
- Climate carrying-cost: moderate flood risk — expect insurance premiums to compound above CPI over the hold.
Questions for the listing agent
- Have any recent inspections been done? Can we get a copy of the seller's disclosures and any deferred-maintenance estimates?
- Built in 1972 — when were the roof, HVAC, electrical panel, plumbing, and water heater last replaced?
- What does the HOA fee cover, when was the last increase, and are there any pending special assessments or reserve-fund shortfalls?
- Is there a deadline driving the sale (1031 exchange, divorce, estate, relocation)? That informs how much negotiation room exists.
- Crime grade is F in this area — have there been break-ins, vandalism, or insurance claims at this property in the last 3 years? What carrier currently insures it and at what premium?
- What's the average days-on-market for RENTAL listings here right now (not sales)? A rising rental-DOM trend means longer vacancies and softer asking-rent achievability than the comps imply.
- What's the recent tenant-quality profile in this submarket — average credit score on applications, eviction rate, late-payment / NSF rate, and stable-employment percentage? A property-management company in the area should have these aggregated.
- How much new for-sale + rental construction is in the pipeline within 1–3 miles? Heavy new supply typically softens prices + rents 12–24 months out; constrained supply supports both.
Investment metrics
- 1% rule
- 4.14% ✓
- Cap rate
- 8.82%
- Cash-on-cash
- 9.02%
- DSCR
- 1.40
- GRM
- 2.0
CMA / ARV
No comps found within radius.
Projected returns pro-forma
-3.0% appreciation · 2.33% rent growth · sell at horizon
- IRR
- -3.9%
- Equity multiple
- 0.86×
- Total profit
- $-1,740
- Equity at exit
- $6,397
- IRR
- 4.5%
- Equity multiple
- 1.31×
- Total profit
- $3,719
- Equity at exit
- $3,709
Cash invested: $12,012 (down + closing). Projections, not guarantees.
Landlord ↔ Tenant lean methodology
- Overall (STATE)
- 86 Strongly Landlord-Friendly
- State Utah
- 86 Strongly Landlord-Friendly · R+15
- County
- — inherits STATE
- City
- — inherits STATE
ZIP-level market 84404
- Rents YoY
- 2.3%
- Active inventory
- 611
- Price-to-rent
- 2.0×
Monthly cashflow live
- Estimated rent
- $1,778 high interval (Pro) →
- Mortgage (P&I)
- −$225
- Tax est. 1.5%
- −$54 /mo · $644/yr
- Insurance
- −$18
- HOA
- −$1,018
- Vacancy / Maint / Mgmt
- −$373
- Net cashflow
- $90
Break-even live
UW: 25.0% down · 7.5% · 30yr · 1.5% tax · 5.0% vac · 8.0% maint · 8.0% mgmt
Financing live
Cash to close
- Down payment
- $10,725
- Closing costs
- $1,287
- Reserves months
- —
- Total cash needed
- —
Loan-product check · same deal, 3 products live
Conventional
25% down · 7.5% · 30yr
- Down + closing
- —
- Monthly P&I
- —
- Monthly cashflow
- —
- DSCR
- —
- Eligible?
- —
Personal DTI + credit; lowest rate.
DSCR
20% down · 8.5% · 30yr
- Down + closing
- —
- Monthly P&I
- —
- Monthly cashflow
- —
- DSCR
- —
- Eligible?
- —
No personal income docs; deal must DSCR.
Hard money
10% down · 12.0% · 12mo
- Down + closing
- —
- Monthly P&I
- —
- Monthly cashflow
- —
- DSCR
- —
- Eligible?
- —
Short-term bridge; refi at stabilization.
Rent comps 16 comps
| Address | Beds | Baths | Sqft | Rent | $/sqft | DOM | Units | Dist |
|---|---|---|---|---|---|---|---|---|
| 1075 Century Dr Ogden, UT | 2.0 | 1.0–2.0 | 731 | $1,599 | $2.19 | 23d | 1 | 0.20mi |
| 407 W 12th St Ogden, UT | 2.0 | 1.0–2.0 | 694 | $1,650 | $2.38 | 23d | 1 | 0.35mi |
| 561 S 375 W Ogden, UT | 4.0 | 2.0 | 1112 | $2,200 | $1.98 | 14d | 1 | 0.38mi |
| 231 W 12th St Ogden, UT | 1.0–2.0 | 1.0–2.0 | 813 | $1,544 | $1.90 | 14d | 14 | 0.50mi |
| 1658 Gibson Ave Ogden, UT | 2.0 | 2.0 | 1057 | $1,800 | $1.70 | 21d | 1 | 0.82mi |
| 1690 S 250 W Ogden, UT | 1.0–3.0 | 1.0–2.5 | 1145 | $2,314 | $2.02 | 23d | 14 | 0.89mi |
| 940 Kiesel Ave Ogden, UT | 2.0 | 1.0 | 708 | $1,200 | $1.69 | 23d | 1 | 0.93mi |
| 348 8th St Ogden, UT | 2.0 | 1.0 | 1037 | $1,695 | $1.63 | 23d | 1 | 0.93mi |
| 324 14th St Ogden, UT | 2.0 | 2.0 | 936 | $1,495 | $1.60 | 23d | 1 | 1.02mi |
| 260 West Ogden, UT | 1.0–3.0 | 1.0–2.0 | 970 | $1,880 | $1.94 | 23d | 1 | 1.22mi |
| 455 2nd St Ogden, UT | 1.0–2.0 | 1.0–2.0 | 838 | $1,499 | $1.79 | 14d | 5 | 1.29mi |
| 462 Canyon Rd Ogden, UT | 2.0 | 1.0 | 900 | $930 | $1.03 | 23d | 1 | 1.32mi |
| 200 N Harrisville Rd Ogden, UT | 2.0 | 1.0 | 750 | $1,400 | $1.87 | 23d | 1 | 1.35mi |
| 381 N Washington Blvd Ogden, UT | 1.0–3.0 | 1.0–2.0 | 1062 | $1,683 | $1.58 | 14d | 15 | 1.41mi |
| 615 15th St Ogden, UT | 2.0 | 1.0 | 1097 | $1,000 | $0.91 | 23d | 1 | 1.46mi |
| 3022 S Jefferson Ave Ogden, UT | 2.0 | 1.0 | 675 | $1,350 | $2.00 | 21d | 1 | 1.49mi |
HOA detail
- Monthly dues
- $1,018 · $12,216/yr
- Likely covers
- gas
Listing history 8 events
-
2026-06-18days on market $42,900 Active 9 DOM
-
2026-06-17days on market $42,900 Active 8 DOM
-
2026-06-16days on market $42,900 Active 7 DOM
-
2026-06-15days on market $42,900 Active 6 DOM
-
2026-06-14days on market $42,900 Active 4 DOM
-
2026-06-13days on market $42,900 Active 3 DOM
-
2026-06-10remarks 699-char remark
-
2026-06-10$42,900 Active 1 DOM
ⓘ Source: listings_history table (triggers on properties + properties_extension) + one-shot
backfill from property_details.listing_events for pre-trigger history.
Climate risk First Street
- Flood 5/10 Major FEMA zone X (unshaded) · 47% chance over 30 yrs
- Wildfire 2/10 Low
- Heat 4/10 Moderate 7 d/yr ≥94°F today · 18 d/yr by 30 yrs out
- Wind 1/10 Low
- Air quality 4/10 Moderate 4 unhealthy d/yr today · 5 by 30 yrs out
Nearby sold comps map
Loading sold comps map…
Walkable amenities ~0.75 mi
Loading nearby amenities…
Taxation est. · year 1
- Rental income
- $21,338
- − Mortgage interest
- −$2,403
- − Property taxes
- −$644
- − Insurance
- −$214
- − Repairs & maintenance
- −$1,707
- − Management
- −$1,707
- − HOA
- −$12,216
- − Depreciation
- −$1,248
- Taxable income
- $1,199
- Est. tax owed @ 24.0%
- −$288
- After-tax cash flow
- $796/yr
For passive investors: Depreciation is non-cash, so a rental often shows a tax loss while cash-flowing — sheltering income. Rental losses are passive: they offset passive income freely, and up to $25,000/yr can offset ordinary (W-2) income if you actively participate and your MAGI is under $100k (phasing out to $0 by $150k); unused losses carry forward. On sale, claimed depreciation is recaptured at up to 25%, and gains may owe capital-gains tax (a 1031 exchange can defer both). Figures are a year-1 estimate at your 24.0% rate — not tax advice; consult a CPA.
Condition & rehab AI · 1 photo
A charming mobile home with good interior features but average exterior and interior paint. Moderate rehab is needed to improve curb appeal and property value.
Repairs flagged
- Moderate Exterior siding — Weathered and discolored
- Minor Interior paint — Faded in some areas
Value-add opportunities
- Both Painting interior walls — Enhances curb appeal and interior aesthetics
- Both Landscaping improvements — Enhances curb appeal and property value
- Both Exterior siding repair — Improves curb appeal and property value
Renovation cost estimate screening
| Repair item | Severity | Est. cost |
|---|---|---|
| Exterior siding · Weathered and discolored | Moderate | $3,000–15,000 |
| Interior paint · Faded in some areas | Minor | $500–3,000 |
| Total estimated repair cost · 2 items | $3,500–18,000 |
Value-add ROI direction
- Both Painting interior walls — Enhances curb appeal and interior aesthetics ↑
- Both Landscaping improvements — Enhances curb appeal and property value ↑
- Both Exterior siding repair — Improves curb appeal and property value ↑
ⓘ Cost ranges are severity-bucket heuristics (US national rule-of-thumb). Get contractor quotes + a written scope before underwriting a rehab budget.
Schools (NCES district)
- District
- Ogden City District
- NCES district ID
- 4900720
- Math proficiency
- 25% ▼ -2.00%
- Reading proficiency
- 31% ▼ -5.00%
- Median HH income
- $41,974
- Composite
- 23.76/100
- National rank
- #7818
- State rank
- #72 of 80 in UT
Livability — Ogden
- Score
- 84/100
- State rank
- #19
- US rank
- #810
Category grades
Schools grade is shown separately in the Schools card above.
Census & demographics
- Census place
- Ogden, UT
- County
- Weber County · 260,557 people
- City population
- 152,611
- Metro
- Ogden-Clearfield, UT
- Population (ZIP)
- 66,587
- Household income
- $85,057
- Rent vs Own
- Severe rent burden
- 1201.0
Population outlook (Weber County) Hauer SSP2
- Today (2025)
- 274,329 people
- By 2030
- 288,577 · +5.2%
- By 2040
- 314,848 · +14.8%
- By 2050
- 338,710 · +23.5%
- By 2075
- 384,412 · +40.1%
- By 2100
- 409,305 · +49.2%
Race, ethnicity, and origin ACS 2023
- Neighborhood character
- Predominantly White (70%)
- Race & ethnicity
- White 70% Hispanic / Latino 24% Two or more races 7% Asian 1%
- Hispanic origin (detail)
- Mexican 20%
- Common ancestry
- Italian 5% Slovak 4% Iranian 3%
- Foreign-born
- 8% · Canada
- Languages at home
- 83% English-only · Spanish 15% Other Indo-European 1%
Political lean MEDSL · Weber
- 2024 margin
- Strong R (+23.5) · D 36.8% · R 60.3% · Other 2.9%
- 2008→2024 swing
- +4.1pp toward D · 2008: -27.6pp · 2024: -23.5pp
- All cycles
- 2024: R+23.5 2020: R+22.7 2016: R+20.0 2012: R+46.0 2008: R+27.6
Not yet ingested
- Civics
- —
Market trends
- HPI YoY
- ▼ -317.85%
- Current HPI
- 323.2499
- Rent YoY
- ▲ 2.33%
- Metro
- Ogden-Clearfield, UT
- State GDP YoY
- ▲ 3.54%
- F500 in state
- 2
Industry mix (Fortune 500 HQ in UT)
| Industry | F500 HQs | Revenue |
|---|---|---|
| Financial Services | 1 | $3B |
|
||
Price history
+7.5% since first listed3 events — show timeline
- 2026-06-10 Listed $42,900 WFRMLS
- 2026-05-28 Listed $39,900 WFRMLS
- 2026-05-28 Listing Removed — WFRMLS
Cash-flow waterfall
monthlySold comps — $/sqft
last 12 mo · ≤1 miLoading sold comps…