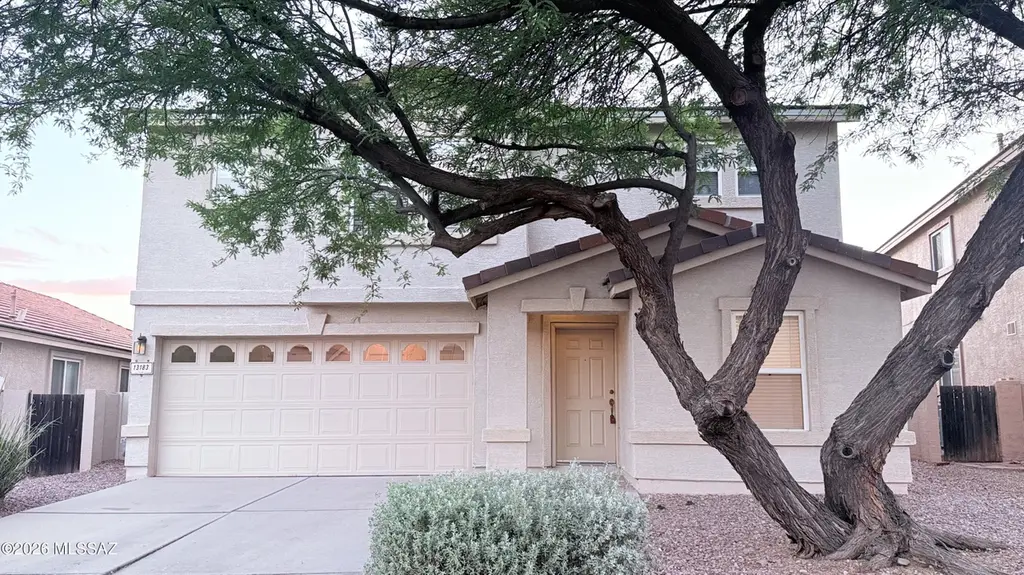
13183 N Tanner Robert · Oro Valley, AZ
Flood risk 1/10 · Minimal
- FEMA flood zone
- X (unshaded)
- Chance of flooding over 30 yrs
- 0.0%
- Est. flood insurance / yr
- $507 – $1,088
Fire risk 5/10 · Moderate
- Est. fire insurance / yr
- $610 – $1,132
Heat risk 7/10 · Major
- Hot days now (above 105°F)
- 6 days/yr
- Hot days in 30 yrs
- 16 days/yr
Wind risk 1/10 · Minimal
- Chance of severe wind over 30 yrs
- —
Air-quality risk 1/10 · Minimal
- Unhealthy air days now
- 0 days/yr
- Unhealthy air days in 30 yrs
- 0 days/yr
Risk factors via First Street. Map © Google.
Why this score? — see what drove the D grade
The composite is a weighted blend of 9 inputs, each scored 0–100. Each bar is that input's sub-score; the figure is the points it added to the 100-point composite (weight × sub-score).
- ARV discount +14.6/15.0
- Cash flow +9.5/30.0
- Livability +4.0/5.0
- Schools +3.1/10.0
- DSCR +2.7/10.0
- Rent growth +2.5/5.0
- Condition / age +2.5/5.0
- 1% rule +2.2/10.0
- Appreciation +0.0/10.0
$407,000
🖨 Deal sheet 📄 Offer letter ✓ Due diligence
Listing remarks MLS
Motivated seller! Priced below comps in area! Pool size yard w/grass & room to spare in Rancho Vistoso. Spacious 3br, 21/2 bath+den & large loft. Den has phone jack/cable, could be 4th BR/office. Upgrades incl:ceiling fan prewire in every room, Berber carpet, ceramic tile downstairs, island in kit, auto sprinkler sys, lot backs to greenbelt, 2zone ac upgrade to 12 seer, MBR has huge walk in closet, laundry room upstairs finished garage w/cabinets
Key facts
- Open floor plan
- Island in kitchen
- Two story home
Tags
Property features AI
Finance
- Other: Lot dimensions approximately 45' x 110' x 60' x 110'; Zoned Oro Valley - PAD; City-maintained road
- HOA & community: Homeowners association with monthly fees
Exterior
- Parking: Attached 2-car garage; 2 covered parking spaces
- Security: Smoke detector(s)
- Utilities: Public water; Sewer connected; Phone connected
- Home design: Single family residence; Two stories
- Construction: Frame with stucco exterior; Tile roof
- Exterior features: Covered patio/porch; Block and wrought iron fencing; Paved street; Sidewalks; East/West exposure; Dividable lot
Interior
- Kitchen: Dishwasher; Disposal; Refrigerator; Microwave
- Flooring: Carpet; Ceramic tile
- Bathrooms: 2 full bathrooms; 1 half bathroom
- Heating & cooling: Forced air heating; Zoned heating; Central air conditioning; Zoned cooling; Ceiling fans
- Interior features: Double pane windows; Exhaust fan; Water softener; Smoke detectors
- Laundry & utility: Dedicated laundry room with washer and dryer
Neighborhood map
What this means for you Summary
Snapshot
- This is a 4-bed/4.0-bath single-family listed at $407k.
Deal economics
- At list price, monthly cash flow is $-282 ($-3k/yr) — negative.
- To cash-flow at today's rent, offer at most $357k (12.3% below list).
- To meet the 1% rule (rent ≥ 1% of price), the offer needs to be $295k (27.6% below list).
- Recommended offer: $295k (27.6% below list) — sets the bar for 1% rule.
- Cap rate 5.5% vs local median 3.2% in Oro Valley — top-decile yield for the area; either an underpriced asset or a hidden risk that comps aren't pricing in. Stress-test before assuming the spread holds.
Location & tenants
- Location reads 81/100 on livability (#2 in AZ, #1,339 nationally) — a professional / high-income tenant draw. Strengths: crime A+, employment A+, housing A+; Watch: commute D, amenities F, cost of living D-.
- Amphitheater Unified District (4406) (suburban): math 32% / reading 40% proficiency, ranked #85 of 249 in AZ (top 34%) — families likely to look elsewhere, expect single-tenant / working-renter base with shorter leases.
- Zoned schools: Painted Sky Elementary School (math 57% / reading 62%, grade B-, #148 of 1,109 statewide, top 15%, 389 students, 16% FRL); Ironwood Ridge High School (math 37% / reading 39%, grade F, #80 of 381 statewide, top 21%, 1,556 students, 16% FRL).
- Zoned-school proficiency averages 49% at this address vs 36% district-wide (+13 pts) — the actual schools serving this property are materially stronger than the Amphitheater Unified District (4406) average implies; a family-tenant draw the district grade alone would hide.
- Market conditions: 232 active listings in the ZIP; 16 comparable units currently listed for rent nearby; rentals at typical pace (median 24d on market — plan ~3-4 weeks tenant-placement turnaround); high-income renter base; 5,268 units permitted in Pima County in 2024 (996 in 5+ unit buildings).
- This rent runs 31% of the median local income ($114k/yr) — at the standard rent-burdened threshold; future hikes will face affordability resistance.
Forward outlook
- Local home prices are declining (-3.0%/yr); year-one equity from $3k of loan paydown is wiped out by about $12k of value loss. Plan a longer hold.
- Pima County population projected at +8% by 2050 — modest demand growth; plan on rents tracking national, not racing it.
Negotiation context
- It's been on market 34 days — a 3% lower offer ($395k) is reasonable based on typical stale-listing flexibility.
- 4 sale attempts since 23y ago with the ask held roughly flat each time — persistent listings suggest the price (not the market) is what's stuck; bring a comps-based counter.
- Current owner paid $185k; list at $407k implies a 120% gain — meaningful room to come down on a strong offer.
Risks & watch-outs
- Climate carrying-cost: moderate wildfire risk; extreme-heat days projected 6→16/yr by 2055 (HVAC capex compounding) — expect insurance premiums to compound above CPI over the hold.
Questions for the listing agent
- What do current leases actually rent for vs. the listed asking? Can we see a recent rent roll and the last 12 months of T-12 income?
- It's been on market 34 days. Have you received any prior offers? Is the seller open to a 28% concession, seller financing, or rate buy-down credit?
- Is there a deadline driving the sale (1031 exchange, divorce, estate, relocation)? That informs how much negotiation room exists.
- Schools are A-rated — typically a magnet for longer-tenancy family renters. What's the average tenant stay here, and is there a school-zone premium baked into asking?
- The area grade is low — what's the realistic commute time and amenity access for the typical tenant pool here? Any planned neighborhood developments (good or bad) we should know about?
- What's the average days-on-market for RENTAL listings here right now (not sales)? A rising rental-DOM trend means longer vacancies and softer asking-rent achievability than the comps imply.
- What's the recent tenant-quality profile in this submarket — average credit score on applications, eviction rate, late-payment / NSF rate, and stable-employment percentage? A property-management company in the area should have these aggregated.
- How much new for-sale + rental construction is in the pipeline within 1–3 miles? Heavy new supply typically softens prices + rents 12–24 months out; constrained supply supports both.
Investment metrics
- 1% rule
- 0.72% ✗
- Cap rate
- 5.46%
- Cash-on-cash
- -2.97%
- DSCR
- 0.87
- GRM
- 11.5
CMA / ARV
- ARV (median comp)
- $483,199
- List price
- $407,000
- Delta
- -15.77%
- Verdict
- UNDERPRICED
- Comps
- 20 within 1.0 mi
Show comp detail 12 sales within ~0.75 mi
| Address | Dist | Beds/Ba | Sqft | Sold | Price | $/sf | Match |
|---|---|---|---|---|---|---|---|
| 13066 N Eagleview Dr | 0.25mi | 3/3.0 (-1) | 2,350 (+2%) | 3mo | $525,000 | $223 | 74 |
| 355 W Sacaton Canyon Dr | 0.30mi | 4/2.0 | 2,216 (-4%) | 2mo | $480,000 | $217 | 71 |
| 282 W Brinkley Springs Dr | 0.35mi | 4/3.0 | 2,216 (-4%) | 5mo | $495,000 | $223 | 70 |
| 244 W Sacaton Canyon Dr | 0.38mi | 4/3.0 | 2,216 (-4%) | 6mo | $600,000 | $271 | 67 |
| 1010 W Desert Firetail Ln | 0.46mi | 3/2.5 (-1) | 2,278 (-1%) | 4mo | $575,000 | $252 | 62 |
| 399 W Klinger Canyon Dr | 0.27mi | 4/2.0 | 2,100 (-9%) | 5mo | $480,000 | $229 | 61 |
| 13076 N Desert Olive Dr | 0.30mi | 4/2.5 | 2,609 (+13%) | 4mo | $480,000 | $184 | 55 |
| 13047 N Desert Olive Dr | 0.34mi | 3/2.0 (-1) | 2,011 (-13%) | 0mo | $378,000 | $188 | 50 |
| 12884 N Pioneer Way | 0.72mi | 3/2.5 (-1) | 2,448 (+6%) | 1mo | $540,000 | $221 | 44 |
| 967 W Thornbush Pl | 0.55mi | 4/2.5 | 2,612 (+14%) | 5mo | $480,000 | $184 | 42 |
| 13655 N Meadowhawk Ln | 0.68mi | 4/2.5 | 2,625 (+14%) | 0mo | $891,000 | $339 | 39 |
| 942 W Zebra Tail Ct | 0.65mi | 4/2.5 | 2,607 (+13%) | 6mo | $725,000 | $278 | 36 |
Match score weights: distance 35% · size 25% · config 20% · recency 20%. Top-matched comps best support the ARV.
Projected returns pro-forma
-3.0% appreciation · 3.0% rent growth · sell at horizon
- IRR
- -21.3%
- Equity multiple
- 0.26×
- Total profit
- $-84,020
- Equity at exit
- $60,685
- IRR
- -14.9%
- Equity multiple
- 0.15×
- Total profit
- $-96,649
- Equity at exit
- $35,190
Cash invested: $113,960 (down + closing). Projections, not guarantees.
Landlord ↔ Tenant lean methodology
- Overall (STATE)
- 87 Strongly Landlord-Friendly
- State Arizona
- 87 Strongly Landlord-Friendly · R+3
- County
- — inherits STATE
- City
- — inherits STATE
ZIP-level market 85755
- Home prices YoY
- -20.4%
- Active inventory
- 232
- Price-to-rent
- 11.5×
Monthly cashflow live
- Estimated rent
- $2,949 high interval (Pro) →
- Mortgage (P&I)
- −$2,134
- Tax from tax record
- −$308 /mo · $3,696/yr
- Insurance
- −$170
- HOA
- −$0
- Vacancy / Maint / Mgmt
- −$619
- Net cashflow
- $-282
Break-even live
UW: 25.0% down · 7.5% · 30yr · 1.5% tax · 5.0% vac · 8.0% maint · 8.0% mgmt
Financing live
Cash to close
- Down payment
- $101,750
- Closing costs
- $12,210
- Reserves months
- —
- Total cash needed
- —
Loan-product check · same deal, 3 products live
Conventional
25% down · 7.5% · 30yr
- Down + closing
- —
- Monthly P&I
- —
- Monthly cashflow
- —
- DSCR
- —
- Eligible?
- —
Personal DTI + credit; lowest rate.
DSCR
20% down · 8.5% · 30yr
- Down + closing
- —
- Monthly P&I
- —
- Monthly cashflow
- —
- DSCR
- —
- Eligible?
- —
No personal income docs; deal must DSCR.
Hard money
10% down · 12.0% · 12mo
- Down + closing
- —
- Monthly P&I
- —
- Monthly cashflow
- —
- DSCR
- —
- Eligible?
- —
Short-term bridge; refi at stabilization.
Rent comps 16 comps
| Address | Beds | Baths | Sqft | Rent | $/sqft | DOM | Units | Dist |
|---|---|---|---|---|---|---|---|---|
| 12949 N Desert Olive Dr Oro Valley, AZ | 4.0 | 2.5 | 2784 | $2,526 | $0.91 | 43d | 1 | 0.38mi |
| 12936 N Salt Cedar Dr Tucson, AZ | 5.0 | 2.5 | 2750 | $2,600 | $0.95 | 43d | 1 | 0.44mi |
| 12825 N Mystic View Pl Oro Valley, AZ | 4.0 | 2.5 | 2965 | $3,300 | $1.11 | 23d | 1 | 0.45mi |
| 1022 W Blue Crest Dr Oro Valley, AZ | 4.0 | 2.0 | 2165 | $2,195 | $1.01 | 11d | 1 | 0.46mi |
| 13391 N Flaxleaf Pl Tucson, AZ | 4.0 | 3.0 | 2663 | $2,500 | $0.94 | 43d | 1 | 0.47mi |
| 13914 N Flaxleaf Pl Oro Valley, AZ | 4.0 | 3.0 | 2663 | $2,650 | $1.00 | 43d | 1 | 0.60mi |
| 1194 W Rodriguez Rd Tucson, AZ | 4.0 | 2.0 | 1887 | $1,895 | $1.00 | 23d | 1 | 0.66mi |
| 755 W Vistoso Highlands Dr Oro Valley, AZ | 2.0–3.0 | 2.0 | 1587 | $3,500 | $2.20 | 3d | 3 | 0.69mi |
| 12884 N Pioneer Way Tucson, AZ | 4.0 | 2.5 | 2448 | $4,500 | $1.84 | 3d | 1 | 0.72mi |
| 13036 N Spinystar Dr Oro Valley, AZ | 3.0 | 2.5 | 1893 | $2,975 | $1.57 | 43d | 1 | 0.75mi |
| 12690 N Bandanna Way Oro Valley, AZ | 3.0 | 2.0 | 1988 | $2,195 | $1.10 | 17d | 1 | 0.76mi |
| 13323 N Barlassina Dr Tucson, AZ | 4.0 | 3.0 | 2321 | $2,295 | $0.99 | 43d | 1 | 0.83mi |
| 1254 W Versilia Dr Tucson, AZ | 4.0 | 2.0 | 2145 | $2,295 | $1.07 | 23d | 1 | 0.89mi |
| 13555 N Barlassina Dr Tucson, AZ | 3.0 | 2.0 | 2100 | $1,995 | $0.95 | 3d | 1 | 0.91mi |
| 13816 N Topflite Dr Oro Valley, AZ | 3.0 | 2.5 | 2549 | $4,500 | $1.77 | 11d | 1 | 0.97mi |
| 114 W Freddie Canyon Way Oro Valley, AZ | 4.0 | 2.0 | 1812 | $2,200 | $1.21 | 23d | 1 | 1.31mi |
Listing history 23 events
-
2026-06-18days on market $407,000 Active 34 DOM
-
2026-06-17days on market $407,000 Active 33 DOM
-
2026-06-16days on market $407,000 Active 32 DOM
-
2026-06-15days on market $407,000 Active 31 DOM
-
2026-06-13days on market $407,000 Active 29 DOM
-
2026-06-10days on market $407,000 Active 26 DOM
-
2026-06-09days on market $407,000 Active 25 DOM
-
2026-06-08days on market $407,000 Active 24 DOM
-
2026-06-07remarks 511-char remark
-
2026-06-07days on market $407,000 Active 23 DOM
-
2026-06-05days on market $407,000 Active 20 DOM
-
2026-06-03days on market $407,000 Active 19 DOM
-
2026-06-02days on market $407,000 Active 18 DOM
-
2026-06-01days on market $407,000 Active 17 DOM
-
2026-05-31days on market $407,000 Active 16 DOM
-
2026-05-15$407,000 Active 462-char remark
-
2024-04-16historical $1,825
-
2024-03-23$1,825
-
2004-02-20soldstatus $185,000 458-char remark
Show marketing remark (458 chars)
Motivated seller! Priced below comps in area! Pool size yard w/grass & room to spare in Rancho Vistoso. Spacious 3br, 21/2 bath+den & large loft. Den has phone jack/cable, could be 4th BR/office. Upgrades incl:ceiling fan prewire in every room, Berber carpet, ceramic tile downstairs, island in kit, auto sprinkler sys, lot backs to greenbelt, 2zone ac upgrade to 12 seer, MBR has huge walk in closet, laundry room upstairs finished garage w/cabinets
-
2004-02-20soldstatus $185,000
Show marketing remark (458 chars)
Motivated seller! Priced below comps in area! Pool size yard w/grass & room to spare in Rancho Vistoso. Spacious 3br, 21/2 bath+den & large loft. Den has phone jack/cable, could be 4th BR/office. Upgrades incl:ceiling fan prewire in every room, Berber carpet, ceramic tile downstairs, island in kit, auto sprinkler sys, lot backs to greenbelt, 2zone ac upgrade to 12 seer, MBR has huge walk in closet, laundry room upstairs finished garage w/cabinets
-
2004-01-30$192,900 458-char remark
Show marketing remark (458 chars)
Motivated seller! Priced below comps in area! Pool size yard w/grass & room to spare in Rancho Vistoso. Spacious 3br, 21/2 bath+den & large loft. Den has phone jack/cable, could be 4th BR/office. Upgrades incl:ceiling fan prewire in every room, Berber carpet, ceramic tile downstairs, island in kit, auto sprinkler sys, lot backs to greenbelt, 2zone ac upgrade to 12 seer, MBR has huge walk in closet, laundry room upstairs finished garage w/cabinets
-
2004-01-29historical
-
2003-08-18$192,000
ⓘ Source: listings_history table (triggers on properties + properties_extension) + one-shot
backfill from property_details.listing_events for pre-trigger history.
Tax reassessment forecast AZ · Resets to sale price
- Current annual tax
- $3,696 · $308/mo
- Projected year-2 tax
- $3,696 · $308/mo
- Expected delta
- $0/yr ($0/mo · 0.0%)
ⓘ Screening estimate from a state-policy table — verify with the county assessor before closing.
Climate risk First Street
- Flood 1/10 Low FEMA zone X (unshaded) · 0% chance over 30 yrs
- Wildfire 5/10 Major
- Heat 7/10 Severe 6 d/yr ≥105°F today · 16 d/yr by 30 yrs out
- Wind 1/10 Low
- Air quality 1/10 Low 0 unhealthy d/yr today · 0 by 30 yrs out
Nearby sold comps map
Loading sold comps map…
Walkable amenities ~0.75 mi
Loading nearby amenities…
Taxation est. · year 1
- Rental income
- $35,384
- − Mortgage interest
- −$22,798
- − Property taxes
- −$3,696
- − Insurance
- −$2,035
- − Repairs & maintenance
- −$2,831
- − Management
- −$2,831
- − Depreciation
- −$11,840
- Taxable loss
- −$10,646
- Est. tax savings @ 24.0%
- +$2,555
- After-tax cash flow
- $-834/yr
For passive investors: Depreciation is non-cash, so a rental often shows a tax loss while cash-flowing — sheltering income. Rental losses are passive: they offset passive income freely, and up to $25,000/yr can offset ordinary (W-2) income if you actively participate and your MAGI is under $100k (phasing out to $0 by $150k); unused losses carry forward. On sale, claimed depreciation is recaptured at up to 25%, and gains may owe capital-gains tax (a 1031 exchange can defer both). Figures are a year-1 estimate at your 24.0% rate — not tax advice; consult a CPA.
Schools (NCES district)
- District
- Amphitheater Unified District (4406)
- NCES district ID
- 0400680
- Math proficiency
- 32% ▼ -13.00%
- Reading proficiency
- 40% ▼ -8.00%
- Median HH income
- $46,524
- Composite
- 30.82/100
- National rank
- #6135
- State rank
- #85 of 249 in AZ
Livability — Oro Valley
- Score
- 81/100
- State rank
- #2
- US rank
- #1339
Category grades
Schools grade is shown separately in the Schools card above.
Census & demographics
- Census place
- Oro Valley, AZ
- County
- Pima County · 1,012,107 people
- City population
- 41,345
- Metro
- Tucson, AZ
- Population (ZIP)
- 18,560
- Household income
- $113,831
- Rent vs Own
- Severe rent burden
- 211.0
Population outlook (Pima County) Hauer SSP2
- Today (2025)
- 1,066,056 people
- By 2030
- 1,086,684 · +1.9%
- By 2040
- 1,117,160 · +4.8%
- By 2050
- 1,149,778 · +7.9%
- By 2075
- 1,271,480 · +19.3%
- By 2100
- 1,321,160 · +23.9%
Race, ethnicity, and origin ACS 2023
- Neighborhood character
- Predominantly White (78%)
- Race & ethnicity
- White 78% Hispanic / Latino 12% Two or more races 10% Asian 5% Black 1%
- Hispanic origin (detail)
- Mexican 9% Puerto Rican 1%
- Common ancestry
- Lithuanian 7% Romanian 3% Italian 3%
- Foreign-born
- 11% · Canada, China
- Languages at home
- 86% English-only · Spanish 5% French/Haitian/Cajun 3% Tagalog/Filipino 1%
Political lean MEDSL · Pima
- 2024 margin
- D (+15.2) · D 57.0% · R 41.8% · Other 1.2%
- 2008→2024 swing
- +9.1pp toward D · 2008: 6.1pp · 2024: 15.2pp
- All cycles
- 2024: D+15.2 2020: D+18.7 2016: D+13.5 2012: D+5.8 2008: D+6.1
Not yet ingested
- Civics
- —
Market trends
- HPI YoY
- ▼ -64.99%
- Current HPI
- 254.1505
- Rent YoY
- —
- Metro
- Tucson, AZ
- State GDP YoY
- ▲ 4.54%
- F500 in state
- 20
Industry mix (Fortune 500 HQ in AZ)
| Industry | F500 HQs | Revenue |
|---|---|---|
| Technology | 2 | $13B |
|
||
| Mining / Metals | 1 | $23B |
|
||
| Environmental Services | 1 | $16B |
|
||
| Metals / Steel | 1 | $14B |
|
||
| Technology Distribution | 1 | $9B |
|
||
| Homebuilding | 1 | $8B |
|
||
Price history
+112.0% since first listed8 events — show timeline
- 2026-05-15 Listed $407,000 MLSSAZ
- 2024-04-16 Rental Removed $1,825 TARMLS
- 2024-03-23 Listed for Rent $1,825 TARMLS
- 2004-02-20 Sold (Public Records) $185,000 Public Records
- 2004-02-20 Sold (MLS) $185,000 MLSSAZ
- 2004-01-30 Listed $192,900 MLSSAZ
- 2004-01-29 Listing Removed — MLSSAZ
- 2003-08-18 Listed $192,000 MLSSAZ
Property tax history
+3.6%/yrLatest (2025): $3,696 · +4.3% YoY. Source: county tax records.
Cash-flow waterfall
monthlySold comps — $/sqft
last 12 mo · ≤1 miLoading sold comps…