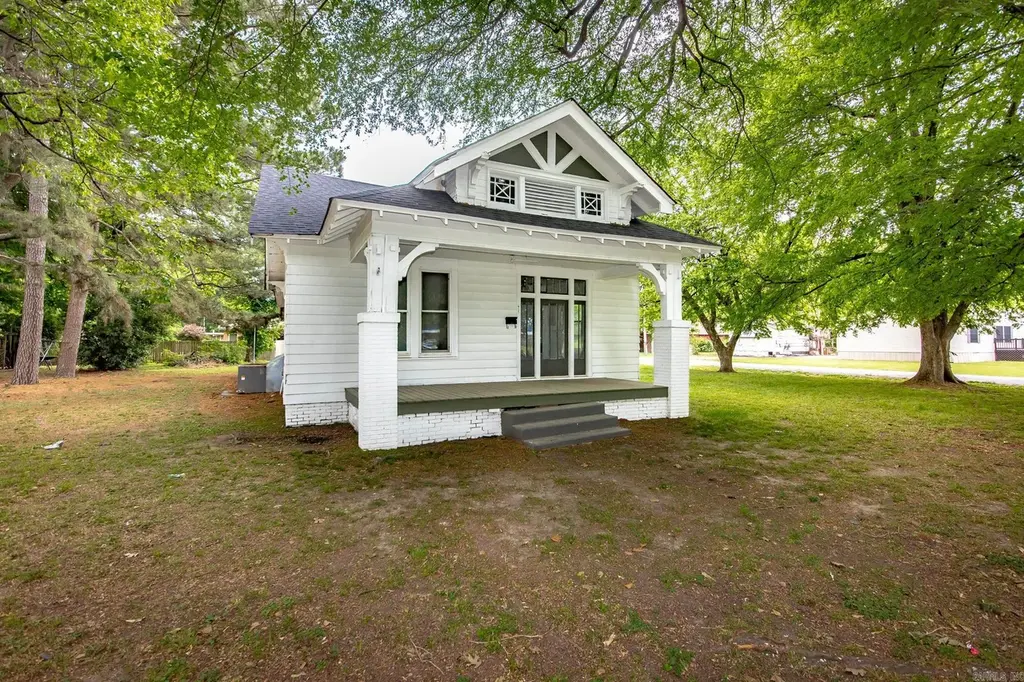
400 NE 1st St · England, AR
Flood risk 1/10 · Minimal
- FEMA flood zone
- X (unshaded)
- Chance of flooding over 30 yrs
- 0.0%
- Est. flood insurance / yr
- $507 – $1,088
Fire risk 1/10 · Minimal
- Est. fire insurance / yr
- $1,499 – $2,785
Heat risk 6/10 · Moderate
- Hot days now (above 108°F)
- 7 days/yr
- Hot days in 30 yrs
- 19 days/yr
Wind risk 4/10 · Minor
- Chance of severe wind over 30 yrs
- 17.0%
Air-quality risk 2/10 · Minimal
- Unhealthy air days now
- 1 days/yr
- Unhealthy air days in 30 yrs
- 2 days/yr
Risk factors via First Street. Map © Google.
Why this score? — see what drove the B+ grade
The composite is a weighted blend of 9 inputs, each scored 0–100. Each bar is that input's sub-score; the figure is the points it added to the 100-point composite (weight × sub-score).
- Cash flow +30.0/30.0
- DSCR +10.0/10.0
- Appreciation +10.0/10.0
- 1% rule +9.2/10.0
- ARV discount +7.7/15.0
- Livability +3.4/5.0
- Rent growth +2.5/5.0
- Condition / age +2.5/5.0
- Schools +2.3/10.0
$109,900
🖨 Deal sheet 📄 Offer letter ✓ Due diligence
Listing remarks MLS
Bought and remodeled. Further remodeling has just been completed. New kitchen cabinets and stone counter tops have been installed. Come back and see the new work. New roof, Central unit only a few years old, new laminate on the floors and paint job inside and out. Corner lot
Key facts
- Paint job
- New laminate
- New roof
Tags
Neighborhood map
What this means for you Summary
Snapshot
- This is a 3-bed/1.0-bath single-family listed at $110k.
Deal economics
- At list price, monthly cash flow is $562 ($7k/yr) — positive.
- The deal already cash-flows at list — no discount required.
- Meets the 1% rule at list price ($2k rent vs $110k).
- Recommended offer: $97k (12.0% below list) — sets the bar for market timing.
Location & tenants
- Location reads 67/100 on livability (#96 in AR) — a middle-class / working-renter tenant base. Strengths: cost of living A+, housing A+, health & safety A+; Watch: schools F, crime D-, amenities F.
- England School District (town): math 27% / reading 28% proficiency, ranked #170 of 238 in AR (top 71%) — low school quality limits family demand, transient renter base, plan for 1-2y turnover; 66% free/reduced lunch — lower-income household profile, screen leases tightly.
- Market conditions: 50 active listings in the ZIP; 185 units permitted in Lonoke County in 2024 (0 in 5+ unit buildings).
Forward outlook
- In year one you build about $12k of equity ($760 loan paydown + $11k appreciation (10.0% local appreciation)).
- Lonoke County population projected at +12% by 2050 — modest demand growth; plan on rents tracking national, not racing it.
- At projected returns (10.0% appreciation + 3.0% rent growth), your $31k cash investment doubles in ~2 years — after that, you're playing with house money.
- By year 4, paydown + projected appreciation supports a ~$42k cash-out refi (75% LTV) — recoverable capital for the next deal without selling this one.
Negotiation context
- It's been on market 294 days — a 12% lower offer ($97k) is reasonable based on typical stale-listing flexibility.
- 2 sale attempts since 15y ago; this cycle's ask has dropped $30k (21%) from the opening price — seller is motivated, your offer sets the floor, not the list.
- Current owner paid $30k; list at $110k implies a 266% gain — meaningful room to come down on a strong offer.
Risks & watch-outs
- Watch-outs: built in 1950 — expect roof / HVAC / electrical / plumbing capex.
- Climate carrying-cost: extreme-heat days projected 7→19/yr by 2055 (HVAC capex compounding) — expect insurance premiums to compound above CPI over the hold.
Questions for the listing agent
- It's been on market 294 days. Have you received any prior offers? Is the seller open to a 12% concession, seller financing, or rate buy-down credit?
- Built in 1950 — when were the roof, HVAC, electrical panel, plumbing, and water heater last replaced?
- Why hasn't it sold? Are there any deal-killer items the seller is aware of (foundation, flood, title, zoning, code violations)?
- Is there a deadline driving the sale (1031 exchange, divorce, estate, relocation)? That informs how much negotiation room exists.
- Schools are F-rated, which usually means shorter tenancies and higher turnover. Who's the typical renter profile here, and what's been the actual vacancy rate?
- Crime grade is D in this area — have there been break-ins, vandalism, or insurance claims at this property in the last 3 years? What carrier currently insures it and at what premium?
- What's the average days-on-market for RENTAL listings here right now (not sales)? A rising rental-DOM trend means longer vacancies and softer asking-rent achievability than the comps imply.
- What's the recent tenant-quality profile in this submarket — average credit score on applications, eviction rate, late-payment / NSF rate, and stable-employment percentage? A property-management company in the area should have these aggregated.
- How much new for-sale + rental construction is in the pipeline within 1–3 miles? Heavy new supply typically softens prices + rents 12–24 months out; constrained supply supports both.
Investment metrics
- 1% rule
- 1.42% ✓
- Cap rate
- 12.43%
- Cash-on-cash
- 21.92%
- DSCR
- 1.98
- GRM
- 5.9
CMA / ARV
- ARV (median comp)
- $110,327
- List price
- $109,900
- Delta
- -0.39%
- Verdict
- FAIR
- Comps
- 20 within 1.0 mi
Show comp detail 9 sales within ~0.75 mi
| Address | Dist | Beds/Ba | Sqft | Sold | Price | $/sf | Match |
|---|---|---|---|---|---|---|---|
| 309 NE First St | 0.09mi | 3/2.0 | 1,708 (+14%) | 10mo | $169,000 | $99 | 60 |
| 511 NE First St | 0.09mi | 3/1.0 | 1,692 (+13%) | 18mo | $148,000 | $87 | 59 |
| 102 NE 5th St | 0.30mi | 2/1.0 (-1) | 1,320 (-12%) | 4mo | $102,400 | $78 | 58 |
| 111 SE 4th | 0.30mi | 3/2.0 | 1,398 (-6%) | 22mo | $79,000 | $57 | 53 |
| 217 NW 3rd St | 0.31mi | 2/1.0 (-1) | 1,309 (-12%) | 9mo | $40,000 | $31 | 53 |
| 322 SE 4th St | 0.44mi | 2/1.0 (-1) | 1,364 (-9%) | 12mo | $115,000 | $84 | 50 |
| 100 Westchester Ln | 0.45mi | 3/2.0 | 1,668 (+12%) | 13mo | $170,000 | $102 | 45 |
| 502 E Taylor St | 0.62mi | 3/1.5 | 1,642 (+10%) | 13mo | $80,000 | $49 | 42 |
| 101 King Richard Dr | 0.58mi | 4/1.5 (+1) | 1,687 (+13%) | 17mo | $159,000 | $94 | 30 |
Match score weights: distance 35% · size 25% · config 20% · recency 20%. Top-matched comps best support the ARV.
Projected returns pro-forma
10.0% appreciation · 3.0% rent growth · sell at horizon
- IRR
- 40.7%
- Equity multiple
- 4.11×
- Total profit
- $95,616
- Equity at exit
- $99,007
- IRR
- 35.1%
- Equity multiple
- 9.23×
- Total profit
- $253,359
- Equity at exit
- $213,512
Cash invested: $30,772 (down + closing). Projections, not guarantees.
Landlord ↔ Tenant lean methodology
- Overall (STATE)
- 92 Strongly Landlord-Friendly
- State Arkansas
- 92 Strongly Landlord-Friendly · R+14
- County
- — inherits STATE
- City
- — inherits STATE
ZIP-level market 72046
- Home prices YoY
- 20.0%
- Active inventory
- 50
- Price-to-rent
- 5.9×
Monthly cashflow live
- Estimated rent
- $1,556 medium interval (Pro) →
- Mortgage (P&I)
- −$576
- Tax from tax record
- −$45 /mo · $541/yr
- Insurance
- −$46
- HOA
- −$0
- Vacancy / Maint / Mgmt
- −$327
- Net cashflow
- $562
Break-even live
UW: 25.0% down · 7.5% · 30yr · 1.5% tax · 5.0% vac · 8.0% maint · 8.0% mgmt
Financing live
Cash to close
- Down payment
- $27,475
- Closing costs
- $3,297
- Reserves months
- —
- Total cash needed
- —
Loan-product check · same deal, 3 products live
Conventional
25% down · 7.5% · 30yr
- Down + closing
- —
- Monthly P&I
- —
- Monthly cashflow
- —
- DSCR
- —
- Eligible?
- —
Personal DTI + credit; lowest rate.
DSCR
20% down · 8.5% · 30yr
- Down + closing
- —
- Monthly P&I
- —
- Monthly cashflow
- —
- DSCR
- —
- Eligible?
- —
No personal income docs; deal must DSCR.
Hard money
10% down · 12.0% · 12mo
- Down + closing
- —
- Monthly P&I
- —
- Monthly cashflow
- —
- DSCR
- —
- Eligible?
- —
Short-term bridge; refi at stabilization.
Listing history 19 events
-
2026-06-19days on market $109,900 Active 294 DOM
-
2026-06-18statusdays on market $109,900 Active 293 DOM
-
2026-06-17days on market $109,900 Back on Market 292 DOM
-
2026-06-16days on market $109,900 Back on Market 291 DOM
-
2026-06-15days on market $109,900 Back on Market 290 DOM
-
2026-06-14days on market $109,900 Back on Market 288 DOM
-
2026-06-12statusdays on market $109,900 Back on Market 287 DOM
-
2026-06-01status $109,900 Under Contract 286 DOM
-
2026-06-01days on market $109,900 Active 286 DOM
-
2026-05-31days on market $109,900 Active 285 DOM
-
2026-05-31days on market $109,900 Active 284 DOM
-
2026-04-02price $109,900 275-char remark
Show marketing remark (275 chars)
Bought and remodeled. Further remodeling has just been completed. New kitchen cabinets and stone counter tops have been installed. Come back and see the new work. New roof, Central unit only a few years old, new laminate on the floors and paint job inside and out. Corner lot
-
2026-01-15price $119,900 275-char remark
Show marketing remark (275 chars)
Bought and remodeled. Further remodeling has just been completed. New kitchen cabinets and stone counter tops have been installed. Come back and see the new work. New roof, Central unit only a few years old, new laminate on the floors and paint job inside and out. Corner lot
-
2025-08-19$139,900 New Listing 275-char remark
Show marketing remark (275 chars)
Bought and remodeled. Further remodeling has just been completed. New kitchen cabinets and stone counter tops have been installed. Come back and see the new work. New roof, Central unit only a few years old, new laminate on the floors and paint job inside and out. Corner lot
-
2018-04-02soldstatus $30,000
-
2012-10-04soldstatus $25,800 76-char remark
Show marketing remark (76 chars)
Hardwood floors, well taken care of, clean, carport, big trees. New windows.
-
2012-07-18historical 76-char remark
Show marketing remark (76 chars)
Hardwood floors, well taken care of, clean, carport, big trees. New windows.
-
2011-09-23$35,000 76-char remark
Show marketing remark (76 chars)
Hardwood floors, well taken care of, clean, carport, big trees. New windows.
-
1976-03-22soldstatus $15,000
ⓘ Source: listings_history table (triggers on properties + properties_extension) + one-shot
backfill from property_details.listing_events for pre-trigger history.
Tax reassessment forecast AR · Resets to sale price
- Current annual tax
- $541 · $45/mo
- Projected year-2 tax
- $703 · $59/mo
- Expected delta
- +$163/yr (+$14/mo · 30.1%)
ⓘ Screening estimate from a state-policy table — verify with the county assessor before closing.
Climate risk First Street
- Flood 1/10 Low FEMA zone X (unshaded) · 0% chance over 30 yrs
- Wildfire 1/10 Low
- Heat 6/10 Major 7 d/yr ≥108°F today · 19 d/yr by 30 yrs out
- Wind 4/10 Moderate 17% chance of damaging wind over 30 yrs
- Air quality 2/10 Low 1 unhealthy d/yr today · 2 by 30 yrs out
Nearby sold comps map
Loading sold comps map…
Walkable amenities ~0.75 mi
Loading nearby amenities…
Taxation est. · year 1
- Rental income
- $18,671
- − Mortgage interest
- −$6,156
- − Property taxes
- −$541
- − Insurance
- −$550
- − Repairs & maintenance
- −$1,494
- − Management
- −$1,494
- − Depreciation
- −$3,197
- Taxable income
- $5,240
- Est. tax owed @ 24.0%
- −$1,258
- After-tax cash flow
- $5,486/yr
For passive investors: Depreciation is non-cash, so a rental often shows a tax loss while cash-flowing — sheltering income. Rental losses are passive: they offset passive income freely, and up to $25,000/yr can offset ordinary (W-2) income if you actively participate and your MAGI is under $100k (phasing out to $0 by $150k); unused losses carry forward. On sale, claimed depreciation is recaptured at up to 25%, and gains may owe capital-gains tax (a 1031 exchange can defer both). Figures are a year-1 estimate at your 24.0% rate — not tax advice; consult a CPA.
Schools (NCES district)
- District
- England School District
- NCES district ID
- 0505850
- Math proficiency
- 27% ▼ -7.00%
- Reading proficiency
- 28% ▼ -2.00%
- Median HH income
- $36,807
- Composite
- 22.87/100
- National rank
- #8006
- State rank
- #170 of 238 in AR
Livability — England
- Score
- 67/100
- State rank
- #96
- US rank
- #10256
Category grades
Schools grade is shown separately in the Schools card above.
Census & demographics
- Census place
- England, AR
- Population (ZIP)
- 4,128
Population outlook (Lonoke County) Hauer SSP2
- Today (2025)
- 78,072 people
- By 2030
- 80,673 · +3.3%
- By 2040
- 84,977 · +8.8%
- By 2050
- 87,778 · +12.4%
- By 2075
- 91,398 · +17.1%
- By 2100
- 87,858 · +12.5%
Race, ethnicity, and origin ACS 2023
- Neighborhood character
- Predominantly White (68%)
- Race & ethnicity
- White 68% Black 20% Hispanic / Latino 6% Two or more races 5%
- Hispanic origin (detail)
- Mexican 5%
- Common ancestry
- Slovak 4% Serbian 1% Italian 1%
- Foreign-born
- 5% · Canada
- Languages at home
- 93% English-only · Spanish 7%
Political lean MEDSL · Lonoke
- 2024 margin
- Solid R (+53.7) · D 22.2% · R 75.8% · Other 2.0%
- 2008→2024 swing
- -6.2pp toward R · 2008: -47.5pp · 2024: -53.7pp
- All cycles
- 2024: R+53.7 2020: R+52.8 2016: R+53.3 2012: R+50.9 2008: R+47.5
Not yet ingested
- Civics
- —
Market trends
- HPI YoY
- ▲ 33.41%
- Current HPI
- 200.75
- Rent YoY
- —
- Metro
- —
- State GDP YoY
- ▲ 3.80%
- F500 in state
- 10
Industry mix (Fortune 500 HQ in AR)
| Industry | F500 HQs | Revenue |
|---|---|---|
| Retail | 1 | $681B |
|
||
| Food / Agriculture | 1 | $53B |
|
||
| Retail / Energy | 1 | $22B |
|
||
| Transportation / Logistics | 1 | $12B |
|
||
| Energy | 1 | $4B |
|
||
Price history
+632.7% since first listed8 events — show timeline
- 2026-04-02 Price Changed $109,900 CARMLS
- 2026-01-15 Price Changed $119,900 CARMLS
- 2025-08-19 Listed $139,900 CARMLS
- 2018-04-02 Sold (Public Records) $30,000 Public Records
- 2012-10-04 Sold (MLS) $25,800 CARMLS
- 2012-07-18 Listing Removed — CARMLS
- 2011-09-23 Listed $35,000 CARMLS
- 1976-03-22 Sold (Public Records) $15,000 Public Records
Property tax history
-0.8%/yrLatest (2025): $541 · +0.0% YoY. Source: county tax records.
Cash-flow waterfall
monthlySold comps — $/sqft
last 12 mo · ≤1 miLoading sold comps…