 Duplex
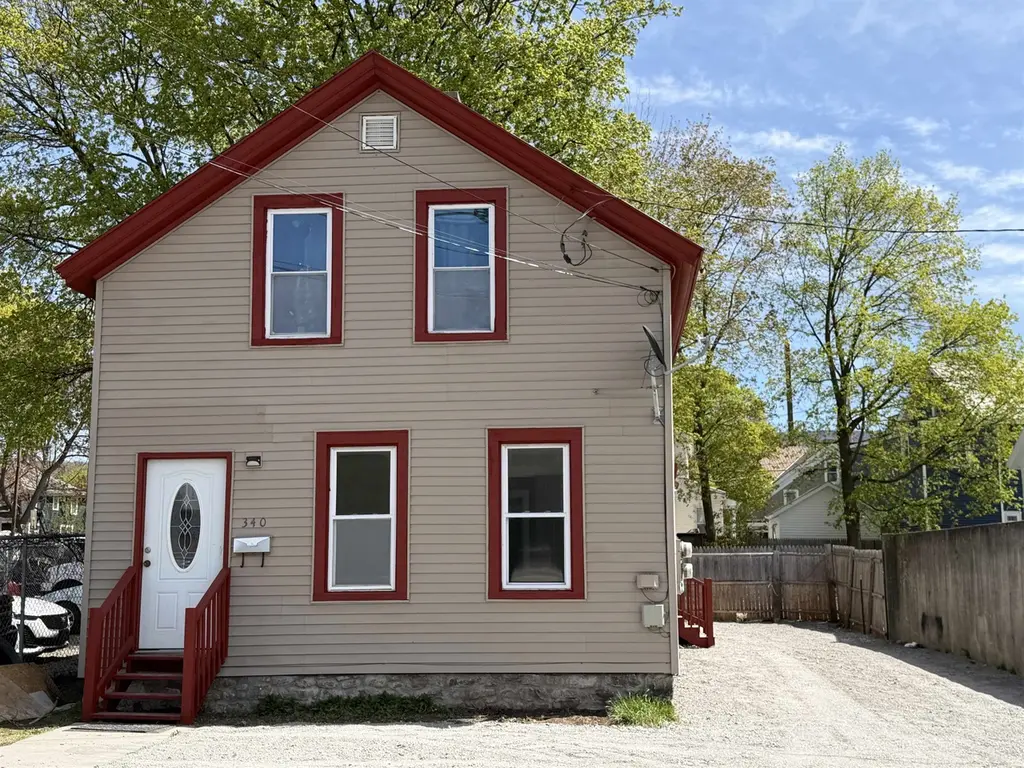
340 Pleasant St · Bennington, VT
Flood risk 6/10 · Moderate
- FEMA flood zone
- AE
- Chance of flooding over 30 yrs
- 0.71%
- Est. flood insurance / yr
- $1,737 – $8,500
Fire risk 1/10 · Minimal
- Est. fire insurance / yr
- $480 – $892
Heat risk 3/10 · Minor
- Hot days now (above 92°F)
- 7 days/yr
- Hot days in 30 yrs
- 17 days/yr
Wind risk 3/10 · Minor
- Chance of severe wind over 30 yrs
- 6.0%
Air-quality risk 2/10 · Minimal
- Unhealthy air days now
- 0 days/yr
- Unhealthy air days in 30 yrs
- 1 days/yr
Risk factors via First Street. Map © Google.
Why this score? — see what drove the B grade
The composite is a weighted blend of 9 inputs, each scored 0–100. Each bar is that input's sub-score; the figure is the points it added to the 100-point composite (weight × sub-score).
- Cash flow +30.0/30.0
- 1% rule +10.0/10.0
- DSCR +10.0/10.0
- ARV discount +7.5/15.0
- Schools +5.0/10.0
- Livability +3.2/5.0
- Rent growth +2.5/5.0
- Condition / age +2.5/5.0
- Appreciation +0.0/10.0
$215,000
🖨 Deal sheet 📄 Offer letter ✓ Due diligence
Multi-family units
County records classify this as Multi-Family (2-4 Unit). Listing-text estimate: 2 units. confirmed
Listing remarks
Downtown Bennington duplex offering an excellent opportunity for first-time homebuyers, owner-occupants, or investors. The first-floor unit has been completely renovated with a new kitchen, updated bathroom, and new flooring throughout. Recent improvements include a repointed foundation, fully completed siding, a new roof, and a gravel driveway. Live in one unit and help offset your mortgage with rental income from the other, or continue using the property as an investment. Appears well suited for FHA, VA, USDA, and conventional financing. Conveniently located near shopping, dining, schools, medical facilities, and other everyday amenities in downtown Bennington. Bennington continues to ben
Key facts
- New kitchen
- New flooring
- Completely renovated
Tags
Property features AI
Finance
- Financial info: Two-unit building (one 2-bed unit and one 1-bed unit)
Exterior
- Parking: Gravel driveway
- Utilities: Public sewer; Public water; Circuit breaker electrical service; Fiber optic internet available; Telephone service available; Electric service by Green Mountain Power; Fuel delivery from Greene's Oil
- Home design: Multi-family property; Existing construction; Beige exterior color; Built in 1930
- Construction: Wood frame construction; Shingle roof; Unfinished basement (stairs access)
- Exterior features: Corner lot; Level lot; Neighborhood setting; Near hospital; Gravel driveway; Shingle roof
Interior
- Kitchen: Water heater owned
- Bedrooms: One 2-bedroom unit (level 1); One 1-bedroom unit (level 2)
- Flooring: Vinyl plank; Wood
- Bathrooms: Two full bathrooms (one in each unit)
- Heating & cooling: Oil-fired forced air heating; No central cooling
- Interior features: Unfinished basement with interior access via stairs
Neighborhood map
What this means for you Summary
Snapshot
- This is a 2 × 3-bed/2.0-bath units multifamily listed at $215k.
Deal economics
- At list price, monthly cash flow is $1k ($14k/yr) — positive. Per door: $603/mo.
- The deal already cash-flows at list — no discount required.
- Meets the 1% rule at list price ($4k rent vs $215k).
- Recommended offer: $209k (3.0% below list) — sets the bar for market timing.
- Cap rate 15.4% vs local median 5.4% in Bennington — top-decile yield for the area; either an underpriced asset or a hidden risk that comps aren't pricing in. Stress-test before assuming the spread holds.
Location & tenants
- Location reads 64/100 on livability (#63 in VT) — a middle-class / working-renter tenant base. Strengths: housing A+, health & safety A+, cost of living A; Watch: employment C-, crime D, schools F.
- Market conditions: 65 active listings in the ZIP; 1 comparable units currently listed for rent nearby; 59 units permitted in Bennington County in 2024 (0 in 5+ unit buildings).
- At $3,787/mo this rent would consume 76% of the median local household income ($60k/yr) (locally 982% of renters already pay >50% of income on rent) — very limited rent-growth headroom before tenants either downsize or default.
Forward outlook
- Local home prices are declining (-3.0%/yr); year-one equity from $1k of loan paydown is wiped out by about $6k of value loss. Plan a longer hold.
- Bennington County population projected at -23% by 2050 — secular population decline; favor cash flow + early exit over multi-decade hold.
- At projected returns (-3.0% appreciation + 3.0% rent growth), your $60k cash investment doubles in ~6 years — after that, you're playing with house money.
Negotiation context
- It's been on market 51 days — a 3% lower offer ($209k) is reasonable based on typical stale-listing flexibility.
Risks & watch-outs
- Watch-outs: flood insurance adds $427/mo; built in 1930 — expect roof / HVAC / electrical / plumbing capex.
- Climate carrying-cost: in FEMA flood zone AE (mandatory federal flood insurance) — expect insurance premiums to compound above CPI over the hold.
Questions for the listing agent
- It's been on market 51 days. Have you received any prior offers? Is the seller open to a 3% concession, seller financing, or rate buy-down credit?
- Can we see the unit-by-unit rent roll, current vacancy, and any below-market leases? What's the average tenancy length?
- What capital expenditures (roof, boiler, parking lot, exteriors) have been made in the last 5 years, and what's planned in the next 2?
- Built in 1930 — when were the roof, HVAC, electrical panel, plumbing, and water heater last replaced?
- What's the actual annual flood-insurance premium (NFIP or private), and is the property in a SFHA with mandatory coverage?
- Is there a deadline driving the sale (1031 exchange, divorce, estate, relocation)? That informs how much negotiation room exists.
- Schools are F-rated, which usually means shorter tenancies and higher turnover. Who's the typical renter profile here, and what's been the actual vacancy rate?
- Crime grade is D in this area — have there been break-ins, vandalism, or insurance claims at this property in the last 3 years? What carrier currently insures it and at what premium?
- What's the average days-on-market for RENTAL listings here right now (not sales)? A rising rental-DOM trend means longer vacancies and softer asking-rent achievability than the comps imply.
- What's the recent tenant-quality profile in this submarket — average credit score on applications, eviction rate, late-payment / NSF rate, and stable-employment percentage? A property-management company in the area should have these aggregated.
- How much new apartment / multifamily construction is in the pipeline within 1–3 miles? Heavy new supply (>2% of stock underway) typically softens rents 12–24 months out; light construction supports rent growth.
Investment metrics
- 1% rule
- 1.76% ✓
- Cap rate
- 15.40%
- Cash-on-cash
- 32.54%
- DSCR
- 2.45
- GRM
- 4.7
CMA / ARV
- ARV (on-the-fly)
- $80,600
- Comps found
- 3
Show comp detail 3 sales within ~0.75 mi
| Address | Dist | Beds/Ba | Sqft | Sold | Price | $/sf | Match |
|---|---|---|---|---|---|---|---|
| 210 Division St | 0.23mi | 3/1.0 | 1,220 (-6%) | 22mo | $60,000 | $49 | 56 |
| 315 County St | 0.51mi | 3/2.0 | 1,286 (-1%) | 22mo | $80,000 | $62 | 56 |
| 400 South St | 0.50mi | 3/3.0 | 1,461 (+12%) | 10mo | $278,000 | $190 | 43 |
Match score weights: distance 35% · size 25% · config 20% · recency 20%. Top-matched comps best support the ARV.
Projected returns pro-forma
-3.0% appreciation · 3.0% rent growth · sell at horizon
- IRR
- 17.3%
- Equity multiple
- 1.70×
- Total profit
- $42,213
- Equity at exit
- $32,057
- IRR
- 25.9%
- Equity multiple
- 3.27×
- Total profit
- $136,645
- Equity at exit
- $18,589
Cash invested: $60,200 (down + closing). Projections, not guarantees.
Landlord ↔ Tenant lean methodology
- Overall (STATE)
- 41 Moderately Tenant-Leaning
- State Vermont
- 41 Moderately Tenant-Leaning · D+15
- County
- — inherits STATE
- City
- — inherits STATE
ZIP-level market 05201
- Home prices YoY
- -19.3%
- Active inventory
- 65
- Price-to-rent
- 9.5×
Monthly cashflow live
- Estimated rent
- $3,787 medium interval (Pro) →
- Mortgage (P&I)
- −$1,127
- Tax from tax record
- −$142 /mo · $1,705/yr
- Insurance
- −$90
- Flood insurance flood zone
- −$427 /mo · $5,118/yr
- HOA
- −$0
- Vacancy / Maint / Mgmt
- −$795
- Net cashflow
- $1,206
Break-even live
2-unit breakdown (identical units grouped — click to expand)
| Units | Beds | Baths | Est. rent |
|---|---|---|---|
| 2× units | 3 | 2 | $3,788 |
| #1 | 3 | 2 | $1,894 |
| #2 | 3 | 2 | $1,894 |
| Total (2 units) | $3,787 | ||
UW: 25.0% down · 7.5% · 30yr · 1.5% tax · 5.0% vac · 8.0% maint · 8.0% mgmt
Financing live
Cash to close
- Down payment
- $53,750
- Closing costs
- $6,450
- Reserves months
- —
- Total cash needed
- —
Loan-product check · same deal, 3 products live
Conventional
25% down · 7.5% · 30yr
- Down + closing
- —
- Monthly P&I
- —
- Monthly cashflow
- —
- DSCR
- —
- Eligible?
- —
Personal DTI + credit; lowest rate.
DSCR
20% down · 8.5% · 30yr
- Down + closing
- —
- Monthly P&I
- —
- Monthly cashflow
- —
- DSCR
- —
- Eligible?
- —
No personal income docs; deal must DSCR.
Hard money
10% down · 12.0% · 12mo
- Down + closing
- —
- Monthly P&I
- —
- Monthly cashflow
- —
- DSCR
- —
- Eligible?
- —
Short-term bridge; refi at stabilization.
Rent comps 1 comps
| Address | Beds | Baths | Sqft | Rent | $/sqft | DOM | Units | Dist |
|---|---|---|---|---|---|---|---|---|
| 34 West Rd Bennington, VT | 2.0 | 1.0 | 1590 | $2,100 | $1.32 | 19d | 1 | 1.43mi |
Listing history 18 events
-
2026-06-19days on market $215,000 Active 51 DOM
-
2026-06-18days on market $215,000 Active 50 DOM
-
2026-06-17days on market $215,000 Active 49 DOM
-
2026-06-16days on market $215,000 Active 48 DOM
-
2026-06-15days on market $215,000 Active 47 DOM
-
2026-06-14days on market $215,000 Active 45 DOM
-
2026-06-12days on market $215,000 Active 44 DOM
-
2026-06-09days on market $215,000 Active 41 DOM
-
2026-06-08days on market $215,000 Active 40 DOM
-
2026-06-07days on market $215,000 Active 39 DOM
-
2026-06-07days on market $215,000 Active 38 DOM
-
2026-06-04pricedays on market $215,000 Active 35 DOM
-
2026-06-02days on market $229,000 Active 34 DOM
-
2026-06-01days on market $229,000 Active 33 DOM
-
2026-05-31days on market $229,000 Active 32 DOM
-
2026-05-31days on market $229,000 Active 31 DOM
-
2026-05-13price $229,000
-
2026-04-29$235,000 Active
ⓘ Source: listings_history table (triggers on properties + properties_extension) + one-shot
backfill from property_details.listing_events for pre-trigger history.
Tax reassessment forecast VT · Partial reset (capped growth)
- Current annual tax
- $1,705 · $142/mo
- Projected year-2 tax
- $2,895 · $241/mo
- Expected delta
- +$1,190/yr (+$99/mo · 69.8%)
ⓘ Screening estimate from a state-policy table — verify with the county assessor before closing.
Climate risk First Street
- Flood 6/10 Major FEMA zone AE · 71% chance over 30 yrs
- Wildfire 1/10 Low
- Heat 3/10 Moderate 7 d/yr ≥92°F today · 17 d/yr by 30 yrs out
- Wind 3/10 Moderate 6% chance of damaging wind over 30 yrs
- Air quality 2/10 Low 0 unhealthy d/yr today · 1 by 30 yrs out
Nearby sold comps map
Loading sold comps map…
Walkable amenities ~0.75 mi
Loading nearby amenities…
Taxation est. · year 1
- Rental income
- $45,444
- − Mortgage interest
- −$12,043
- − Property taxes
- −$1,705
- − Insurance
- −$6,194
- − Repairs & maintenance
- −$3,636
- − Management
- −$3,636
- − Depreciation
- −$6,255
- Taxable income
- $11,976
- Est. tax owed @ 24.0%
- −$2,874
- After-tax cash flow
- $11,598/yr
For passive investors: Depreciation is non-cash, so a rental often shows a tax loss while cash-flowing — sheltering income. Rental losses are passive: they offset passive income freely, and up to $25,000/yr can offset ordinary (W-2) income if you actively participate and your MAGI is under $100k (phasing out to $0 by $150k); unused losses carry forward. On sale, claimed depreciation is recaptured at up to 25%, and gains may owe capital-gains tax (a 1031 exchange can defer both). Figures are a year-1 estimate at your 24.0% rate — not tax advice; consult a CPA.
Schools (NCES district)
No district data.
Livability — Bennington
- Score
- 64/100
- State rank
- #63
- US rank
- #14446
Category grades
Schools grade is shown separately in the Schools card above.
Census & demographics
- Census place
- Bennington, VT
- County
- Bennington County · 14,998 people
- City population
- 14,998
- Metro
- Bennington, VT
- Population (ZIP)
- 14,998
- Household income
- $59,798
- Rent vs Own
- Severe rent burden
- 982.0
Population outlook (Bennington County) Hauer SSP2
- Today (2025)
- 34,407 people
- By 2030
- 32,975 · -4.2%
- By 2040
- 29,711 · -13.6%
- By 2050
- 26,638 · -22.6%
- By 2075
- 21,318 · -38.0%
- By 2100
- 16,086 · -53.2%
Race, ethnicity, and origin ACS 2023
- Neighborhood character
- Predominantly White (92%)
- Race & ethnicity
- White 92% Two or more races 4% Hispanic / Latino 3%
- Common ancestry
- Lithuanian 10% Slovak 7% Romanian 3%
- Foreign-born
- 2% · Canada
- Languages at home
- 96% English-only · Spanish 2% Other Indo-European 1%
Political lean MEDSL · Bennington
- 2024 margin
- Strong D (+22.5) · D 60.0% · R 37.5% · Other 2.6%
- 2008→2024 swing
- -10.9pp toward R · 2008: 33.4pp · 2024: 22.5pp
- All cycles
- 2024: D+22.5 2020: D+27.3 2016: D+22.1 2012: D+33.3 2008: D+33.4
Not yet ingested
- Civics
- —
Market trends
- HPI YoY
- ▼ -60.78%
- Current HPI
- 254.5149
- Rent YoY
- —
- Metro
- Bennington, VT
- State GDP YoY
- —
- F500 in state
- 0
Price history
-2.6% since first listed2 events — show timeline
- 2026-05-13 Price Changed $229,000 PrimeMLS
- 2026-04-29 Listed $235,000 PrimeMLS
Property tax history
+6.9%/yrLatest (2024): $1,705 · +9.6% YoY. Source: county tax records.
Cash-flow waterfall
monthlySold comps — $/sqft
last 12 mo · ≤1 miLoading sold comps…