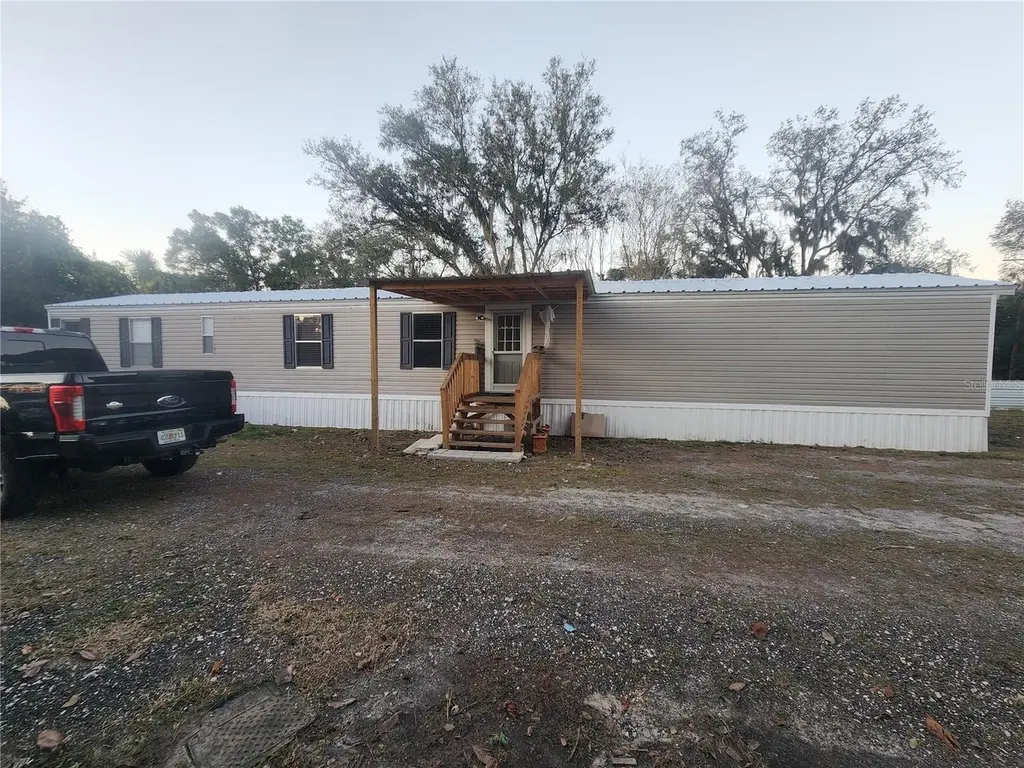
1333 Wilkinson Dr · Plant City, FL
Flood risk 1/10 · Minimal
- FEMA flood zone
- X (unshaded)
- Chance of flooding over 30 yrs
- 0.0%
- Est. flood insurance / yr
- $507 – $1,088
Fire risk 4/10 · Minor
- Est. fire insurance / yr
- $947 – $1,759
Heat risk 9/10 · Severe
- Hot days now (above 108°F)
- 7 days/yr
- Hot days in 30 yrs
- 26 days/yr
Wind risk 9/10 · Severe
- Chance of severe wind over 30 yrs
- 99.0%
Air-quality risk 3/10 · Minor
- Unhealthy air days now
- 2 days/yr
- Unhealthy air days in 30 yrs
- 3 days/yr
Risk factors via First Street. Map © Google.
Why this score? — see what drove the C+ grade
The composite is a weighted blend of 9 inputs, each scored 0–100. Each bar is that input's sub-score; the figure is the points it added to the 100-point composite (weight × sub-score).
- Cash flow +26.9/30.0
- DSCR +9.3/10.0
- ARV discount +7.5/15.0
- 1% rule +6.3/10.0
- Schools +4.2/10.0
- Rent growth +3.8/5.0
- Livability +3.8/5.0
- Condition / age +2.5/5.0
- Appreciation +0.0/10.0
$190,000
🖨 Deal sheet (PDF) 📄 Offer letter ✓ Due diligence
Listing remarks
ONLY CASH. Financing is not accepted—cash only—because the mobile home has been moved from its original location. Discover this incredible opportunity! This property sits on 0.26 acres of privately owned land and features a 2005 manufactured home, fully renovated and move-in ready. It offers the space and peace you’re looking for, combined with modern upgrades and a fresh, stylish design. The home includes a brand- new 2025 AC, 2025 septic tank, 2025 well, and a metal roof, providing durability and efficiency for years to come. Inside, you’ll find a completely updated interior with a modern kitchen, renovated bathrooms, updated flooring, and a clean, contemporary loo
Key facts
- Move-in ready
- Fully renovated
- Modern upgrades
Tags
Property features AI
Finance
- Financial info: No lease restrictions
- HOA & community: No association (no HOA)
Exterior
- Utilities: Private well water; Septic tank; Private utilities
- Home design: Manufactured single-wide home; One level; Faces west
- Construction: Metal siding; Metal roof; Block and brick/mortar foundation; Built on a 0.26-acre lot (approx. 95 x 125)
- Exterior features: Sliding doors; Paved road access
Interior
- Kitchen: Microwave; Range hood; Refrigerator
- Bedrooms: 3 bedrooms
- Flooring: Laminate
- Bathrooms: 2 full bathrooms
- Heating & cooling: Central heating (electric); Central air conditioning
- Interior features: Open floorplan with kitchen/family room combo; Living room/dining room combo; Solid surface counters; Solid wood cabinets; Thermostat; Walk-in closet(s)
- Laundry & utility: Washer; Dryer; Electric water heater; Laundry with corridor access
Neighborhood map
What this means for you Summary
Snapshot
- This is a 3-bed/2.0-bath land listed at $190k.
Deal economics
- At list price, monthly cash flow is $527 ($6k/yr) — positive.
- The deal already cash-flows at list — no discount required.
- Meets the 1% rule at list price ($2k rent vs $190k).
- Recommended offer: $187k (1.5% below list) — sets the bar for market timing.
Location & tenants
- Location reads 76/100 on livability (#227 in FL, #3,587 nationally) — a middle-class / working-renter tenant base. Strengths: amenities A+, cost of living A+, housing A+; Watch: employment C-, commute F.
- Hillsborough (suburban): math 47% / reading 50% proficiency, ranked #41 of 73 in FL (top 56%) — families likely to look elsewhere, expect single-tenant / working-renter base with shorter leases.
- Zoned schools: Walden Lake Elementary School (math 63% / reading 56%, grade B-, #690 of 2,144 statewide, top 34%, 847 students, 48% FRL); Tomlin Middle School (math 45% / reading 39%, grade D-, #340 of 571 statewide, top 61%, 1,499 students, 64% FRL); Strawberry Crest High School (math 49% / reading 55%, grade D+, #160 of 667 statewide, top 25%, 2,558 students, 44% FRL) — zoned schools at 52% FRL track the district average.
- Market conditions: Rents rising fast (+5.1%/yr); 166 active listings in the ZIP; 6 comparable units currently listed for rent nearby; rentals at typical pace (median 18d on market — plan ~3-4 weeks tenant-placement turnaround); 9,053 units permitted in Hillsborough County in 2024 (4,555 in 5+ unit buildings).
- This rent runs 36% of the median local income ($72k/yr) — at the standard rent-burdened threshold; future hikes will face affordability resistance.
Forward outlook
- Local home prices are declining (-3.0%/yr); year-one equity from $1k of loan paydown is wiped out by about $6k of value loss. Plan a longer hold.
- Hillsborough County population projected at +37% by 2050 — long-run rental-demand tailwind backs the buy-and-hold thesis.
- At projected returns (-3.0% appreciation + 5.1% rent growth), your $53k cash investment doubles in ~8 years — after that, you're playing with house money.
Negotiation context
- It's been on market 24 days — a 2% lower offer ($187k) is reasonable based on typical stale-listing flexibility.
- 4 sale attempts since 2y ago with the ask held roughly flat each time — persistent listings suggest the price (not the market) is what's stuck; bring a comps-based counter.
- Current owner paid $35k; list at $190k implies a 443% gain — meaningful room to come down on a strong offer.
Risks & watch-outs
- Climate carrying-cost: severe wind risk, 99% chance of damaging wind over 30y; extreme-heat days projected 7→26/yr by 2055 (HVAC capex compounding) — expect insurance premiums to compound above CPI over the hold.
Questions for the listing agent
- Is there a deadline driving the sale (1031 exchange, divorce, estate, relocation)? That informs how much negotiation room exists.
- Schools are D-rated, which usually means shorter tenancies and higher turnover. Who's the typical renter profile here, and what's been the actual vacancy rate?
- What's the average days-on-market for RENTAL listings here right now (not sales)? A rising rental-DOM trend means longer vacancies and softer asking-rent achievability than the comps imply.
- What's the recent tenant-quality profile in this submarket — average credit score on applications, eviction rate, late-payment / NSF rate, and stable-employment percentage? A property-management company in the area should have these aggregated.
- How much new for-sale + rental construction is in the pipeline within 1–3 miles? Heavy new supply typically softens prices + rents 12–24 months out; constrained supply supports both.
Investment metrics
- 1% rule
- 1.13% ✓
- Cap rate
- 9.62%
- Cash-on-cash
- 11.90%
- DSCR
- 1.53
- GRM
- 7.3
CMA / ARV
No comps found within radius.
Projected returns pro-forma
-3.0% appreciation · 5.09% rent growth · sell at horizon
- IRR
- 3.5%
- Equity multiple
- 1.14×
- Total profit
- $7,380
- Equity at exit
- $28,330
- IRR
- 14.8%
- Equity multiple
- 2.30×
- Total profit
- $69,282
- Equity at exit
- $16,428
Cash invested: $53,200 (down + closing). Projections, not guarantees.
Landlord ↔ Tenant lean methodology
- Overall (STATE)
- 87 Strongly Landlord-Friendly
- State Florida
- 87 Strongly Landlord-Friendly · R+3
- County
- — inherits STATE
- City
- — inherits STATE
ZIP-level market 33566
- Home prices YoY
- -18.9%
- Rents YoY
- 5.1%
- Active inventory
- 166
- Price-to-rent
- 7.3×
Monthly cashflow live
- Estimated rent
- $2,155 high interval (Pro) →
- Mortgage (P&I)
- −$996
- Tax from tax record
- −$99 /mo · $1,190/yr
- Insurance
- −$79
- HOA
- −$0
- Vacancy / Maint / Mgmt
- −$452
- Net cashflow
- $527
Break-even live
Sensitivity live
| Price | -10% $635 | -5% $581 | +0% $527 | +5% $474 | +10% $420 |
|---|---|---|---|---|---|
| Rent | -10% $357 | -5% $442 | +0% $527 | +5% $613 | +10% $698 |
| Rate | -1.0pp $623 | -0.5pp $576 | base $527 | +0.5pp $478 | +1.0pp $428 |
UW: 25.0% down · 7.5% · 30yr · 1.5% tax · 5.0% vac · 8.0% maint · 8.0% mgmt
Financing live
Cash to close
- Down payment
- $47,500
- Closing costs
- $5,700
- Reserves months
- —
- Total cash needed
- —
Loan-product check · same deal, 3 products live
Conventional
25% down · 7.5% · 30yr
- Down + closing
- —
- Monthly P&I
- —
- Monthly cashflow
- —
- DSCR
- —
- Eligible?
- —
Personal DTI + credit; lowest rate.
DSCR
20% down · 8.5% · 30yr
- Down + closing
- —
- Monthly P&I
- —
- Monthly cashflow
- —
- DSCR
- —
- Eligible?
- —
No personal income docs; deal must DSCR.
Hard money
10% down · 12.0% · 12mo
- Down + closing
- —
- Monthly P&I
- —
- Monthly cashflow
- —
- DSCR
- —
- Eligible?
- —
Short-term bridge; refi at stabilization.
Rent comps 6 comps
| Address | Beds | Baths | Sqft | Rent | $/sqft | DOM | Units | Dist |
|---|---|---|---|---|---|---|---|---|
| 4733 N Dawnmeadow Ct Plant City, FL | 3.0 | 2.0 | 1286 | $1,600 | $1.24 | 1d | 1 | 0.86mi |
| 411 Abigail Rd Plant City, FL | 3.0 | 2.0 | 1309 | $1,933 | $1.48 | 3d | 1 | 1.02mi |
| 4522 Reynolds Creek Ave Plant City, FL | 3.0 | 2.0 | 1172 | $1,979 | $1.69 | 18d | 1 | 1.06mi |
| 530 Scarlet Maple Ct Plant City, FL | 3.0 | 2.0 | 1119 | $1,899 | $1.70 | 4d | 1 | 1.29mi |
| 2525 Turkey Creek Rd Plant City, FL | 3.0 | 2.0 | 1152 | $1,850 | $1.61 | 26d | 1 | 1.42mi |
| 3817 Creek Way Ct Plant City, FL | 3.0 | 2.0 | 1149 | $2,099 | $1.83 | 26d | 1 | 1.48mi |
Listing history 31 events
-
2026-06-21days on market $190,000 Active 24 DOM
-
2026-06-18days on market $190,000 Active 21 DOM
-
2026-06-17days on market $190,000 Active 20 DOM
-
2026-06-16days on market $190,000 Active 19 DOM
-
2026-06-15days on market $190,000 Active 18 DOM
-
2026-06-13days on market $190,000 Active 16 DOM
-
2026-06-13days on market $190,000 Active 15 DOM
-
2026-06-09days on market $190,000 Active 12 DOM
-
2026-06-08days on market $190,000 Active 11 DOM
-
2026-06-07days on market $190,000 Active 10 DOM
-
2026-06-04days on market $190,000 Active 7 DOM
-
2026-06-03days on market $190,000 Active 6 DOM
-
2026-06-02days on market $190,000 Active 5 DOM
-
2026-06-01days on market $190,000 Active 4 DOM
-
2026-05-31days on market $190,000 Active 3 DOM
-
2026-04-06price $206,000 1253-char remark
-
2026-04-01price $190,000 1253-char remark
-
2026-03-16price $195,000 1253-char remark
-
2026-03-11price $199,000 1253-char remark
-
2026-03-06price $210,000 1253-char remark
-
2025-12-12$220,000 Active 1253-char remark
-
2025-08-29status Pending
-
2025-08-28historical
-
2025-08-18$255,000 Active
-
2024-11-25soldstatus $35,000
-
2024-11-21soldstatus $35,000 Closed
-
2024-10-28status Pending
-
2024-10-24$25,000 Active
-
2003-09-05soldstatus $40,000
-
1996-04-02soldstatus $50,000
-
1987-04-01soldstatus $60,000
ⓘ Source: listings_history table (triggers on properties + properties_extension) + one-shot
backfill from property_details.listing_events for pre-trigger history.
Tax reassessment forecast FL · Resets to sale price
- Current annual tax
- $1,190 · $99/mo
- Projected year-2 tax
- $1,577 · $131/mo
- Expected delta
- +$387/yr (+$32/mo · 32.5%)
ⓘ Screening estimate from a state-policy table — verify with the county assessor before closing.
Climate risk First Street
- Flood 1/10 Low FEMA zone X (unshaded) · 0% chance over 30 yrs
- Wildfire 4/10 Moderate
- Heat 9/10 Extreme 7 d/yr ≥108°F today · 26 d/yr by 30 yrs out
- Wind 9/10 Extreme 99% chance of damaging wind over 30 yrs
- Air quality 3/10 Moderate 2 unhealthy d/yr today · 3 by 30 yrs out
Nearby sold comps map
Loading sold comps map…
Walkable amenities ~0.75 mi
Loading nearby amenities…
Taxation est. · year 1
- Rental income
- $25,857
- − Mortgage interest
- −$10,643
- − Property taxes
- −$1,190
- − Insurance
- −$950
- − Repairs & maintenance
- −$2,069
- − Management
- −$2,069
- − Depreciation
- −$5,527
- Taxable income
- $3,409
- Est. tax owed @ 24.0%
- −$818
- After-tax cash flow
- $5,512/yr
For passive investors: Depreciation is non-cash, so a rental often shows a tax loss while cash-flowing — sheltering income. Rental losses are passive: they offset passive income freely, and up to $25,000/yr can offset ordinary (W-2) income if you actively participate and your MAGI is under $100k (phasing out to $0 by $150k); unused losses carry forward. On sale, claimed depreciation is recaptured at up to 25%, and gains may owe capital-gains tax (a 1031 exchange can defer both). Figures are a year-1 estimate at your 24.0% rate — not tax advice; consult a CPA.
Schools (NCES district)
- District
- Hillsborough
- NCES district ID
- 1200870
- Math proficiency
- 47% ▼ -8.00%
- Reading proficiency
- 50% ▼ -4.00%
- Median HH income
- $50,622
- Composite
- 41.6/100
- National rank
- #3435
- State rank
- #41 of 73 in FL
Livability — Plant City
- Score
- 76/100
- State rank
- #227
- US rank
- #3587
Category grades
Schools grade is shown separately in the Schools card above.
Census & demographics
- County
- Hillsborough County · 1,540,968 people
- City population
- 68,525
- Metro
- Tampa-St. Petersburg-Clearwater, FL
- Population (ZIP)
- 24,521
- Household income
- $72,393
- Rent vs Own
- Severe rent burden
- 376.0
Population outlook (Hillsborough County) Hauer SSP2
- Today (2025)
- 1,607,022 people
- By 2030
- 1,733,968 · +7.9%
- By 2040
- 1,979,565 · +23.2%
- By 2050
- 2,203,427 · +37.1%
- By 2075
- 2,667,893 · +66.0%
- By 2100
- 2,891,558 · +79.9%
Race, ethnicity, and origin ACS 2023
- Neighborhood character
- Diverse neighborhood (Simpson 0.59)
- Race & ethnicity
- White 54% Hispanic / Latino 34% Two or more races 14% Black 8% Asian 2%
- Hispanic origin (detail)
- Mexican 19% Puerto Rican 7% Cuban 4%
- Common ancestry
- Lithuanian 2% Serbian 2% Romanian 1%
- Foreign-born
- 17% · Canada, Jamaica
- Languages at home
- 73% English-only · Spanish 26% Other Asian/Pacific 1%
Political lean MEDSL · Hillsborough
- 2024 margin
- Toss-up / Even · D 47.8% · R 50.9% · Other 1.3%
- 2008→2024 swing
- -10.2pp toward R · 2008: 7.1pp · 2024: -3.1pp
- All cycles
- 2024: R+3.1 2020: D+6.9 2016: D+6.8 2012: D+6.7 2008: D+7.1
Not yet ingested
- Civics
- —
Market trends
- HPI YoY
- ▼ -69.40%
- Current HPI
- 298.1385
- Rent YoY
- ▲ 5.09%
- Metro
- Tampa-St. Petersburg-Clearwater, FL
- State GDP YoY
- ▲ 3.28%
- F500 in state
- 36
Industry mix (Fortune 500 HQ in FL)
| Industry | F500 HQs | Revenue |
|---|---|---|
| Industrial Technology | 2 | $29B |
|
||
| Insurance | 2 | $17B |
|
||
| Retail | 1 | $60B |
|
||
| Technology Distribution | 1 | $58B |
|
||
| Homebuilding | 1 | $35B |
|
||
| Technology Manufacturing | 1 | $35B |
|
||
Price history
+216.7% since first listed18 events — show timeline
- 2026-05-28 Listed $190,000 Stellar MLS as Distributed by MLS Grid
- 2026-05-22 Listing Removed — Stellar MLS as Distributed by MLS Grid
- 2026-04-06 Price Changed $206,000 Stellar MLS as Distributed by MLS Grid
- 2026-04-01 Price Changed $190,000 Stellar MLS as Distributed by MLS Grid
- 2026-03-16 Price Changed $195,000 Stellar MLS as Distributed by MLS Grid
- 2026-03-11 Price Changed $199,000 Stellar MLS as Distributed by MLS Grid
- 2026-03-06 Price Changed $210,000 Stellar MLS as Distributed by MLS Grid
- 2025-12-12 Listed $220,000 Stellar MLS as Distributed by MLS Grid
- 2025-08-29 Pending — Stellar MLS as Distributed by MLS Grid
- 2025-08-28 Listing Removed — Stellar MLS as Distributed by MLS Grid
- 2025-08-18 Listed $255,000 Stellar MLS as Distributed by MLS Grid
- 2024-11-25 Sold (Public Records) $35,000 Public Records
- 2024-11-21 Sold (MLS) $35,000 Stellar MLS as Distributed by MLS Grid
- 2024-10-28 Pending — Stellar MLS as Distributed by MLS Grid
- 2024-10-24 Listed $25,000 Stellar MLS as Distributed by MLS Grid
- 2003-09-05 Sold (Public Records) $40,000 Public Records
- 1996-04-02 Sold (Public Records) $50,000 Public Records
- 1987-04-01 Sold (Public Records) $60,000 Public Records
Property tax history
+4.5%/yrLatest (2025): $1,190 · +17.9% YoY. Source: county tax records.
Cash-flow waterfall
monthlySold comps — $/sqft
last 12 mo · ≤1 miLoading sold comps…