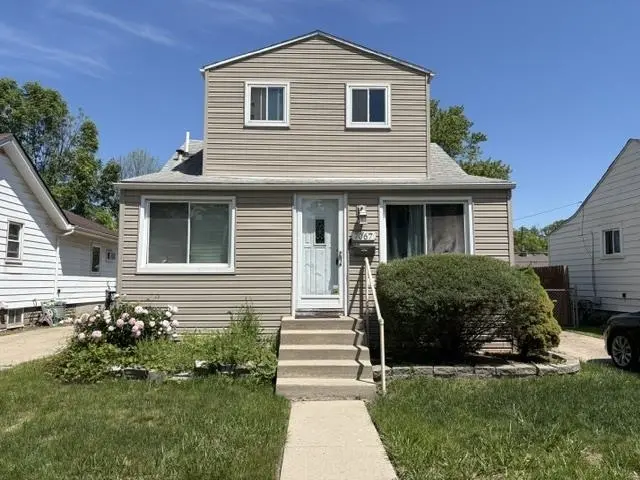
7067 Chalmers Ave Ave · Warren, MI
Flood risk 1/10 · Minimal
- FEMA flood zone
- X (unshaded)
- Chance of flooding over 30 yrs
- 0.0%
- Est. flood insurance / yr
- $473 – $860
Fire risk 1/10 · Minimal
- Est. fire insurance / yr
- $784 – $1,456
Heat risk 3/10 · Minor
- Hot days now (above 97°F)
- 7 days/yr
- Hot days in 30 yrs
- 15 days/yr
Wind risk 1/10 · Minimal
- Chance of severe wind over 30 yrs
- —
Air-quality risk 3/10 · Minor
- Unhealthy air days now
- 3 days/yr
- Unhealthy air days in 30 yrs
- 4 days/yr
Risk factors via First Street. Map © Google.
Why this score? — see what drove the C- grade
The composite is a weighted blend of 9 inputs, each scored 0–100. Each bar is that input's sub-score; the figure is the points it added to the 100-point composite (weight × sub-score).
- Cash flow +21.3/30.0
- ARV discount +9.1/15.0
- DSCR +6.8/10.0
- 1% rule +5.5/10.0
- Livability +3.7/5.0
- Rent growth +3.1/5.0
- Condition / age +2.5/5.0
- Schools +1.0/10.0
- Appreciation +0.0/10.0
$139,900
🖨 Deal sheet 📄 Offer letter ✓ Due diligence
Listing remarks MLS
Come check out this cute home in Warren. This 3 bedroom 3 bathroom house is great for a first-time home buyer, investor or a family looking for more space. 2 car garage with plenty of space.
Key facts
- 4346 acre lot
- 2 garage spots
- Built 1940
Property features AI
Finance
- Other: Above-grade finished area approximately 1,170 (units recorded as square feet); Lot size recorded as 0.10 (4,346 sq ft); Listing broker: The Agency of Gateway
- HOA & community: Homeowners association present
Exterior
- Parking: Detached 2-car garage
- Utilities: Public water; Public sewer available
- Home design: Single-family residence; Two-story home; Residential property
- Construction: Vinyl siding construction
- Exterior features: Lot in PIPERS VAN DYKE SUB4 subdivision; Cross streets: Peters Ave and Memphis Ave
Interior
- Bathrooms: Three full bathrooms
- Heating & cooling: Forced air heating (natural gas); No central cooling reported
- Interior features: Basement present; Total of 4 rooms
Neighborhood map
What this means for you Summary
Snapshot
- This is a 4-bed/1.0-bath single-family listed at $140k.
Deal economics
- At list price, monthly cash flow is $204 ($2k/yr) — positive.
- The deal already cash-flows at list — no discount required.
- Meets the 1% rule at list price ($1k rent vs $140k).
- Recommended offer: $138k (1.5% below list) — sets the bar for market timing.
- Cap rate 8.0% vs local median 5.3% in Warren — top-decile yield for the area; either an underpriced asset or a hidden risk that comps aren't pricing in. Stress-test before assuming the spread holds.
Location & tenants
- Location reads 74/100 on livability (#171 in MI, #4,491 nationally) — a middle-class / working-renter tenant base. Strengths: commute A+, cost of living A+, housing A+; Watch: schools D, amenities D, employment D.
- Van Dyke Public Schools (urban): math 7% / reading 19% proficiency, ranked #512 of 540 in MI (top 95%) — low school quality limits family demand, transient renter base, plan for 1-2y turnover; 80% free/reduced lunch — lower-income household profile, screen leases tightly.
- Market conditions: Rents rising (+2.4%/yr); 168 active listings in the ZIP; 32 comparable units currently listed for rent nearby; rentals at typical pace (median 24d on market — plan ~3-4 weeks tenant-placement turnaround); 1,321 units permitted in Macomb County in 2024 (86 in 5+ unit buildings).
- This rent runs 33% of the median local income ($54k/yr) — at the standard rent-burdened threshold; future hikes will face affordability resistance.
Forward outlook
- Local home prices are declining (-3.0%/yr); year-one equity from $967 of loan paydown is wiped out by about $4k of value loss. Plan a longer hold.
- Macomb County population projected at +9% by 2050 — modest demand growth; plan on rents tracking national, not racing it.
Negotiation context
- It's been on market 16 days — a 2% lower offer ($138k) is reasonable based on typical stale-listing flexibility.
- 11 sale attempts since 17y ago with the ask held roughly flat each time — persistent listings suggest the price (not the market) is what's stuck; bring a comps-based counter.
- Current owner paid $70k; list at $140k implies a 100% gain — meaningful room to come down on a strong offer.
Risks & watch-outs
- Watch-outs: built in 1940 — expect roof / HVAC / electrical / plumbing capex.
Questions for the listing agent
- Built in 1940 — when were the roof, HVAC, electrical panel, plumbing, and water heater last replaced?
- Is there a deadline driving the sale (1031 exchange, divorce, estate, relocation)? That informs how much negotiation room exists.
- Schools are D-rated, which usually means shorter tenancies and higher turnover. Who's the typical renter profile here, and what's been the actual vacancy rate?
- Crime grade is D in this area — have there been break-ins, vandalism, or insurance claims at this property in the last 3 years? What carrier currently insures it and at what premium?
- What's the average days-on-market for RENTAL listings here right now (not sales)? A rising rental-DOM trend means longer vacancies and softer asking-rent achievability than the comps imply.
- What's the recent tenant-quality profile in this submarket — average credit score on applications, eviction rate, late-payment / NSF rate, and stable-employment percentage? A property-management company in the area should have these aggregated.
- How much new for-sale + rental construction is in the pipeline within 1–3 miles? Heavy new supply typically softens prices + rents 12–24 months out; constrained supply supports both.
Investment metrics
- 1% rule
- 1.05% ✓
- Cap rate
- 8.04%
- Cash-on-cash
- 6.24%
- DSCR
- 1.28
- GRM
- 7.9
CMA / ARV
- ARV (on-the-fly)
- $145,080
- Comps found
- 12
Show comp detail 12 sales within ~0.75 mi
| Address | Dist | Beds/Ba | Sqft | Sold | Price | $/sf | Match |
|---|---|---|---|---|---|---|---|
| 7052 Studebaker Ave | 0.03mi | 3/2.0 (-1) | 1,242 (+6%) | 1mo | $152,500 | $123 | 78 |
| 7027 Meadow Ave | 0.16mi | 3/1.0 (-1) | 1,112 (-5%) | 5mo | $76,000 | $68 | 75 |
| 7259 Packard Ave | 0.16mi | 3/1.5 (-1) | 1,089 (-7%) | 2mo | $160,000 | $147 | 72 |
| 7051 Maxwell Ave | 0.35mi | 3/1.0 (-1) | 1,234 (+6%) | 3mo | $135,000 | $109 | 67 |
| 7519 Packard Ave | 0.19mi | 3/2.0 (-1) | 1,291 (+10%) | 3mo | $224,500 | $174 | 62 |
| 7035 Dodge Ave | 0.40mi | 3/1.0 (-1) | 1,056 (-10%) | 1mo | $84,000 | $80 | 59 |
| 7244 Fisher Ave | 0.43mi | 4/1.0 | 1,014 (-13%) | 3mo | $154,900 | $153 | 56 |
| 8268 Hudson Ave | 0.46mi | 3/2.0 (-1) | 1,258 (+8%) | 2mo | $145,000 | $115 | 55 |
| 8316 Hudson Ave | 0.50mi | 3/1.0 (-1) | 1,300 (+11%) | 1mo | $94,000 | $72 | 52 |
| 8286 Westminster Ave | 0.60mi | 3/2.5 (-1) | 1,250 (+7%) | 2mo | $250,000 | $200 | 48 |
| 8244 Hupp Ave | 0.46mi | 3/2.0 (-1) | 1,300 (+11%) | 3mo | $188,500 | $145 | 48 |
| 8434 Orchard Ave | 0.57mi | 3/1.0 (-1) | 1,012 (-14%) | 1mo | $125,000 | $124 | 45 |
Match score weights: distance 35% · size 25% · config 20% · recency 20%. Top-matched comps best support the ARV.
Projected returns pro-forma
-3.0% appreciation · 2.35% rent growth · sell at horizon
- IRR
- -7.4%
- Equity multiple
- 0.73×
- Total profit
- $-10,629
- Equity at exit
- $20,860
- IRR
- 1.4%
- Equity multiple
- 1.09×
- Total profit
- $3,656
- Equity at exit
- $12,096
Cash invested: $39,172 (down + closing). Projections, not guarantees.
Landlord ↔ Tenant lean methodology
- Overall (STATE)
- 62 Landlord-Friendly
- State Michigan
- 62 Landlord-Friendly · EVEN
- County
- — inherits STATE
- City
- — inherits STATE
ZIP-level market 48091
- Rents YoY
- 2.4%
- Active inventory
- 168
- Price-to-rent
- 7.9×
Monthly cashflow live
- Estimated rent
- $1,473 high interval (Pro) →
- Mortgage (P&I)
- −$734
- Tax from tax record
- −$168 /mo · $2,015/yr
- Insurance
- −$58
- HOA
- −$0
- Vacancy / Maint / Mgmt
- −$309
- Net cashflow
- $204
Break-even live
UW: 25.0% down · 7.5% · 30yr · 1.5% tax · 5.0% vac · 8.0% maint · 8.0% mgmt
Financing live
Cash to close
- Down payment
- $34,975
- Closing costs
- $4,197
- Reserves months
- —
- Total cash needed
- —
Loan-product check · same deal, 3 products live
Conventional
25% down · 7.5% · 30yr
- Down + closing
- —
- Monthly P&I
- —
- Monthly cashflow
- —
- DSCR
- —
- Eligible?
- —
Personal DTI + credit; lowest rate.
DSCR
20% down · 8.5% · 30yr
- Down + closing
- —
- Monthly P&I
- —
- Monthly cashflow
- —
- DSCR
- —
- Eligible?
- —
No personal income docs; deal must DSCR.
Hard money
10% down · 12.0% · 12mo
- Down + closing
- —
- Monthly P&I
- —
- Monthly cashflow
- —
- DSCR
- —
- Eligible?
- —
Short-term bridge; refi at stabilization.
Rent comps 32 comps
| Address | Beds | Baths | Sqft | Rent | $/sqft | DOM | Units | Dist |
|---|---|---|---|---|---|---|---|---|
| 7511 Toepfer Rd Warren, MI | 3.0 | 1.0 | 1032 | $1,199 | $1.16 | 21d | 1 | 0.14mi |
| 7568 Hudson Ave Unit 1 Warren, MI | 3.0 | 1.0 | 1415 | $1,100 | $0.78 | 4d | 1 | 0.18mi |
| 7060 Victory Ave Warren, MI | 3.0 | 1.0 | 945 | $1,450 | $1.53 | 11d | 1 | 0.28mi |
| 8251 Hudson Ave Warren, MI | 3.0 | 1.0 | 908 | $1,400 | $1.54 | 24d | 1 | 0.45mi |
| 8632 Studebaker Ave Warren, MI | 3.0 | 1.0 | 761 | $1,300 | $1.71 | 2d | 1 | 0.68mi |
| 8242 Jackson Ave Warren, MI | 3.0 | 1.0 | 840 | $1,198 | $1.43 | 43d | 1 | 0.69mi |
| 8640 Chalmers Ave Warren, MI | 3.0 | 1.0 | 804 | $1,423 | $1.77 | 24d | 1 | 0.69mi |
| 8285 Rivard Ave Warren, MI | 3.0 | 1.0 | 902 | $1,549 | $1.72 | 24d | 1 | 0.73mi |
| 7256 Ready Ave Warren, MI | 3.0 | 2.0 | 1300 | $1,500 | $1.15 | 24d | 1 | 0.76mi |
| 8125 Timken Ave Warren, MI | 3.0 | 1.0 | 948 | $1,270 | $1.34 | 4d | 1 | 0.78mi |
| 8509 Paige Ave Warren, MI | 3.0 | 1.0 | 950 | $1,300 | $1.37 | 24d | 1 | 0.79mi |
| 21456 Syracuse Ave Warren, MI | 3.0 | 1.0 | 1160 | $1,595 | $1.38 | 43d | 1 | 0.83mi |
| 21456 Syracuse Ave Warren, MI | 3.0 | 1.0 | 1152 | $1,595 | $1.38 | 1d | 1 | 0.83mi |
| 21465 Syracuse Ave Warren, MI | 3.0 | 1.0 | 990 | $1,375 | $1.39 | 43d | 1 | 0.85mi |
| 8428 Timken Ave Warren, MI | 3.0 | 1.0 | 860 | $1,250 | $1.45 | 24d | 1 | 0.87mi |
| 11076 Hudson Ave Warren, MI | 3.0 | 1.0 | 936 | $1,395 | $1.49 | 2d | 1 | 0.87mi |
| 8693 Paige Ave Warren, MI | 3.0 | 1.0 | 900 | $1,300 | $1.44 | 24d | 1 | 0.88mi |
| 8707 Continental Ave Warren, MI | 3.0 | 1.0 | 1100 | $1,200 | $1.09 | 4d | 1 | 0.93mi |
| 8707 Continental Ave Warren, MI | 3.0 | 1.0 | 968 | $1,200 | $1.24 | 17d | 1 | 0.93mi |
| 22622 Panama Ave Warren, MI | 3.0 | 1.5 | 920 | $1,395 | $1.52 | 10d | 1 | 0.94mi |
| 21410 Panama St Warren, MI | 3.0 | 1.0 | 900 | $1,600 | $1.78 | 24d | 1 | 0.95mi |
| 20042 Rogge St Detroit, MI | 4.0 | 2.0 | 1232 | $1,394 | $1.13 | 43d | 1 | 0.95mi |
| 8716 Timken Ave Warren, MI | 3.0 | 1.0 | 1008 | $1,400 | $1.39 | 24d | 1 | 1.02mi |
| 11319 Chalmers Ave Warren, MI | 3.0 | 1.0 | 975 | $1,500 | $1.54 | 24d | 1 | 1.03mi |
| 11076 Essex Ave Warren, MI | 4.0 | 1.0 | 1072 | $1,400 | $1.31 | 43d | 1 | 1.13mi |
| 11377 Sherman Ave Warren, MI | 3.0 | 1.0 | 1200 | $1,400 | $1.17 | 24d | 1 | 1.14mi |
| 20263 Caldwell St Detroit, MI | 3.0 | 1.0 | 909 | $1,350 | $1.49 | 16d | 1 | 1.17mi |
| 11332 Republic Ave Warren, MI | 3.0 | 1.0 | 1140 | $1,500 | $1.32 | 24d | 1 | 1.18mi |
| 20794 Audrey Ave Warren, MI | 3.0 | 1.0 | 954 | $1,350 | $1.42 | 43d | 1 | 1.26mi |
| 22580 Masch Ave Warren, MI | 3.0 | 1.0 | 988 | $1,450 | $1.47 | 24d | 1 | 1.32mi |
| 20058 Bloom St Detroit, MI | 4.0 | 1.0 | 1350 | $1,450 | $1.07 | 16d | 1 | 1.33mi |
| 19415 Gable St Detroit, MI | 3.0 | 1.0 | 1000 | $1,373 | $1.37 | 24d | 1 | 1.46mi |
Listing history 13 events
-
2026-06-18price $139,900 Active 16 DOM
-
2026-06-18days on market $145,000 Active 16 DOM
-
2026-06-17days on market $145,000 Active 15 DOM
-
2026-06-16days on market $145,000 Active 14 DOM
-
2026-06-15days on market $145,000 Active 13 DOM
-
2026-06-13days on market $145,000 Active 11 DOM
-
2026-06-13days on market $145,000 Active 10 DOM
-
2026-06-09days on market $145,000 Active 7 DOM
-
2026-06-08days on market $145,000 Active 6 DOM
-
2026-06-07days on market $145,000 Active 5 DOM
-
2026-06-04days on market $145,000 Active 2 DOM
-
2026-06-02remarks 190-char remark
Show marketing remark (190 chars)
Come check out this cute home in Warren. This 3 bedroom 3 bathroom house is great for a first-time home buyer, investor or a family looking for more space. 2 car garage with plenty of space.
-
2026-06-02$145,000 Active 1 DOM
Show marketing remark (190 chars)
Come check out this cute home in Warren. This 3 bedroom 3 bathroom house is great for a first-time home buyer, investor or a family looking for more space. 2 car garage with plenty of space.
ⓘ Source: listings_history table (triggers on properties + properties_extension) + one-shot
backfill from property_details.listing_events for pre-trigger history.
Tax reassessment forecast MI · Partial reset (capped growth)
- Current annual tax
- $2,015 · $168/mo
- Projected year-2 tax
- $2,085 · $174/mo
- Expected delta
- +$70/yr (+$6/mo · 3.5%)
ⓘ Screening estimate from a state-policy table — verify with the county assessor before closing.
Climate risk First Street
- Flood 1/10 Low FEMA zone X (unshaded) · 0% chance over 30 yrs
- Wildfire 1/10 Low
- Heat 3/10 Moderate 7 d/yr ≥97°F today · 15 d/yr by 30 yrs out
- Wind 1/10 Low
- Air quality 3/10 Moderate 3 unhealthy d/yr today · 4 by 30 yrs out
Nearby sold comps map
Loading sold comps map…
Walkable amenities ~0.75 mi
Loading nearby amenities…
Taxation est. · year 1
- Rental income
- $17,676
- − Mortgage interest
- −$7,837
- − Property taxes
- −$2,015
- − Insurance
- −$700
- − Repairs & maintenance
- −$1,414
- − Management
- −$1,414
- − Depreciation
- −$4,070
- Taxable income
- $227
- Est. tax owed @ 24.0%
- −$54
- After-tax cash flow
- $2,391/yr
For passive investors: Depreciation is non-cash, so a rental often shows a tax loss while cash-flowing — sheltering income. Rental losses are passive: they offset passive income freely, and up to $25,000/yr can offset ordinary (W-2) income if you actively participate and your MAGI is under $100k (phasing out to $0 by $150k); unused losses carry forward. On sale, claimed depreciation is recaptured at up to 25%, and gains may owe capital-gains tax (a 1031 exchange can defer both). Figures are a year-1 estimate at your 24.0% rate — not tax advice; consult a CPA.
Schools (NCES district)
- District
- Van Dyke Public Schools
- NCES district ID
- 2634680
- Math proficiency
- 7% ▼ -11.00%
- Reading proficiency
- 19% ▼ -5.00%
- Median HH income
- $33,231
- Composite
- 10.46/100
- National rank
- #9784
- State rank
- #512 of 540 in MI
Livability — Warren
- Score
- 74/100
- State rank
- #171
- US rank
- #4491
Category grades
Schools grade is shown separately in the Schools card above.
Census & demographics
- Census place
- Warren, MI
- County
- Macomb County · 638,552 people
- City population
- 114,937
- Metro
- Detroit-Warren-Dearborn, MI
- Population (ZIP)
- 30,696
- Household income
- $54,230
- Rent vs Own
- Severe rent burden
- 1296.0
Population outlook (Macomb County) Hauer SSP2
- Today (2025)
- 925,296 people
- By 2030
- 948,226 · +2.5%
- By 2040
- 983,961 · +6.3%
- By 2050
- 1,010,200 · +9.2%
- By 2075
- 1,076,222 · +16.3%
- By 2100
- 1,077,065 · +16.4%
Race, ethnicity, and origin ACS 2023
- Neighborhood character
- Diverse neighborhood (Simpson 0.68)
- Race & ethnicity
- White 47% Black 25% Asian 19% Two or more races 5% Hispanic / Latino 3% Native American 2%
- Common ancestry
- Romanian 7% Lithuanian 2% Slovak 1%
- Foreign-born
- 16% · Canada
- Languages at home
- 77% English-only · Other Indo-European 14% Other Asian/Pacific 3% Russian/Polish/Slavic 2%
Political lean MEDSL · Macomb
- 2024 margin
- R (+13.7) · D 42.2% · R 55.9% · Other 1.9%
- 2008→2024 swing
- -22.3pp toward R · 2008: 8.6pp · 2024: -13.7pp
- All cycles
- 2024: R+13.7 2020: R+8.1 2016: R+11.6 2012: D+4.0 2008: D+8.6
Not yet ingested
- Civics
- —
Market trends
- HPI YoY
- ▼ -199.66%
- Current HPI
- 177.9273
- Rent YoY
- ▲ 2.35%
- Metro
- Detroit-Warren-Dearborn, MI
- State GDP YoY
- ▲ 1.37%
- F500 in state
- 28
Industry mix (Fortune 500 HQ in MI)
| Industry | F500 HQs | Revenue |
|---|---|---|
| Automotive Parts | 3 | $48B |
|
||
| Automotive | 2 | $372B |
|
||
| Chemicals | 1 | $45B |
|
||
| Automotive Retail | 1 | $29B |
|
||
| Healthcare / Medical Devices | 1 | $23B |
|
||
| Automotive Technology | 1 | $20B |
|
||
Price history
+417.9% since first listed25 events — show timeline
- 2026-06-02 Listed $145,000 MiRealSource-MiMLS
- 2026-06-02 Listed $145,000 REALCOMP
- 2018-10-01 Sold (Public Records) $70,000 Public Records
- 2018-09-27 Sold (MLS) $70,000 REALCOMP
- 2018-08-25 Pending — MiRealSource-MiMLS
- 2018-08-25 Pending — REALCOMP
- 2018-08-14 Price Changed $70,000 MiRealSource-MiMLS
- 2018-08-13 Price Changed $70,000 REALCOMP
- 2018-08-01 Listing Removed — REALCOMP
- 2018-08-01 Listing Removed — MiRealSource-MiMLS
- 2018-07-31 Listed $75,000 MiRealSource-MiMLS
- 2018-07-31 Listed $75,000 MiRealSource-MiMLS
- 2018-07-31 Listed $75,000 REALCOMP
- 2018-07-31 Listed $75,000 REALCOMP
- 2010-05-19 Sold (MLS) $15,000 REALCOMP
- 2010-04-01 Listed $25,000 REALCOMP
- 2010-04-01 Listing Removed — MiRealSource-MiMLS
- 2010-03-31 Listing Removed — REALCOMP
- 2009-09-24 Listed $28,000 REALCOMP
- 2009-09-24 Listed $28,000 MiRealSource-MiMLS
- 2009-08-07 Sold (MLS) $20,000 MiRealSource-MiMLS
- 2009-08-07 Sold (MLS) $20,000 REALCOMP
- 2009-07-01 Listing Removed — MiRealSource-MiMLS
- 2009-06-07 Listed $28,000 MiRealSource-MiMLS
- 2009-06-07 Listed $28,000 REALCOMP
Property tax history
+6.4%/yrLatest (2025): $2,015 · +2.5% YoY. Source: county tax records.
Cash-flow waterfall
monthlySold comps — $/sqft
last 12 mo · ≤1 miLoading sold comps…