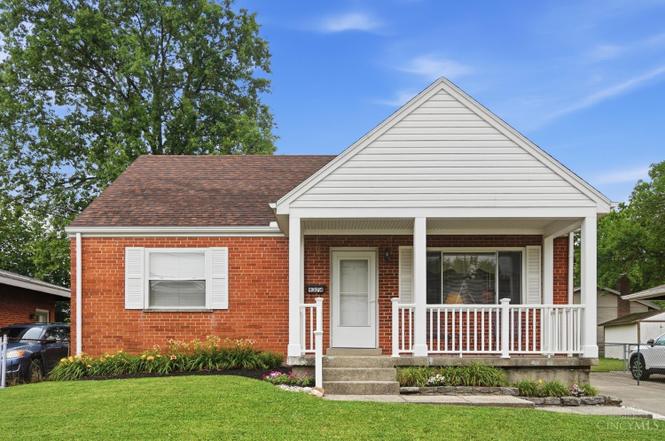
9374 Silva Dr · Northgate, OH
Flood risk 1/10 · Minimal
- FEMA flood zone
- X (unshaded)
- Chance of flooding over 30 yrs
- 0.0%
- Est. flood insurance / yr
- $473 – $860
Fire risk 1/10 · Minimal
- Est. fire insurance / yr
- $713 – $1,323
Heat risk 4/10 · Minor
- Hot days now (above 103°F)
- 7 days/yr
- Hot days in 30 yrs
- 19 days/yr
Wind risk 2/10 · Minimal
- Chance of severe wind over 30 yrs
- 1.0%
Air-quality risk 2/10 · Minimal
- Unhealthy air days now
- 1 days/yr
- Unhealthy air days in 30 yrs
- 1 days/yr
Risk factors via First Street. Map © Google.
Why this score? — see what drove the D grade
The composite is a weighted blend of 9 inputs, each scored 0–100. Each bar is that input's sub-score; the figure is the points it added to the 100-point composite (weight × sub-score).
- Cash flow +15.3/30.0
- ARV discount +7.5/15.0
- DSCR +4.7/10.0
- Livability +4.2/5.0
- 1% rule +4.1/10.0
- Schools +3.7/10.0
- Rent growth +2.5/5.0
- Condition / age +2.5/5.0
- Appreciation +0.0/10.0
$219,900
🖨 Deal sheet (PDF) 📄 Offer letter ✓ Due diligence
Listing remarks MLS
Very updated. Newer kitchen, baths, carpet and paint. Nothing left but to move in. Cat walk entrance to Northgate Mall @ end of street.
Key facts
- Level yard
- Shed
- Front porch
Tags
Property features AI
Finance
- Other: Lease not considered
- HOA & community: No HOA
Exterior
- Utilities: Public water; Public sewer; Natural gas service
- Home design: Cape Cod style; One and one half levels; Poured foundation; Residential zoning; Property on a lot approx. 50 x 100 (about 0.115 acre)
- Construction: Brick construction; Shingle roof
- Exterior features: Patio; Porch; Insulated windows; Shed on property
Interior
- Kitchen: Eat-in kitchen; Kitchen has vinyl flooring; Kitchen walkout
- Bedrooms: 4 bedrooms total; Primary bedroom on level 1 (13 x 11); Bedroom 2 on level 1 (11 x 11); Bedroom 3 on level 2 (13 x 12); Bedroom 4 on level 2 (12 x 10)
- Flooring: Vinyl flooring in kitchen; Wall-to-wall carpet in living room
- Bathrooms: 1 full bathroom on level 1
- Heating & cooling: Forced air heating (gas); Central air conditioning; Gas water heater
- Interior features: Ceiling fan; Walkout basement; Unfinished full basement; Walkout living room; Wall-to-wall carpet in living room; Eat-in kitchen; Vinyl flooring in kitchen
- Laundry & utility: Washer and dryer included
Neighborhood map
What this means for you Summary
Snapshot
- This is a 4-bed/1.0-bath single-family listed at $220k.
Deal economics
- At list price, monthly cash flow is $80 ($956/yr) — positive.
- The deal already cash-flows at list — no discount required.
- To meet the 1% rule (rent ≥ 1% of price), the offer needs to be $199k (9.3% below list).
- Recommended offer: $199k (9.3% below list) — sets the bar for 1% rule.
Location & tenants
- Location reads 84/100 on livability (#55 in OH, #761 nationally) — a professional / high-income tenant draw. Strengths: commute A+, cost of living A+, housing A+; Watch: employment C-.
- Northwest Local (suburban): math 38% / reading 46% proficiency, ranked #508 of 656 in OH (top 77%) — families likely to look elsewhere, expect single-tenant / working-renter base with shorter leases.
- Zoned schools: Colerain Elementary School (math 52% / reading 57%, grade C, #788 of 1,584 statewide, top 52%, 586 students, 50% FRL); Colerain Middle School (math 33% / reading 43%, grade F, #532 of 654 statewide, top 81%, 580 students, 56% FRL); Colerain High School (math 26% / reading 50%, grade F, #560 of 781 statewide, top 72%, 1,747 students, 54% FRL).
- Market conditions: 55 active listings in the ZIP; 7 comparable units currently listed for rent nearby; rentals leasing fast (median 10d on market — plan ~1-2 weeks tenant-placement turnaround); 801 units permitted in Hamilton County in 2024 (190 in 5+ unit buildings).
- This rent runs 32% of the median local income ($75k/yr) — at the standard rent-burdened threshold; future hikes will face affordability resistance.
Forward outlook
- Local home prices are declining (-3.0%/yr); year-one equity from $2k of loan paydown is wiped out by about $7k of value loss. Plan a longer hold.
Negotiation context
- Only 6 days on market — expect competitive offers; lowballing is unlikely to land.
- 2 sale attempts since 20y ago with the ask held roughly flat each time — persistent listings suggest the price (not the market) is what's stuck; bring a comps-based counter.
- Current owner paid $122k; list at $220k implies a 80% gain — meaningful room to come down on a strong offer.
Questions for the listing agent
- Built in 1961 — when were the roof, HVAC, electrical panel, plumbing, and water heater last replaced?
- Is there a deadline driving the sale (1031 exchange, divorce, estate, relocation)? That informs how much negotiation room exists.
- The area grade is low — what's the realistic commute time and amenity access for the typical tenant pool here? Any planned neighborhood developments (good or bad) we should know about?
- What's the average days-on-market for RENTAL listings here right now (not sales)? A rising rental-DOM trend means longer vacancies and softer asking-rent achievability than the comps imply.
- What's the recent tenant-quality profile in this submarket — average credit score on applications, eviction rate, late-payment / NSF rate, and stable-employment percentage? A property-management company in the area should have these aggregated.
- How much new for-sale + rental construction is in the pipeline within 1–3 miles? Heavy new supply typically softens prices + rents 12–24 months out; constrained supply supports both.
Investment metrics
- 1% rule
- 0.91% ✗
- Cap rate
- 6.73%
- Cash-on-cash
- 1.55%
- DSCR
- 1.07
- GRM
- 9.2
CMA / ARV
No comps found within radius.
Projected returns pro-forma
-3.0% appreciation · 3.0% rent growth · sell at horizon
- IRR
- -13.8%
- Equity multiple
- 0.50×
- Total profit
- $-30,543
- Equity at exit
- $32,788
- IRR
- -5.0%
- Equity multiple
- 0.68×
- Total profit
- $-19,999
- Equity at exit
- $19,013
Cash invested: $61,572 (down + closing). Projections, not guarantees.
Landlord ↔ Tenant lean methodology
- Overall (STATE)
- 73 Landlord-Friendly
- State Ohio
- 73 Landlord-Friendly · R+6
- County
- — inherits STATE
- City
- — inherits STATE
ZIP-level market 45251
- Active inventory
- 55
- Price-to-rent
- 9.2×
Monthly cashflow live
- Estimated rent
- $1,994 high interval (Pro) →
- Mortgage (P&I)
- −$1,153
- Tax from tax record
- −$251 /mo · $3,008/yr
- Insurance
- −$92
- HOA
- −$0
- Vacancy / Maint / Mgmt
- −$419
- Net cashflow
- $80
Break-even live
Sensitivity live
| Price | -10% $204 | -5% $142 | +0% $80 | +5% $17 | +10% $-45 |
|---|---|---|---|---|---|
| Rent | -10% $-78 | -5% $1 | +0% $80 | +5% $158 | +10% $237 |
| Rate | -1.0pp $190 | -0.5pp $136 | base $80 | +0.5pp $23 | +1.0pp $-35 |
UW: 25.0% down · 7.5% · 30yr · 1.5% tax · 5.0% vac · 8.0% maint · 8.0% mgmt
Financing live
Cash to close
- Down payment
- $54,975
- Closing costs
- $6,597
- Reserves months
- —
- Total cash needed
- —
Loan-product check · same deal, 3 products live
Conventional
25% down · 7.5% · 30yr
- Down + closing
- —
- Monthly P&I
- —
- Monthly cashflow
- —
- DSCR
- —
- Eligible?
- —
Personal DTI + credit; lowest rate.
DSCR
20% down · 8.5% · 30yr
- Down + closing
- —
- Monthly P&I
- —
- Monthly cashflow
- —
- DSCR
- —
- Eligible?
- —
No personal income docs; deal must DSCR.
Hard money
10% down · 12.0% · 12mo
- Down + closing
- —
- Monthly P&I
- —
- Monthly cashflow
- —
- DSCR
- —
- Eligible?
- —
Short-term bridge; refi at stabilization.
Rent comps 7 comps
| Address | Beds | Baths | Sqft | Rent | $/sqft | DOM | Units | Dist |
|---|---|---|---|---|---|---|---|---|
| 3683 Ripplegrove Dr Cincinnati, OH | 3.0 | 1.5 | 1395 | $1,931 | $1.38 | 22d | 1 | 0.14mi |
| 3470 Sunbury Ln Cincinnati, OH | 3.0 | 2.5 | 1178 | $2,250 | $1.91 | 0d | 1 | 0.34mi |
| 9333 Round Top Cincinnati, OH | 1.0–3.0 | 1.0–2.0 | 979 | $1,623 | $1.66 | 0d | 6 | 0.38mi |
| 9939 Voyager Way Cincinnati, OH | 3.0 | 2.0 | 1400 | $2,300 | $1.64 | 45d | 1 | 0.95mi |
| 10101 Arborwood Dr Cincinnati, OH | 1.0–3.0 | 1.0–1.5 | 912 | $1,649 | $1.81 | 0d | 28 | 0.99mi |
| 10220 September Dr Cincinnati, OH | 4.0 | 1.0 | 1025 | $1,890 | $1.84 | 14d | 1 | 1.36mi |
| 9500 Ridgemoor Ave Cincinnati, OH | 3.0 | 1.0 | 1344 | $1,600 | $1.19 | 9d | 1 | 1.41mi |
Listing history 6 events
-
2026-06-21days on market $219,900 Active 6 DOM
-
2026-06-21days on market $219,900 Active 5 DOM
-
2026-06-18days on market $219,900 Active 3 DOM
-
2026-06-17days on market $219,900 Active 2 DOM
-
2026-06-16remarks 376-char remark
-
2026-06-16$219,900 Active 1 DOM
ⓘ Source: listings_history table (triggers on properties + properties_extension) + one-shot
backfill from property_details.listing_events for pre-trigger history.
Tax reassessment forecast OH · Partial reset (capped growth)
- Current annual tax
- $3,008 · $251/mo
- Projected year-2 tax
- $3,219 · $268/mo
- Expected delta
- +$211/yr (+$18/mo · 7.0%)
ⓘ Screening estimate from a state-policy table — verify with the county assessor before closing.
Climate risk First Street
- Flood 1/10 Low FEMA zone X (unshaded) · 0% chance over 30 yrs
- Wildfire 1/10 Low
- Heat 4/10 Moderate 7 d/yr ≥103°F today · 19 d/yr by 30 yrs out
- Wind 2/10 Low 100% chance of damaging wind over 30 yrs
- Air quality 2/10 Low 1 unhealthy d/yr today · 1 by 30 yrs out
Nearby sold comps map
Loading sold comps map…
Walkable amenities ~0.75 mi
Loading nearby amenities…
Taxation est. · year 1
- Rental income
- $23,927
- − Mortgage interest
- −$12,318
- − Property taxes
- −$3,008
- − Insurance
- −$1,100
- − Repairs & maintenance
- −$1,914
- − Management
- −$1,914
- − Depreciation
- −$6,397
- Taxable loss
- −$2,724
- Est. tax savings @ 24.0%
- +$654
- After-tax cash flow
- $1,610/yr
For passive investors: Depreciation is non-cash, so a rental often shows a tax loss while cash-flowing — sheltering income. Rental losses are passive: they offset passive income freely, and up to $25,000/yr can offset ordinary (W-2) income if you actively participate and your MAGI is under $100k (phasing out to $0 by $150k); unused losses carry forward. On sale, claimed depreciation is recaptured at up to 25%, and gains may owe capital-gains tax (a 1031 exchange can defer both). Figures are a year-1 estimate at your 24.0% rate — not tax advice; consult a CPA.
Schools (NCES district)
- District
- Northwest Local
- NCES district ID
- 3904736
- Math proficiency
- 38% ▼ -18.00%
- Reading proficiency
- 46% ▼ -10.00%
- Median HH income
- $58,765
- Composite
- 36.97/100
- National rank
- #4528
- State rank
- #508 of 656 in OH
Livability — Northgate
- Score
- 84/100
- State rank
- #55
- US rank
- #761
Category grades
Schools grade is shown separately in the Schools card above.
Census & demographics
- Census place
- Northgate, OH
- County
- Hamilton County · 701,295 people
- Metro
- Cincinnati, OH-KY-IN
- Population (ZIP)
- 20,254
- Household income
- $74,614
- Rent vs Own
- Severe rent burden
- 442.0
Population outlook (Hamilton County) Hauer SSP2
- Today (2025)
- 826,054 people
- By 2030
- 830,947 · +0.6%
- By 2040
- 832,319 · +0.8%
- By 2050
- 822,428 · -0.4%
- By 2075
- 788,688 · -4.5%
- By 2100
- 710,674 · -14.0%
Race, ethnicity, and origin ACS 2023
- Neighborhood character
- Diverse neighborhood (Simpson 0.57)
- Race & ethnicity
- White 56% Black 34% Two or more races 6% Hispanic / Latino 3% Asian 2%
- Common ancestry
- Iranian 1% Italian 1% Lithuanian 1%
- Foreign-born
- 4% · Canada, China
- Languages at home
- 94% English-only · Spanish 2% Other Asian/Pacific 1% Chinese 1%
Political lean MEDSL · Hamilton
- 2024 margin
- D (+14.9) · D 57.0% · R 42.1%
- 2008→2024 swing
- +7.9pp toward D · 2008: 7.0pp · 2024: 14.9pp
- All cycles
- 2024: D+14.9 2020: D+15.9 2016: D+9.5 2012: D+4.9 2008: D+7.0
Not yet ingested
- Civics
- —
Market trends
- HPI YoY
- ▼ -222.27%
- Current HPI
- 232.8505
- Rent YoY
- —
- Metro
- Cincinnati, OH-KY-IN
- State GDP YoY
- ▲ 1.98%
- F500 in state
- 48
Industry mix (Fortune 500 HQ in OH)
| Industry | F500 HQs | Revenue |
|---|---|---|
| Insurance | 3 | $145B |
|
||
| Industrial Machinery | 3 | $49B |
|
||
| Financial Services | 3 | $24B |
|
||
| Consumer Goods | 2 | $93B |
|
||
| Aerospace / Defense | 2 | $47B |
|
||
| Utilities | 2 | $33B |
|
||
Price history
+76.1% since first listed4 events — show timeline
- 2026-06-15 Listed $219,900 Cincy MLS
- 2006-06-26 Sold (Public Records) $122,500 Public Records
- 2006-06-05 Sold (MLS) $122,500 Cincy MLS
- 2006-04-11 Listed $124,900 Cincy MLS
Property tax history
+3.9%/yrLatest (2025): $3,008 · +7.9% YoY. Source: county tax records.
Cash-flow waterfall
monthlySold comps — $/sqft
last 12 mo · ≤1 miLoading sold comps…