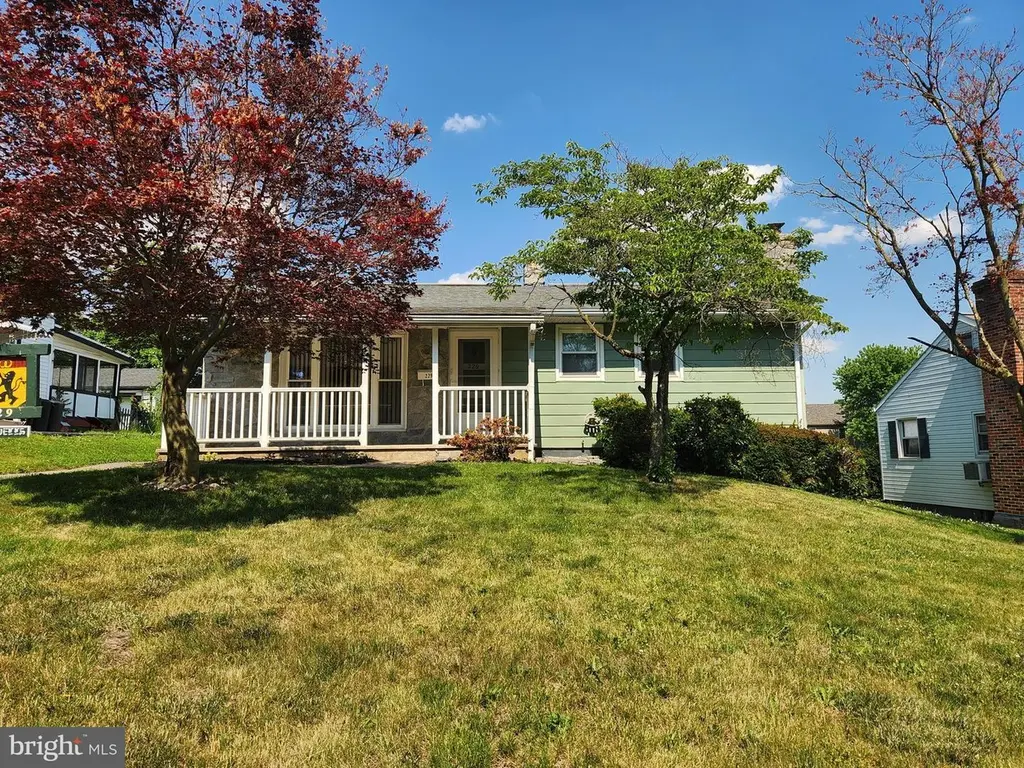
229 N Maple St · Elizabethtown, PA
Flood risk 1/10 · Minimal
- FEMA flood zone
- X (unshaded)
- Chance of flooding over 30 yrs
- 0.0%
- Est. flood insurance / yr
- $473 – $860
Fire risk 1/10 · Minimal
- Est. fire insurance / yr
- $511 – $949
Heat risk 5/10 · Moderate
- Hot days now (above 100°F)
- 7 days/yr
- Hot days in 30 yrs
- 15 days/yr
Wind risk 4/10 · Minor
- Chance of severe wind over 30 yrs
- 9.0%
Air-quality risk 4/10 · Minor
- Unhealthy air days now
- 3 days/yr
- Unhealthy air days in 30 yrs
- 6 days/yr
Risk factors via First Street. Map © Google.
Why this score? — see what drove the D+ grade
The composite is a weighted blend of 9 inputs, each scored 0–100. Each bar is that input's sub-score; the figure is the points it added to the 100-point composite (weight × sub-score).
- Cash flow +14.0/30.0
- ARV discount +7.5/15.0
- 1% rule +4.7/10.0
- Schools +4.7/10.0
- DSCR +4.2/10.0
- Rent growth +4.1/5.0
- Livability +4.0/5.0
- Condition / age +2.5/5.0
- Appreciation +0.0/10.0
$150,000
🖨 Deal sheet (PDF) 📄 Offer letter ✓ Due diligence
Listing remarks
This property will be offered at Public Auction on Wednesday, July 1, 2026 @ 6pm. The listing price is the opening bid only and in no way reflects the final sale price. 10% down due at auction, 2% transfer tax to be paid by the purchaser, real estate taxes prorated. This affordable home features a functional and inviting layout with comfortable living spaces throughout. The main level includes a cozy living room with attic access, an eat-in kitchen, a screened-in porch perfect for relaxing, and three bedrooms, one of which could easily serve as a home office or flex space. The lower level offers additional living and workspace potential with a spacious family room, laundry area, and a ded
Key facts
- 6,534 sq ft lot
- Garage
- Built 1955
Property features AI
Exterior
- Parking: Detached rear-entry garage (1 car); Driveway spaces for 2 vehicles; Total of 3 garage/parking spaces
- Utilities: Public water; Public sewer; Municipal trash service; 100 amp electric service
- Home design: Detached property
- Construction: Frame construction with metal siding; Composite/shingle roof; Block foundation; Garage structure
- Exterior features: Screened porch; Porch(es); Partially finished basement; Below-grade finished space
Interior
- Kitchen: Eat-in kitchen
- Bedrooms: Three bedrooms on the main level
- Flooring: Carpet; Vinyl
- Bathrooms: One full bathroom on the main level
- Heating & cooling: Heat pump heating; Heat pump cooling; Whole-house fan; Natural gas fuel for heating and cooling; Electric hot water
- Interior features: Tub/shower; Built-in shelving; Cedar closet(s); Ceiling fan(s); Eat-in kitchen
- Laundry & utility: Laundry in the basement; Basement workshop area
Neighborhood map
What this means for you Summary
Snapshot
- This is a 2-bed/1.0-bath single-family listed at $150k.
Deal economics
- At list price, monthly cash flow is $18 ($221/yr) — positive.
- The deal already cash-flows at list — no discount required.
- To meet the 1% rule (rent ≥ 1% of price), the offer needs to be $145k (3.0% below list).
- Recommended offer: $145k (3.0% below list) — sets the bar for 1% rule.
- Cap rate 6.4% vs local median 3.2% in Elizabethtown — top-decile yield for the area; either an underpriced asset or a hidden risk that comps aren't pricing in. Stress-test before assuming the spread holds.
Location & tenants
- Location reads 80/100 on livability (#201 in PA, #1,759 nationally) — a professional / high-income tenant draw. Strengths: crime A+, cost of living A+, housing A+; Watch: commute F.
- Elizabethtown Area SD (suburban): math 46% / reading 62% proficiency, ranked #123 of 539 in PA (top 23%) — acceptable for families but not a draw, mixed tenant base, ~2y average lease.
- Zoned schools: East High Street El Sch (math 57% / reading 67%, grade B, #313 of 1,518 statewide, top 24%, 481 students, 46% FRL); Elizabethtown Area Ms (math 24% / reading 52%, grade F, #283 of 512 statewide, top 57%, 875 students, 40% FRL); Elizabethtown Area Shs (math 67% / reading 24%, grade D-, #183 of 437 statewide, top 43%, 1,249 students, 29% FRL) — zoned schools average 38% FRL vs 22% district-wide (16 pts higher); higher-poverty schools than district average — tighter screening recommended.
- Market conditions: Rents rising fast (+6.5%/yr); 203 active listings in the ZIP; 1 comparable units currently listed for rent nearby; solid renter incomes; 1,093 units permitted in Lancaster County in 2024 (201 in 5+ unit buildings).
Forward outlook
- Local home prices are declining (-3.0%/yr); year-one equity from $1k of loan paydown is wiped out by about $4k of value loss. Plan a longer hold.
- Lancaster County population projected at +5% by 2050 — modest demand growth; plan on rents tracking national, not racing it.
Negotiation context
- It's been on market 23 days — a 2% lower offer ($148k) is reasonable based on typical stale-listing flexibility.
Risks & watch-outs
- Watch-outs: built in 1955 — expect roof / HVAC / electrical / plumbing capex.
- Climate carrying-cost: extreme-heat days projected 7→15/yr by 2055 (HVAC capex compounding) — expect insurance premiums to compound above CPI over the hold.
Questions for the listing agent
- Built in 1955 — when were the roof, HVAC, electrical panel, plumbing, and water heater last replaced?
- Is there a deadline driving the sale (1031 exchange, divorce, estate, relocation)? That informs how much negotiation room exists.
- Schools are A-rated — typically a magnet for longer-tenancy family renters. What's the average tenant stay here, and is there a school-zone premium baked into asking?
- The area grade is low — what's the realistic commute time and amenity access for the typical tenant pool here? Any planned neighborhood developments (good or bad) we should know about?
- What's the average days-on-market for RENTAL listings here right now (not sales)? A rising rental-DOM trend means longer vacancies and softer asking-rent achievability than the comps imply.
- What's the recent tenant-quality profile in this submarket — average credit score on applications, eviction rate, late-payment / NSF rate, and stable-employment percentage? A property-management company in the area should have these aggregated.
- How much new for-sale + rental construction is in the pipeline within 1–3 miles? Heavy new supply typically softens prices + rents 12–24 months out; constrained supply supports both.
Investment metrics
- 1% rule
- 0.97% ✗
- Cap rate
- 6.44%
- Cash-on-cash
- 0.53%
- DSCR
- 1.02
- GRM
- 8.6
CMA / ARV
- ARV (on-the-fly)
- $304,128
- Comps found
- 12
Show comp detail 12 sales within ~0.75 mi
| Address | Dist | Beds/Ba | Sqft | Sold | Price | $/sf | Match |
|---|---|---|---|---|---|---|---|
| 324 Highlawn Ave | 0.31mi | 2/1.0 | 1,050 (-1%) | 10mo | $324,900 | $309 | 77 |
| 28 Laurel Ave | 0.31mi | 2/1.0 | 960 (-9%) | 6mo | $249,900 | $260 | 65 |
| 146 W Hummelstown St | 0.16mi | 3/1.0 (+1) | 1,148 (+9%) | 11mo | $262,000 | $228 | 64 |
| 525 Highlawn Ave | 0.49mi | 3/1.0 (+1) | 1,040 (-2%) | 13mo | $300,000 | $288 | 59 |
| 120 N Locust St | 0.42mi | 3/2.0 (+1) | 1,140 (+8%) | 2mo | $295,000 | $259 | 57 |
| 403 N Locust St | 0.50mi | 3/1.0 (+1) | 1,092 (+3%) | 13mo | $325,000 | $298 | 55 |
| 535 N Locust St | 0.58mi | 3/1.0 (+1) | 950 (-10%) | 2mo | $290,000 | $305 | 49 |
| 343 N Locust St | 0.49mi | 3/1.0 (+1) | 1,008 (-4%) | 22mo | $317,500 | $315 | 46 |
| 605 N Mount Joy St | 0.67mi | 2/1.5 | 1,178 (+12%) | 3mo | $301,000 | $256 | 45 |
| 307 N Mount Joy St | 0.54mi | 3/1.0 (+1) | 1,120 (+6%) | 20mo | $255,000 | $228 | 43 |
| 15 Laurel Ave | 0.31mi | 3/2.0 (+1) | 1,163 (+10%) | 23mo | $353,000 | $304 | 40 |
| 406 S Market St | 0.65mi | 2/1.0 | 1,172 (+11%) | 17mo | $179,000 | $153 | 37 |
Match score weights: distance 35% · size 25% · config 20% · recency 20%. Top-matched comps best support the ARV.
Projected returns pro-forma
-3.0% appreciation · 6.52% rent growth · sell at horizon
- IRR
- -11.2%
- Equity multiple
- 0.58×
- Total profit
- $-17,717
- Equity at exit
- $22,365
- IRR
- 2.8%
- Equity multiple
- 1.24×
- Total profit
- $9,946
- Equity at exit
- $12,969
Cash invested: $42,000 (down + closing). Projections, not guarantees.
Landlord ↔ Tenant lean methodology
- Overall (STATE)
- 62 Landlord-Friendly
- State Pennsylvania
- 62 Landlord-Friendly · EVEN
- County
- — inherits STATE
- City
- — inherits STATE
ZIP-level market 17022
- Home prices YoY
- -29.0%
- Rents YoY
- 6.5%
- Active inventory
- 203
- Price-to-rent
- 8.6×
Monthly cashflow live
- Estimated rent
- $1,455 medium interval (Pro) →
- Mortgage (P&I)
- −$787
- Tax from tax record
- −$282 /mo · $3,382/yr
- Insurance
- −$62
- HOA
- −$0
- Lot rent
- −$0
- Vacancy / Maint / Mgmt
- −$306
- Net cashflow
- $18
Break-even live
Sensitivity live
| Price | -10% $103 | -5% $61 | +0% $18 | +5% $-24 | +10% $-66 |
|---|---|---|---|---|---|
| Rent | -10% $-96 | -5% $-39 | +0% $18 | +5% $76 | +10% $133 |
| Rate | -1.0pp $94 | -0.5pp $57 | base $18 | +0.5pp $-20 | +1.0pp $-60 |
UW: 25.0% down · 7.5% · 30yr · 1.5% tax · 5.0% vac · 8.0% maint · 8.0% mgmt
Financing live
Cash to close
- Down payment
- $37,500
- Closing costs
- $4,500
- Reserves months
- —
- Total cash needed
- —
Loan-product check · same deal, 3 products live
Conventional
25% down · 7.5% · 30yr
- Down + closing
- —
- Monthly P&I
- —
- Monthly cashflow
- —
- DSCR
- —
- Eligible?
- —
Personal DTI + credit; lowest rate.
DSCR
20% down · 8.5% · 30yr
- Down + closing
- —
- Monthly P&I
- —
- Monthly cashflow
- —
- DSCR
- —
- Eligible?
- —
No personal income docs; deal must DSCR.
Hard money
10% down · 12.0% · 12mo
- Down + closing
- —
- Monthly P&I
- —
- Monthly cashflow
- —
- DSCR
- —
- Eligible?
- —
Short-term bridge; refi at stabilization.
Rent comps 1 comps
| Address | Beds | Baths | Sqft | Rent | $/sqft | DOM | Units | Dist |
|---|---|---|---|---|---|---|---|---|
| 155 S Poplar St Elizabethtown, PA | 1.0 | 1.0 | 636 | $1,485 | $2.33 | 16d | 1 | 0.45mi |
Listing history 18 events
-
2026-06-22days on market $150,000 Active 23 DOM
-
2026-06-18days on market $150,000 Active 20 DOM
-
2026-06-17days on market $150,000 Active 19 DOM
-
2026-06-16days on market $150,000 Active 18 DOM
-
2026-06-15days on market $150,000 Active 17 DOM
-
2026-06-14days on market $150,000 Active 15 DOM
-
2026-06-13days on market $150,000 Active 14 DOM
-
2026-06-10days on market $150,000 Active 12 DOM
-
2026-06-09days on market $150,000 Active 11 DOM
-
2026-06-08days on market $150,000 Active 10 DOM
-
2026-06-07days on market $150,000 Active 9 DOM
-
2026-06-05days on market $150,000 Active 6 DOM
-
2026-06-03days on market $150,000 Active 5 DOM
-
2026-06-02days on market $150,000 Active 4 DOM
-
2026-06-01days on market $150,000 Active 3 DOM
-
2026-05-31days on market $150,000 Active 2 DOM
-
2026-05-30remarks 699-char remark
-
2026-05-30$150,000 Active 1 DOM
ⓘ Source: listings_history table (triggers on properties + properties_extension) + one-shot
backfill from property_details.listing_events for pre-trigger history.
Tax reassessment forecast PA · Partial reset (capped growth)
- Current annual tax
- $3,382 · $282/mo
- Projected year-2 tax
- $3,382 · $282/mo
- Expected delta
- $0/yr ($0/mo · 0.0%)
ⓘ Screening estimate from a state-policy table — verify with the county assessor before closing.
Climate risk First Street
- Flood 1/10 Low FEMA zone X (unshaded) · 0% chance over 30 yrs
- Wildfire 1/10 Low
- Heat 5/10 Major 7 d/yr ≥100°F today · 15 d/yr by 30 yrs out
- Wind 4/10 Moderate 9% chance of damaging wind over 30 yrs
- Air quality 4/10 Moderate 3 unhealthy d/yr today · 6 by 30 yrs out
Nearby sold comps map
Loading sold comps map…
Walkable amenities ~0.75 mi
Loading nearby amenities…
Taxation est. · year 1
- Rental income
- $17,459
- − Mortgage interest
- −$8,402
- − Property taxes
- −$3,382
- − Insurance
- −$750
- − Repairs & maintenance
- −$1,397
- − Management
- −$1,397
- − Depreciation
- −$4,364
- Taxable loss
- −$2,232
- Est. tax savings @ 24.0%
- +$536
- After-tax cash flow
- $757/yr
For passive investors: Depreciation is non-cash, so a rental often shows a tax loss while cash-flowing — sheltering income. Rental losses are passive: they offset passive income freely, and up to $25,000/yr can offset ordinary (W-2) income if you actively participate and your MAGI is under $100k (phasing out to $0 by $150k); unused losses carry forward. On sale, claimed depreciation is recaptured at up to 25%, and gains may owe capital-gains tax (a 1031 exchange can defer both). Figures are a year-1 estimate at your 24.0% rate — not tax advice; consult a CPA.
Schools (NCES district)
- District
- Elizabethtown Area SD
- NCES district ID
- 4209120
- Math proficiency
- 46% ▼ -10.00%
- Reading proficiency
- 62% ▼ -8.00%
- Median HH income
- $59,380
- Composite
- 46.94/100
- National rank
- #2361
- State rank
- #123 of 539 in PA
Livability — Elizabethtown
- Score
- 80/100
- State rank
- #201
- US rank
- #1759
Category grades
Schools grade is shown separately in the Schools card above.
Census & demographics
- Census place
- Elizabethtown, PA
- County
- Lancaster County · 390,309 people
- City population
- 31,908
- Metro
- Lancaster, PA
- Population (ZIP)
- 31,908
- Household income
- $86,767
- Rent vs Own
- Severe rent burden
- 1404.0
Population outlook (Lancaster County) Hauer SSP2
- Today (2025)
- 561,011 people
- By 2030
- 570,969 · +1.8%
- By 2040
- 585,929 · +4.4%
- By 2050
- 591,056 · +5.4%
- By 2075
- 594,747 · +6.0%
- By 2100
- 558,850 · -0.4%
Race, ethnicity, and origin ACS 2023
- Neighborhood character
- Predominantly White (89%)
- Race & ethnicity
- White 89% Hispanic / Latino 6% Two or more races 4% Black 1% Asian 1%
- Hispanic origin (detail)
- Mexican 1% Puerto Rican 2%
- Common ancestry
- Romanian 4% Lithuanian 2% Slovak 2%
- Foreign-born
- 3% · Canada
- Languages at home
- 96% English-only · Spanish 2% Other Asian/Pacific 1%
Political lean MEDSL · Lancaster
- 2024 margin
- R (+15.9) · D 41.5% · R 57.5%
- 2008→2024 swing
- -4.1pp toward R · 2008: -11.8pp · 2024: -15.9pp
- All cycles
- 2024: R+15.9 2020: R+15.8 2016: R+19.7 2012: R+19.2 2008: R+11.8
Not yet ingested
- Civics
- —
Market trends
- HPI YoY
- ▼ -108.73%
- Current HPI
- 266.3184
- Rent YoY
- ▲ 6.52%
- Metro
- Lancaster, PA
- State GDP YoY
- ▲ 1.68%
- F500 in state
- 34
Industry mix (Fortune 500 HQ in PA)
| Industry | F500 HQs | Revenue |
|---|---|---|
| Healthcare | 2 | $309B |
|
||
| Insurance | 2 | $27B |
|
||
| Telecommunications / Media | 1 | $124B |
|
||
| Industrial Distribution | 1 | $22B |
|
||
| Financial Services | 1 | $20B |
|
||
| Chemicals / Materials | 1 | $18B |
|
||
Price history
1 event — show timeline
- 2026-05-29 Listed $150,000 BRIGHT MLS
Property tax history
+2.2%/yrLatest (2026): $3,382 · +3.7% YoY. Source: county tax records.
Cash-flow waterfall
monthlySold comps — $/sqft
last 12 mo · ≤1 miLoading sold comps…