10785 S County Road 200 W · Paris Crossing, IN
Flood risk 1/10 · Minimal
- FEMA flood zone
- X (unshaded)
- Chance of flooding over 30 yrs
- 0.0%
- Est. flood insurance / yr
- $473 – $860
Fire risk 1/10 · Minimal
- Est. fire insurance / yr
- $717 – $1,331
Heat risk 4/10 · Minor
- Hot days now (above 104°F)
- 7 days/yr
- Hot days in 30 yrs
- 19 days/yr
Wind risk 2/10 · Minimal
- Chance of severe wind over 30 yrs
- 1.0%
Air-quality risk 2/10 · Minimal
- Unhealthy air days now
- 0 days/yr
- Unhealthy air days in 30 yrs
- 1 days/yr
Risk factors via First Street. Map © Google.
Why this score? — see what drove the C- grade
The composite is a weighted blend of 9 inputs, each scored 0–100. Each bar is that input's sub-score; the figure is the points it added to the 100-point composite (weight × sub-score).
- ARV discount +15.0/15.0
- Cash flow +11.4/30.0
- Appreciation +8.0/10.0
- 1% rule +3.3/10.0
- DSCR +3.3/10.0
- Schools +3.0/10.0
- Rent growth +2.5/5.0
- Livability +2.5/5.0
- Condition / age +2.5/5.0
$119,900
🖨 Deal sheet 📄 Offer letter ✓ Due diligence
Listing remarks MLS
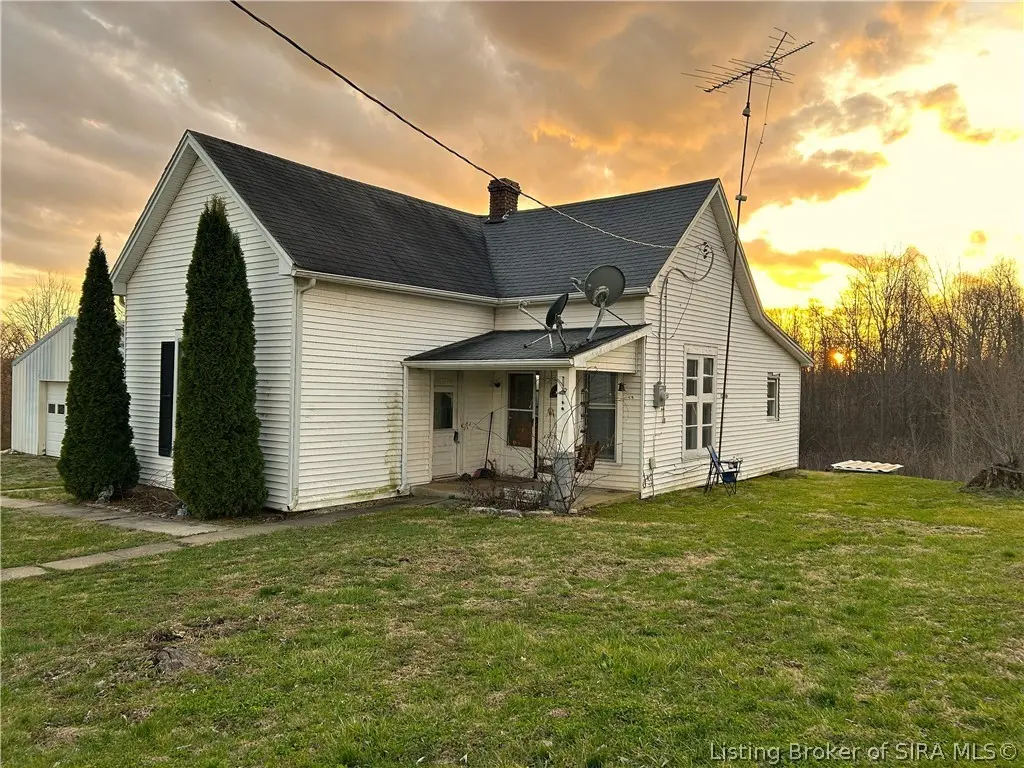
Charming country homes with a cozy feel, featuring scenic sunrises and sunsets in a rural small town setting. This home sets off the road with a circular driveway and is elevated on a small knoll, with a wooded view from the quaint eat-in kitchen. Other features include a covered front porch for that porch swing you have always wanted, a small rear deck and a 2 car detached garage with electricity and a concrete floor. New heat pump heating & cooling system and a 50 gallon water heater approximately 15 months ago. New ceiling panels onsite to convey to new owners. Various interior doors will also convey to the new owners. This home has so much potential and with some needed TLC, you could make this home fit your personal needs and style. Previous vegetable garden spot that was very productive in the past. Well is water source. There is a cistern onsite has not been used. Neighbor has Stucker Fork public water. Ice maker and water dispenser on refrigerator are not hooked up. Metal storage container on south side of lot does not convey. Inspections are welcome but home is being sold As Is.
Key facts
- Covered front porch
- Well is water source
- Small rear deck
Tags
Neighborhood map
What this means for you Summary
Snapshot
- This is a 2-bed/1.0-bath single-family listed at $120k.
Deal economics
- At list price, monthly cash flow is $-43 ($-513/yr) — negative.
- To cash-flow at today's rent, offer at most $114k (5.2% below list).
- To meet the 1% rule (rent ≥ 1% of price), the offer needs to be $99k (17.0% below list).
- Recommended offer: $99k (17.0% below list) — sets the bar for 1% rule.
Location & tenants
- Location reads: area grade C — affects rentability + tenant quality, not the cash-flow math above.
- Jennings County School Corporation (rural): math 32% / reading 38% proficiency, ranked #194 of 301 in IN (top 64%) — families likely to look elsewhere, expect single-tenant / working-renter base with shorter leases.
- Market conditions: 3 active listings in the ZIP; 84 units permitted in Jennings County in 2024 (0 in 5+ unit buildings).
Forward outlook
- In year one you build about $8k of equity ($829 loan paydown + $7k appreciation (6.0% local appreciation)).
- Jennings County population projected at -21% by 2050 — secular population decline; favor cash flow + early exit over multi-decade hold.
- At projected returns (6.0% appreciation + 3.0% rent growth), your $34k cash investment doubles in ~4 years — after that, you're playing with house money.
- By year 5, paydown + projected appreciation supports a ~$35k cash-out refi (75% LTV) — recoverable capital for the next deal without selling this one.
Negotiation context
- It's been on market 104 days — a 9% lower offer ($109k) is reasonable based on typical stale-listing flexibility.
- Current owner paid $48k; list at $120k implies a 152% gain — meaningful room to come down on a strong offer.
Risks & watch-outs
- Watch-outs: built in 1908 — expect roof / HVAC / electrical / plumbing capex.
Questions for the listing agent
- What do current leases actually rent for vs. the listed asking? Can we see a recent rent roll and the last 12 months of T-12 income?
- It's been on market 104 days. Have you received any prior offers? Is the seller open to a 17% concession, seller financing, or rate buy-down credit?
- Built in 1908 — when were the roof, HVAC, electrical panel, plumbing, and water heater last replaced?
- Why hasn't it sold? Are there any deal-killer items the seller is aware of (foundation, flood, title, zoning, code violations)?
- Is there a deadline driving the sale (1031 exchange, divorce, estate, relocation)? That informs how much negotiation room exists.
- What's the average days-on-market for RENTAL listings here right now (not sales)? A rising rental-DOM trend means longer vacancies and softer asking-rent achievability than the comps imply.
- What's the recent tenant-quality profile in this submarket — average credit score on applications, eviction rate, late-payment / NSF rate, and stable-employment percentage? A property-management company in the area should have these aggregated.
- How much new for-sale + rental construction is in the pipeline within 1–3 miles? Heavy new supply typically softens prices + rents 12–24 months out; constrained supply supports both.
Investment metrics
- 1% rule
- 0.83% ✗
- Cap rate
- 5.87%
- Cash-on-cash
- -1.53%
- DSCR
- 0.93
- GRM
- 10.0
CMA / ARV
- ARV (median comp)
- $144,586
- List price
- $119,900
- Delta
- -17.07%
- Verdict
- UNDERPRICED
- Comps
- 6 within 1.0 mi
Projected returns pro-forma
6.04% appreciation · 3.0% rent growth · sell at horizon
- IRR
- 14.2%
- Equity multiple
- 1.96×
- Total profit
- $32,194
- Equity at exit
- $75,676
- IRR
- 14.6%
- Equity multiple
- 3.88×
- Total profit
- $96,780
- Equity at exit
- $137,496
Cash invested: $33,572 (down + closing). Projections, not guarantees.
Landlord ↔ Tenant lean methodology
- Overall (STATE)
- 90 Strongly Landlord-Friendly
- State Indiana
- 90 Strongly Landlord-Friendly · R+11
- County
- — inherits STATE
- City
- — inherits STATE
ZIP-level market 47270
- Home prices YoY
- 2.4%
- Active inventory
- 3
- Price-to-rent
- 10.0×
Monthly cashflow live
- Estimated rent
- $995 medium interval (Pro) →
- Mortgage (P&I)
- −$629
- Tax est. 1.5%
- −$150 /mo · $1,798/yr
- Insurance
- −$50
- HOA
- −$0
- Vacancy / Maint / Mgmt
- −$209
- Net cashflow
- $-43
Break-even live
UW: 25.0% down · 7.5% · 30yr · 1.5% tax · 5.0% vac · 8.0% maint · 8.0% mgmt
Financing live
Cash to close
- Down payment
- $29,975
- Closing costs
- $3,597
- Reserves months
- —
- Total cash needed
- —
Loan-product check · same deal, 3 products live
Conventional
25% down · 7.5% · 30yr
- Down + closing
- —
- Monthly P&I
- —
- Monthly cashflow
- —
- DSCR
- —
- Eligible?
- —
Personal DTI + credit; lowest rate.
DSCR
20% down · 8.5% · 30yr
- Down + closing
- —
- Monthly P&I
- —
- Monthly cashflow
- —
- DSCR
- —
- Eligible?
- —
No personal income docs; deal must DSCR.
Hard money
10% down · 12.0% · 12mo
- Down + closing
- —
- Monthly P&I
- —
- Monthly cashflow
- —
- DSCR
- —
- Eligible?
- —
Short-term bridge; refi at stabilization.
Listing history 16 events
-
2026-06-19days on market $119,900 Active 104 DOM
-
2026-06-18days on market $119,900 Active 103 DOM
-
2026-06-17days on market $119,900 Active 102 DOM
-
2026-06-16days on market $119,900 Active 101 DOM
-
2026-06-15days on market $119,900 Active 100 DOM
-
2026-06-14days on market $119,900 Active 98 DOM
-
2026-06-12days on market $119,900 Active 97 DOM
-
2026-06-09days on market $119,900 Active 94 DOM
-
2026-06-08days on market $119,900 Active 93 DOM
-
2026-06-07days on market $119,900 Active 92 DOM
-
2026-06-02days on market $119,900 Active 87 DOM
-
2026-06-01days on market $119,900 Active 86 DOM
-
2026-05-31days on market $119,900 Active 85 DOM
-
2026-05-30days on market $119,900 Active 84 DOM
-
2026-03-07$119,900 Active 1110-char remark
Show marketing remark (1110 chars)
Charming country homes with a cozy feel, featuring scenic sunrises and sunsets in a rural small town setting. This home sets off the road with a circular driveway and is elevated on a small knoll, with a wooded view from the quaint eat-in kitchen. Other features include a covered front porch for that porch swing you have always wanted, a small rear deck and a 2 car detached garage with electricity and a concrete floor. New heat pump heating & cooling system and a 50 gallon water heater approximately 15 months ago. New ceiling panels onsite to convey to new owners. Various interior doors will also convey to the new owners. This home has so much potential and with some needed TLC, you could make this home fit your personal needs and style. Previous vegetable garden spot that was very productive in the past. Well is water source. There is a cistern onsite has not been used. Neighbor has Stucker Fork public water. Ice maker and water dispenser on refrigerator are not hooked up. Metal storage container on south side of lot does not convey. Inspections are welcome but home is being sold As Is.
-
2010-11-05soldstatus $47,500
ⓘ Source: listings_history table (triggers on properties + properties_extension) + one-shot
backfill from property_details.listing_events for pre-trigger history.
Climate risk First Street
- Flood 1/10 Low FEMA zone X (unshaded) · 0% chance over 30 yrs
- Wildfire 1/10 Low
- Heat 4/10 Moderate 7 d/yr ≥104°F today · 19 d/yr by 30 yrs out
- Wind 2/10 Low 100% chance of damaging wind over 30 yrs
- Air quality 2/10 Low 0 unhealthy d/yr today · 1 by 30 yrs out
Nearby sold comps map
Loading sold comps map…
Walkable amenities ~0.75 mi
Loading nearby amenities…
Taxation est. · year 1
- Rental income
- $11,937
- − Mortgage interest
- −$6,716
- − Property taxes
- −$1,798
- − Insurance
- −$600
- − Repairs & maintenance
- −$955
- − Management
- −$955
- − Depreciation
- −$3,488
- Taxable loss
- −$2,575
- Est. tax savings @ 24.0%
- +$618
- After-tax cash flow
- $105/yr
For passive investors: Depreciation is non-cash, so a rental often shows a tax loss while cash-flowing — sheltering income. Rental losses are passive: they offset passive income freely, and up to $25,000/yr can offset ordinary (W-2) income if you actively participate and your MAGI is under $100k (phasing out to $0 by $150k); unused losses carry forward. On sale, claimed depreciation is recaptured at up to 25%, and gains may owe capital-gains tax (a 1031 exchange can defer both). Figures are a year-1 estimate at your 24.0% rate — not tax advice; consult a CPA.
Schools (NCES district)
- District
- Jennings County School Corporation
- NCES district ID
- 1805190
- Math proficiency
- 32% ▼ -11.00%
- Reading proficiency
- 38% ▼ -6.00%
- Median HH income
- $45,418
- Composite
- 29.89/100
- National rank
- #6394
- State rank
- #194 of 301 in IN
Livability — Paris Crossing
No livability data for this city. (Only ~50 U.S. cities are tracked.)
Census & demographics
- Census place
- Paris Crossing, IN
- Population (ZIP)
- 543
Population outlook (Jennings County) Hauer SSP2
- Today (2025)
- 26,584 people
- By 2030
- 25,591 · -3.7%
- By 2040
- 23,423 · -11.9%
- By 2050
- 20,973 · -21.1%
- By 2075
- 15,445 · -41.9%
- By 2100
- 10,714 · -59.7%
Race, ethnicity, and origin ACS 2023
- Neighborhood character
- Predominantly White (100%)
- Race & ethnicity
- White 100%
- Common ancestry
- Slovak 7% Iranian 2% Serbian 1%
- Languages at home
- 98% English-only · Spanish 2%
Political lean MEDSL · Jennings
- 2024 margin
- Solid R (+58.8) · D 19.7% · R 78.5% · Other 1.8%
- 2008→2024 swing
- -50.8pp toward R · 2008: -8.0pp · 2024: -58.8pp
- All cycles
- 2024: R+58.8 2020: R+56.9 2016: R+52.7 2012: R+22.4 2008: R+8.0
Not yet ingested
- Civics
- —
Market trends
- HPI YoY
- ▲ 6.04%
- Current HPI
- 256.2066
- Rent YoY
- —
- Metro
- —
- State GDP YoY
- ▲ 2.90%
- F500 in state
- 18
Industry mix (Fortune 500 HQ in IN)
| Industry | F500 HQs | Revenue |
|---|---|---|
| Industrial Machinery | 2 | $37B |
|
||
| Healthcare | 1 | $177B |
|
||
| Pharmaceuticals | 1 | $45B |
|
||
| Metals / Steel | 1 | $18B |
|
||
| Agriculture | 1 | $17B |
|
||
| Packaging | 1 | $12B |
|
||
Price history
+152.4% since first listed2 events — show timeline
- 2026-03-07 Listed $119,900 SIRA
- 2010-11-05 Sold (Public Records) $47,500 Public Records
Property tax history
-29.0%/yrLatest (2024): $25 · -81.3% YoY. Source: county tax records.
Cash-flow waterfall
monthlySold comps — $/sqft
last 12 mo · ≤1 miLoading sold comps…