13365 Old Rt 31 E · Savannah, NY
Flood risk 1/10 · Minimal
- FEMA flood zone
- X
- Chance of flooding over 30 yrs
- 0.0%
- Est. flood insurance / yr
- $507 – $1,088
Fire risk 4/10 · Minor
- Est. fire insurance / yr
- $691 – $1,283
Heat risk 2/10 · Minimal
- Hot days now (above 96°F)
- 7 days/yr
- Hot days in 30 yrs
- 15 days/yr
Wind risk 1/10 · Minimal
- Chance of severe wind over 30 yrs
- 0.0%
Air-quality risk 2/10 · Minimal
- Unhealthy air days now
- 1 days/yr
- Unhealthy air days in 30 yrs
- 1 days/yr
Risk factors via First Street. Map © Google.
Why this score? — see what drove the B grade
The composite is a weighted blend of 9 inputs, each scored 0–100. Each bar is that input's sub-score; the figure is the points it added to the 100-point composite (weight × sub-score).
- Cash flow +30.0/30.0
- 1% rule +10.0/10.0
- DSCR +10.0/10.0
- Appreciation +8.2/10.0
- ARV discount +7.5/15.0
- Livability +2.8/5.0
- Rent growth +2.5/5.0
- Schools +2.1/10.0
- Condition / age +1.0/5.0
$49,900
🖨 Deal sheet (PDF) 📄 Offer letter ✓ Due diligence
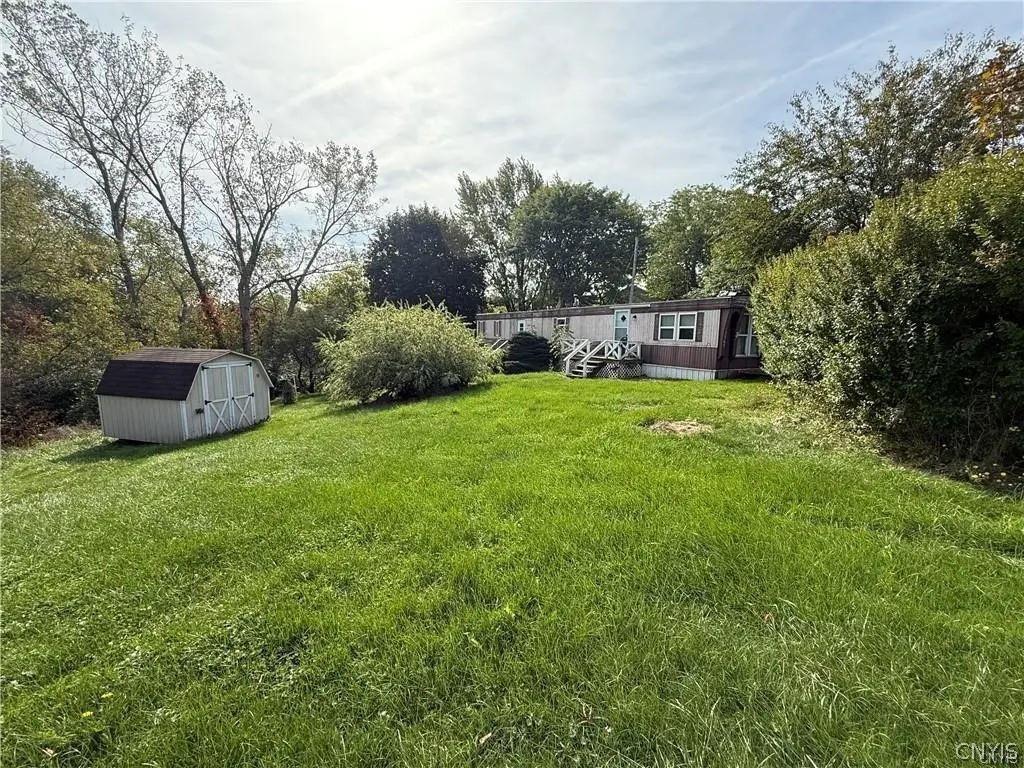
Listing remarks
Affordable opportunity for country living! This single-wide home offers the chance to make it your own with some TLC, or remove it and start fresh with a new build. Set on a rural lot, the property provides peaceful surroundings and the flexibility to either renovate the existing home or use the site for your dream build. Great option for those seeking a project, investment, or simply a quiet location away from the hustle and bustle.
Key facts
- 0.59 acre lot
- Parking
- Built 1984
Neighborhood map
What this means for you Summary
Snapshot
- This is a 3-bed/1.0-bath single-family listed at $50k. Condition is rated poor.
Deal economics
- At list price, monthly cash flow is $537 ($6k/yr) — positive.
- The deal already cash-flows at list — no discount required.
- Meets the 1% rule at list price ($1k rent vs $50k).
- Recommended offer: $49k (1.5% below list) — sets the bar for market timing.
Location & tenants
- Location reads 56/100 on livability (#1,104 in NY) — a working-class tenant base; expect higher turnover. Strengths: cost of living A+, housing A+; Watch: employment D+, crime F, amenities F.
- Clyde-Savannah Central School District (rural): math 18% / reading 30% proficiency, ranked #587 of 590 in NY (top 100%) — low school quality limits family demand, transient renter base, plan for 1-2y turnover.
- Zoned schools: Clyde-Savannah Elementary School (math 12% / reading 22%, grade F, #2,011 of 2,108 statewide, top 96%, 428 students, 55% FRL); Clyde-Savannah Junior High School (math 2% / reading 22%, grade F, #715 of 729 statewide, top 98%, 188 students, 55% FRL); Clyde-Savannah High School (math 84% / reading 74%, grade A-, #518 of 1,100 statewide, top 51%, 155 students, 46% FRL).
- Zoned-school proficiency averages 36% at this address vs 24% district-wide (+12 pts) — the actual schools serving this property are materially stronger than the Clyde-Savannah Central School District average implies; a family-tenant draw the district grade alone would hide.
- Market conditions: 5 active listings in the ZIP; 259 units permitted in Wayne County in 2024 (90 in 5+ unit buildings).
Forward outlook
- In year one you build about $4k of equity ($345 loan paydown + $3k appreciation (6.3% local appreciation)).
- Wayne County population projected at -24% by 2050 — secular population decline; favor cash flow + early exit over multi-decade hold.
- At projected returns (6.3% appreciation + 3.0% rent growth), your $14k cash investment doubles in ~2 years — after that, you're playing with house money.
- By year 9, paydown + projected appreciation supports a ~$32k cash-out refi (75% LTV) — recoverable capital for the next deal without selling this one.
Negotiation context
- It's been on market 28 days — a 2% lower offer ($49k) is reasonable based on typical stale-listing flexibility.
- 2 sale attempts with the ask held roughly flat each time — persistent listings suggest the price (not the market) is what's stuck; bring a comps-based counter.
Questions for the listing agent
- Have any recent inspections been done? Can we get a copy of the seller's disclosures and any deferred-maintenance estimates?
- Is there a deadline driving the sale (1031 exchange, divorce, estate, relocation)? That informs how much negotiation room exists.
- Schools are F-rated, which usually means shorter tenancies and higher turnover. Who's the typical renter profile here, and what's been the actual vacancy rate?
- Crime grade is F in this area — have there been break-ins, vandalism, or insurance claims at this property in the last 3 years? What carrier currently insures it and at what premium?
- What's the average days-on-market for RENTAL listings here right now (not sales)? A rising rental-DOM trend means longer vacancies and softer asking-rent achievability than the comps imply.
- What's the recent tenant-quality profile in this submarket — average credit score on applications, eviction rate, late-payment / NSF rate, and stable-employment percentage? A property-management company in the area should have these aggregated.
- How much new for-sale + rental construction is in the pipeline within 1–3 miles? Heavy new supply typically softens prices + rents 12–24 months out; constrained supply supports both.
Investment metrics
- 1% rule
- 2.24% ✓
- Cap rate
- 19.20%
- Cash-on-cash
- 46.08%
- DSCR
- 3.05
- GRM
- 3.7
CMA / ARV
No comps found within radius.
Projected returns pro-forma
6.35% appreciation · 3.0% rent growth · sell at horizon
- IRR
- 55.7%
- Equity multiple
- 4.55×
- Total profit
- $49,634
- Equity at exit
- $32,470
- IRR
- 52.2%
- Equity multiple
- 9.52×
- Total profit
- $119,017
- Equity at exit
- $59,857
Cash invested: $13,972 (down + closing). Projections, not guarantees.
Landlord ↔ Tenant lean methodology
- Overall (STATE)
- 15 Strongly Tenant-Friendly
- State New York
- 15 Strongly Tenant-Friendly · D+10
- County
- — inherits STATE
- City
- — inherits STATE
ZIP-level market 13146
- Home prices YoY
- 2.6%
- Active inventory
- 5
- Price-to-rent
- 3.7×
Monthly cashflow live
- Estimated rent
- $1,116 medium interval (Pro) →
- Mortgage (P&I)
- −$262
- Tax est. 1.5%
- −$62 /mo · $748/yr
- Insurance
- −$21
- HOA
- −$0
- Vacancy / Maint / Mgmt
- −$234
- Net cashflow
- $537
Break-even live
Sensitivity live
| Price | -10% $571 | -5% $554 | +0% $537 | +5% $519 | +10% $502 |
|---|---|---|---|---|---|
| Rent | -10% $448 | -5% $493 | +0% $537 | +5% $581 | +10% $625 |
| Rate | -1.0pp $562 | -0.5pp $549 | base $537 | +0.5pp $524 | +1.0pp $510 |
UW: 25.0% down · 7.5% · 30yr · 1.5% tax · 5.0% vac · 8.0% maint · 8.0% mgmt
Financing live
Cash to close
- Down payment
- $12,475
- Closing costs
- $1,497
- Reserves months
- —
- Total cash needed
- —
Loan-product check · same deal, 3 products live
Conventional
25% down · 7.5% · 30yr
- Down + closing
- —
- Monthly P&I
- —
- Monthly cashflow
- —
- DSCR
- —
- Eligible?
- —
Personal DTI + credit; lowest rate.
DSCR
20% down · 8.5% · 30yr
- Down + closing
- —
- Monthly P&I
- —
- Monthly cashflow
- —
- DSCR
- —
- Eligible?
- —
No personal income docs; deal must DSCR.
Hard money
10% down · 12.0% · 12mo
- Down + closing
- —
- Monthly P&I
- —
- Monthly cashflow
- —
- DSCR
- —
- Eligible?
- —
Short-term bridge; refi at stabilization.
Listing history 4 events
-
2026-04-24status Pending
-
2026-03-20$49,900 Active
-
2025-12-31historical
-
2025-09-25$69,000 Active
ⓘ Source: listings_history table (triggers on properties + properties_extension) + one-shot
backfill from property_details.listing_events for pre-trigger history.
Climate risk First Street
- Flood 1/10 Low FEMA zone X · 0% chance over 30 yrs
- Wildfire 4/10 Moderate
- Heat 2/10 Low 7 d/yr ≥96°F today · 15 d/yr by 30 yrs out
- Wind 1/10 Low 0% chance of damaging wind over 30 yrs
- Air quality 2/10 Low 1 unhealthy d/yr today · 1 by 30 yrs out
Nearby sold comps map
Loading sold comps map…
Walkable amenities ~0.75 mi
Loading nearby amenities…
Taxation est. · year 1
- Rental income
- $13,389
- − Mortgage interest
- −$2,795
- − Property taxes
- −$748
- − Insurance
- −$250
- − Repairs & maintenance
- −$1,071
- − Management
- −$1,071
- − Depreciation
- −$1,452
- Taxable income
- $6,002
- Est. tax owed @ 24.0%
- −$1,440
- After-tax cash flow
- $4,999/yr
For passive investors: Depreciation is non-cash, so a rental often shows a tax loss while cash-flowing — sheltering income. Rental losses are passive: they offset passive income freely, and up to $25,000/yr can offset ordinary (W-2) income if you actively participate and your MAGI is under $100k (phasing out to $0 by $150k); unused losses carry forward. On sale, claimed depreciation is recaptured at up to 25%, and gains may owe capital-gains tax (a 1031 exchange can defer both). Figures are a year-1 estimate at your 24.0% rate — not tax advice; consult a CPA.
Condition & rehab AI · 1 photo
This single-wide mobile home requires extensive repairs and landscaping to prepare it for sale or rental. Significant overgrowth and wear suggest a substantial investment is needed.
Repairs flagged
- Major vegetation removal — Significant overgrowth requires extensive removal
- Major landscaping — Overgrown vegetation and unkempt lawn need attention
- Major paint — The exterior suggests a need for fresh paint
Value-add opportunities
- Both landscaping and vegetation removal — Enhances curb appeal and prepares the property for sale
- Both painting — Improves the home's appearance and can increase both resale and rental value
Renovation cost estimate screening
| Repair item | Severity | Est. cost |
|---|---|---|
| vegetation removal · Significant overgrowth requires extensive removal | Major | $15,000–50,000 |
| landscaping · Overgrown vegetation and unkempt lawn need attention | Major | $15,000–50,000 |
| paint · The exterior suggests a need for fresh paint | Major | $15,000–50,000 |
| Total estimated repair cost · 3 items | $45,000–150,000 |
Value-add ROI direction
- Both landscaping and vegetation removal — Enhances curb appeal and prepares the property for sale ↑
- Both painting — Improves the home's appearance and can increase both resale and rental value ↑
ⓘ Cost ranges are severity-bucket heuristics (US national rule-of-thumb). Get contractor quotes + a written scope before underwriting a rehab budget.
Schools (NCES district)
- District
- Clyde-Savannah Central School District
- NCES district ID
- 3607860
- Math proficiency
- 18% ▼ -17.00%
- Reading proficiency
- 30% ▼ -2.00%
- Median HH income
- $46,907
- Composite
- 20.89/100
- National rank
- #8490
- State rank
- #587 of 590 in NY
Livability — Savannah
- Score
- 56/100
- State rank
- #1104
- US rank
- #22566
Category grades
Schools grade is shown separately in the Schools card above.
Census & demographics
- Census place
- Savannah, NY
- Population (ZIP)
- 2,050
Population outlook (Wayne County) Hauer SSP2
- Today (2025)
- 85,662 people
- By 2030
- 81,945 · -4.3%
- By 2040
- 73,735 · -13.9%
- By 2050
- 65,029 · -24.1%
- By 2075
- 47,451 · -44.6%
- By 2100
- 31,574 · -63.1%
Race, ethnicity, and origin ACS 2023
- Neighborhood character
- Predominantly White (94%)
- Race & ethnicity
- White 94% Two or more races 4% Hispanic / Latino 2%
- Common ancestry
- Iranian 6% Lithuanian 3% Romanian 2%
- Foreign-born
- 1% · Canada
- Languages at home
- 91% English-only · German/W. Germanic 8% Spanish 1%
Political lean MEDSL · Wayne
- 2024 margin
- Strong R (+23.1) · D 38.5% · R 61.5%
- 2008→2024 swing
- -13.2pp toward R · 2008: -9.9pp · 2024: -23.1pp
- All cycles
- 2024: R+23.1 2020: R+19.6 2016: R+26.1 2012: R+9.3 2008: R+9.9
Not yet ingested
- Civics
- —
Market trends
- HPI YoY
- ▲ 6.35%
- Current HPI
- 246.1013
- Rent YoY
- —
- Metro
- —
- State GDP YoY
- ▲ 2.60%
- F500 in state
- 92
Industry mix (Fortune 500 HQ in NY)
| Industry | F500 HQs | Revenue |
|---|---|---|
| Financial Services | 10 | $950B |
|
||
| Consumer Goods | 9 | $162B |
|
||
| Insurance | 4 | $225B |
|
||
| Telecommunications | 2 | $144B |
|
||
| Pharmaceuticals | 2 | $112B |
|
||
| Media / Entertainment | 2 | $69B |
|
||
Price history
-27.7% since first listed4 events — show timeline
- 2026-04-24 Pending — CNYIS
- 2026-03-20 Listed $49,900 CNYIS
- 2025-12-31 Listing Removed — CNYIS
- 2025-09-25 Listed $69,000 CNYIS
Cash-flow waterfall
monthlySold comps — $/sqft
last 12 mo · ≤1 miLoading sold comps…