 🏗️ New Construction
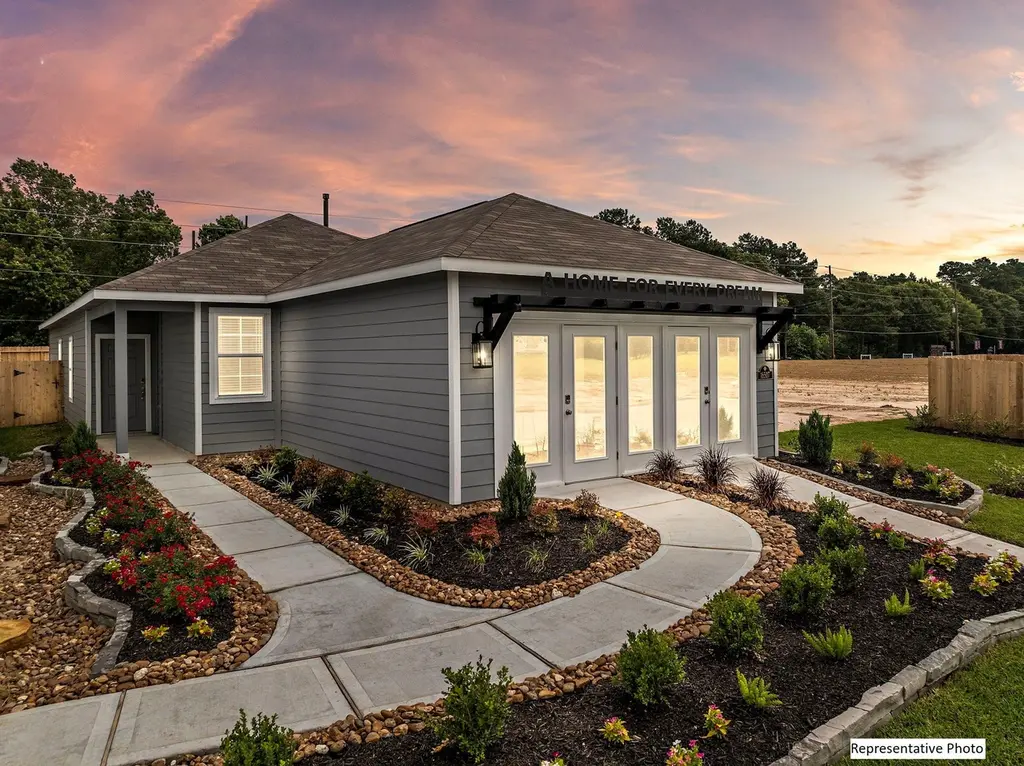
20859 Wildbird Cherry Ln · Porter Heights, TX
Flood risk No data
- FEMA flood zone
- —
- Chance of flooding over 30 yrs
- —
- Est. flood insurance / yr
- —
Fire risk No data
- Est. fire insurance / yr
- —
Heat risk No data
- Hot days now (above threshold)
- —
- Hot days in 30 yrs
- —
Wind risk No data
- Chance of severe wind over 30 yrs
- —
Air-quality risk No data
- Unhealthy air days now
- —
- Unhealthy air days in 30 yrs
- —
Risk factors via First Street. Map © Google.
Why this score? — see what drove the D+ grade
The composite is a weighted blend of 9 inputs, each scored 0–100. Each bar is that input's sub-score; the figure is the points it added to the 100-point composite (weight × sub-score).
- Cash flow +19.7/30.0
- ARV discount +7.5/15.0
- DSCR +6.3/10.0
- 1% rule +4.3/10.0
- Livability +3.2/5.0
- Rent growth +2.9/5.0
- Schools +2.8/10.0
- Condition / age +2.5/5.0
- Appreciation +0.0/10.0
$249,900
🖨 Deal sheet 📄 Offer letter ✓ Due diligence
Listing remarks
The Bridgeport brings everything together in one comfortable, convenient single-story floor plan. Centered around an airy, open kitchen that overlooks a dining room and a great room, the main living area is spacious and inviting. The lavish primary suite boasts a private bath with a walk-in shower, dual vanities, and a walk-in closet. Adjacent, you’ll find three additional bedrooms, offering ample space for rest and relaxation. Home complete 6/30/26. Welcome to Maple Heights, a new home community featuring new houses for sale in Porter, TX by Century Communities—one of the nation's top homebuilders. Conveniently situated 30 minutes northeast of downtown Houston—near Int
Key facts
- 5,062 sq ft lot
- 2 garage spots
- Built 2026
Property features AI
Finance
- HOA & community: Community Solutions INC manages the HOA; Annual association fee of $650
Exterior
- Parking: Attached garage; 2 garage spaces
- Security: Smoke detectors
- Utilities: Public water; Public sewer
- Home design: Residential property; Under construction (new construction); Slab foundation
- Construction: Built by Century Communities; 2026 construction; Brick and cement siding; Composition roof
- Exterior features: Private yard; Subdivision lot
Interior
- Kitchen: Dishwasher; Disposal; Microwave
- Bedrooms: 4 total rooms (includes bedrooms and other rooms)
- Bathrooms: 2 full bathrooms
- Heating & cooling: Central heating (gas); Central air (electric)
- Interior features: Double vanity; Granite counters; Kitchen island; Kitchen/family room combo; Separate shower; Tub with shower; Ceiling fans; Programmable thermostat; Low emissivity windows; ENERGY STAR qualified appliances; Tankless water heater
- Laundry & utility: Washer hookup; Electric dryer hookup
Neighborhood map
What this means for you Summary
Snapshot
- This is a 4-bed/2.0-bath land listed at $250k.
Deal economics
- At list price, monthly cash flow is $291 ($3k/yr) — positive.
- The deal already cash-flows at list — no discount required.
- To meet the 1% rule (rent ≥ 1% of price), the offer needs to be $230k (7.8% below list).
- Recommended offer: $230k (7.8% below list) — sets the bar for 1% rule.
- Cap rate 7.7% vs local median 2.5% in Porter Heights — top-decile yield for the area; either an underpriced asset or a hidden risk that comps aren't pricing in. Stress-test before assuming the spread holds.
Location & tenants
- Location reads 65/100 on livability (#663 in TX) — a middle-class / working-renter tenant base. Strengths: crime A+, employment A+, cost of living A+; Watch: amenities F, commute F, health & safety F.
- New Caney ISD (suburban): math 31% / reading 32% proficiency, ranked #570 of 826 in TX (top 69%) — families likely to look elsewhere, expect single-tenant / working-renter base with shorter leases.
- Zoned schools: White Oak Middle (math 38% / reading 32%, grade F, #842 of 1,662 statewide, top 51%, 834 students, 75% FRL); Porter H S (math 31% / reading 38%, grade F, #963 of 1,632 statewide, top 61%, 2,209 students, 65% FRL).
- Market conditions: Rents rising (+1.6%/yr); 941 active listings in the ZIP; 2 comparable units currently listed for rent nearby; solid renter incomes; 13,259 units permitted in Montgomery County in 2024 (1,402 in 5+ unit buildings).
Forward outlook
- Local home prices are declining (-3.0%/yr); year-one equity from $2k of loan paydown is wiped out by about $7k of value loss. Plan a longer hold.
- Montgomery County population projected at +65% by 2050 — long-run rental-demand tailwind backs the buy-and-hold thesis.
Negotiation context
- It's been on market 41 days — a 3% lower offer ($242k) is reasonable based on typical stale-listing flexibility.
Questions for the listing agent
- It's been on market 41 days. Have you received any prior offers? Is the seller open to a 8% concession, seller financing, or rate buy-down credit?
- What does the HOA fee cover, when was the last increase, and are there any pending special assessments or reserve-fund shortfalls?
- Is there a deadline driving the sale (1031 exchange, divorce, estate, relocation)? That informs how much negotiation room exists.
- Schools are F-rated, which usually means shorter tenancies and higher turnover. Who's the typical renter profile here, and what's been the actual vacancy rate?
- The area grade is low — what's the realistic commute time and amenity access for the typical tenant pool here? Any planned neighborhood developments (good or bad) we should know about?
- What's the average days-on-market for RENTAL listings here right now (not sales)? A rising rental-DOM trend means longer vacancies and softer asking-rent achievability than the comps imply.
- What's the recent tenant-quality profile in this submarket — average credit score on applications, eviction rate, late-payment / NSF rate, and stable-employment percentage? A property-management company in the area should have these aggregated.
- How much new for-sale + rental construction is in the pipeline within 1–3 miles? Heavy new supply typically softens prices + rents 12–24 months out; constrained supply supports both.
Investment metrics
- 1% rule
- 0.93% ✗
- Cap rate
- 7.71%
- Cash-on-cash
- 5.06%
- DSCR
- 1.23
- GRM
- 8.9
CMA / ARV
- ARV (median comp)
- $246,400
- List price
- $249,900
- Delta
- 1.42%
- Verdict
- FAIR
- Comps
- 20 within 1.0 mi
Projected returns pro-forma
-3.0% appreciation · 1.65% rent growth · sell at horizon
- IRR
- -9.9%
- Equity multiple
- 0.64×
- Total profit
- $-24,563
- Equity at exit
- $36,739
- IRR
- -2.3%
- Equity multiple
- 0.85×
- Total profit
- $-10,160
- Equity at exit
- $21,304
Cash invested: $68,992 (down + closing). Projections, not guarantees.
Landlord ↔ Tenant lean methodology
- Overall (STATE)
- 87 Strongly Landlord-Friendly
- State Texas
- 87 Strongly Landlord-Friendly · R+5
- County
- — inherits STATE
- City
- — inherits STATE
ZIP-level market 77365
- Home prices YoY
- -33.0%
- Rents YoY
- 1.6%
- Active inventory
- 941
- Price-to-rent
- 9.0×
Monthly cashflow live
- Estimated rent
- $2,304 medium interval (Pro) →
- Mortgage (P&I)
- −$1,292
- Tax from tax record
- −$80 /mo · $963/yr
- Insurance
- −$103
- HOA
- −$54
- Vacancy / Maint / Mgmt
- −$484
- Net cashflow
- $291
Break-even live
UW: 25.0% down · 7.5% · 30yr · 1.5% tax · 5.0% vac · 8.0% maint · 8.0% mgmt
Financing live
Cash to close
- Down payment
- $61,600
- Closing costs
- $7,392
- Reserves months
- —
- Total cash needed
- —
Loan-product check · same deal, 3 products live
Conventional
25% down · 7.5% · 30yr
- Down + closing
- —
- Monthly P&I
- —
- Monthly cashflow
- —
- DSCR
- —
- Eligible?
- —
Personal DTI + credit; lowest rate.
DSCR
20% down · 8.5% · 30yr
- Down + closing
- —
- Monthly P&I
- —
- Monthly cashflow
- —
- DSCR
- —
- Eligible?
- —
No personal income docs; deal must DSCR.
Hard money
10% down · 12.0% · 12mo
- Down + closing
- —
- Monthly P&I
- —
- Monthly cashflow
- —
- DSCR
- —
- Eligible?
- —
Short-term bridge; refi at stabilization.
Rent comps 2 comps
| Address | Beds | Baths | Sqft | Rent | $/sqft | DOM | Units | Dist |
|---|---|---|---|---|---|---|---|---|
| 16658 Moss Ln Porter, TX | 3.0 | 2.0 | 1402 | $1,750 | $1.25 | 24d | 1 | 0.24mi |
| 21019 Voyage Ln Porter, TX | 3.0 | 2.5 | 1678 | $1,795 | $1.07 | 43d | 1 | 0.33mi |
HOA detail
- Monthly dues
- $54 · $648/yr
Listing history 20 events
-
2026-06-15status $249,900 Pending 41 DOM
-
2026-06-15days on market $249,900 Active 41 DOM
-
2026-06-13days on market $249,900 Active 39 DOM
-
2026-06-09days on market $249,900 Active 35 DOM
-
2026-06-08days on market $249,900 Active 34 DOM
-
2026-06-07days on market $249,900 Active 33 DOM
-
2026-06-04days on market $249,900 Active 30 DOM
-
2026-06-03days on market $249,900 Active 29 DOM
-
2026-06-02days on market $249,900 Active 28 DOM
-
2026-06-01days on market $249,900 Active 27 DOM
-
2026-05-31days on market $249,900 Active 26 DOM
-
2026-05-14price $249,900 961-char remark
-
2026-05-14price $249,900 431-char remark
-
2026-05-06price $256,900 431-char remark
-
2026-05-06price $261,900 431-char remark
-
2026-05-06price $256,900 961-char remark
-
2026-05-06price $256,900 431-char remark
-
2026-05-05$261,900 Active 961-char remark
-
2026-05-02price $261,900 431-char remark
-
2026-04-29$258,900 Active 431-char remark
ⓘ Source: listings_history table (triggers on properties + properties_extension) + one-shot
backfill from property_details.listing_events for pre-trigger history.
Tax reassessment forecast TX · Resets to sale price
- Current annual tax
- $963 · $80/mo
- Projected year-2 tax
- $4,573 · $381/mo
- Expected delta
- +$3,611/yr (+$301/mo · 375.1%)
ⓘ Screening estimate from a state-policy table — verify with the county assessor before closing.
Nearby sold comps map
Loading sold comps map…
Walkable amenities ~0.75 mi
Loading nearby amenities…
Taxation est. · year 1
- Rental income
- $27,644
- − Mortgage interest
- −$13,802
- − Property taxes
- −$963
- − Insurance
- −$1,232
- − Repairs & maintenance
- −$2,211
- − Management
- −$2,211
- − HOA
- −$648
- − Depreciation
- −$7,168
- Taxable loss
- −$592
- Est. tax savings @ 24.0%
- +$142
- After-tax cash flow
- $3,632/yr
For passive investors: Depreciation is non-cash, so a rental often shows a tax loss while cash-flowing — sheltering income. Rental losses are passive: they offset passive income freely, and up to $25,000/yr can offset ordinary (W-2) income if you actively participate and your MAGI is under $100k (phasing out to $0 by $150k); unused losses carry forward. On sale, claimed depreciation is recaptured at up to 25%, and gains may owe capital-gains tax (a 1031 exchange can defer both). Figures are a year-1 estimate at your 24.0% rate — not tax advice; consult a CPA.
Schools (NCES district)
- District
- New Caney ISD
- NCES district ID
- 4832400
- Math proficiency
- 31% ▼ -16.00%
- Reading proficiency
- 32% ▼ -6.00%
- Median HH income
- $55,380
- Composite
- 27.97/100
- National rank
- #6857
- State rank
- #570 of 826 in TX
Livability — Porter Heights
- Score
- 65/100
- State rank
- #663
- US rank
- #12479
Category grades
Schools grade is shown separately in the Schools card above.
Census & demographics
- Census place
- Porter Heights, TX
- County
- Montgomery County · 663,713 people
- Metro
- Houston-The Woodlands-Sugar Land, TX
- Population (ZIP)
- 46,418
- Household income
- $95,702
- Rent vs Own
- Severe rent burden
- 1016.0
Population outlook (Montgomery County) Hauer SSP2
- Today (2025)
- 713,896 people
- By 2030
- 805,263 · +12.8%
- By 2040
- 992,708 · +39.1%
- By 2050
- 1,179,590 · +65.2%
- By 2075
- 1,628,084 · +128.1%
- By 2100
- 1,937,880 · +171.5%
Race, ethnicity, and origin ACS 2023
- Neighborhood character
- Diverse neighborhood (Simpson 0.59)
- Race & ethnicity
- Hispanic / Latino 46% White 44% Two or more races 15% Black 5% Asian 3%
- Hispanic origin (detail)
- Mexican 39% Puerto Rican 1%
- Common ancestry
- Lithuanian 4% Slovak 2% Romanian 2%
- Foreign-born
- 18% · Canada
- Languages at home
- 59% English-only · Spanish 36% Other Indo-European 2% Russian/Polish/Slavic 1%
Political lean MEDSL · Montgomery
- 2024 margin
- Solid R (+45.5) · D 26.8% · R 72.3%
- 2008→2024 swing
- +7.2pp toward D · 2008: -52.7pp · 2024: -45.5pp
- All cycles
- 2024: R+45.5 2020: R+43.8 2016: R+51.4 2012: R+60.7 2008: R+52.7
Not yet ingested
- Civics
- —
Market trends
- HPI YoY
- ▼ -111.46%
- Current HPI
- 225.9903
- Rent YoY
- ▲ 1.65%
- Metro
- Houston-The Woodlands-Sugar Land, TX
- State GDP YoY
- ▲ 3.95%
- F500 in state
- 110
Industry mix (Fortune 500 HQ in TX)
| Industry | F500 HQs | Revenue |
|---|---|---|
| Energy | 16 | $1,198B |
|
||
| Technology | 5 | $198B |
|
||
| Engineering / Construction | 4 | $72B |
|
||
| Energy Services | 3 | $60B |
|
||
| Utilities | 3 | $41B |
|
||
| Healthcare | 2 | $330B |
|
||
Price history
-4.6% since first listed4 events — show timeline
- 2026-06-15 Pending — HARMLS
- 2026-05-14 Price Changed $249,900 HARMLS
- 2026-05-06 Price Changed $256,900 HARMLS
- 2026-05-05 Listed $261,900 HARMLS
Cash-flow waterfall
monthlySold comps — $/sqft
last 12 mo · ≤1 miLoading sold comps…