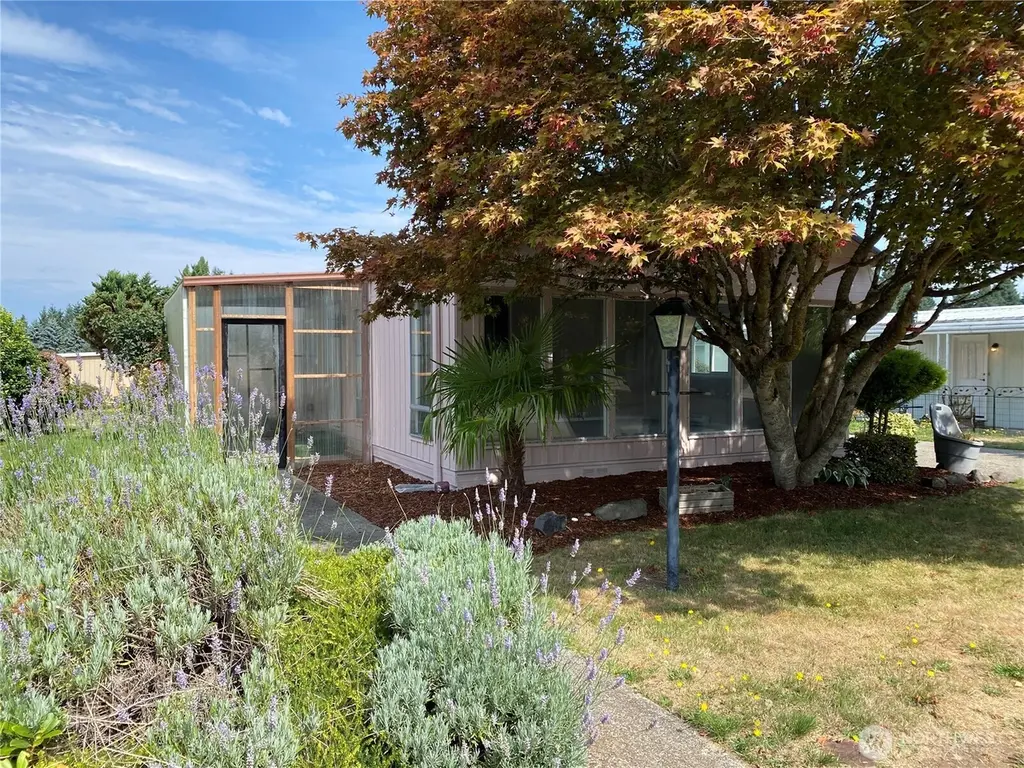
1342 Alonda Ln NE · Lacey, WA
Flood risk No data
- FEMA flood zone
- —
- Chance of flooding over 30 yrs
- —
- Est. flood insurance / yr
- —
Fire risk No data
- Est. fire insurance / yr
- —
Heat risk No data
- Hot days now (above threshold)
- —
- Hot days in 30 yrs
- —
Wind risk No data
- Chance of severe wind over 30 yrs
- —
Air-quality risk No data
- Unhealthy air days now
- —
- Unhealthy air days in 30 yrs
- —
Risk factors via First Street. Map © Google.
Why this score? — see what drove the B- grade
The composite is a weighted blend of 9 inputs, each scored 0–100. Each bar is that input's sub-score; the figure is the points it added to the 100-point composite (weight × sub-score).
- Cash flow +30.0/30.0
- 1% rule +10.0/10.0
- DSCR +10.0/10.0
- Schools +5.1/10.0
- Livability +4.2/5.0
- Rent growth +3.4/5.0
- Condition / age +2.5/5.0
- ARV discount +2.2/15.0
- Appreciation +0.0/10.0
$74,500
🖨 Deal sheet 📄 Offer letter ✓ Due diligence
Listing remarks
Everything is updated in this charming home in the highly desirable Alonda Villa 55+ community! New flooring, new appliances, new light fixtures, new bathroom fixtures, new carpet in the bedrooms, new water heater, and new paint inside and out! Gaze out the floor to ceiling windows in the front room to enjoy the surrounding beautiful mature trees and lovely landscaping. Large shed for extra storage! Peaceful and idyllic this is a fantastic place to call home, yet still being centrally located. Close to shopping, dining, parks and trails, 5 min away from I-5, and close to schools and hospitals. Welcome home!
Key facts
- Built 1968
- Listed 71 days
Neighborhood map
What this means for you Summary
Snapshot
- This is a 2-bed/2.0-bath manufactured listed at $74k.
Deal economics
- At list price, monthly cash flow is $1k ($15k/yr) — positive.
- The deal already cash-flows at list — no discount required.
- Meets the 1% rule at list price ($2k rent vs $74k).
- Recommended offer: $70k (6.0% below list) — sets the bar for market timing.
- Cap rate 27.1% vs local median 3.0% in Lacey — top-decile yield for the area; either an underpriced asset or a hidden risk that comps aren't pricing in. Stress-test before assuming the spread holds.
Location & tenants
- Location reads 85/100 on livability (#33 in WA, #581 nationally) — a professional / high-income tenant draw. Strengths: amenities A+, commute A+, housing A+; Watch: cost of living D+.
- North Thurston Public Schools (suburban): math 51% / reading 62% proficiency, ranked #80 of 291 in WA (top 28%) — acceptable for families but not a draw, mixed tenant base, ~2y average lease.
- Market conditions: Rents rising (+3.8%/yr); 218 active listings in the ZIP; 13 comparable units currently listed for rent nearby; rentals leasing fast (median 14d on market — plan ~1-2 weeks tenant-placement turnaround); solid renter incomes; 1,222 units permitted in Thurston County in 2024 (508 in 5+ unit buildings).
Forward outlook
- Local home prices are declining (-3.0%/yr); year-one equity from $515 of loan paydown is wiped out by about $2k of value loss. Plan a longer hold.
- Thurston County population projected at +27% by 2050 — long-run rental-demand tailwind backs the buy-and-hold thesis.
- At projected returns (-3.0% appreciation + 3.8% rent growth), your $21k cash investment doubles in ~2 years — after that, you're playing with house money.
Negotiation context
- It's been on market 71 days — a 6% lower offer ($70k) is reasonable based on typical stale-listing flexibility.
- 2 sale attempts since 21y ago; this cycle's ask has dropped $10k (12%) from the opening price — seller is motivated, your offer sets the floor, not the list.
- Current owner paid $8k; list at $74k implies a 893% gain — meaningful room to come down on a strong offer.
Questions for the listing agent
- It's been on market 71 days. Have you received any prior offers? Is the seller open to a 6% concession, seller financing, or rate buy-down credit?
- Built in 1968 — when were the roof, HVAC, electrical panel, plumbing, and water heater last replaced?
- Why hasn't it sold? Are there any deal-killer items the seller is aware of (foundation, flood, title, zoning, code violations)?
- Is there a deadline driving the sale (1031 exchange, divorce, estate, relocation)? That informs how much negotiation room exists.
- Schools are B-rated — typically a magnet for longer-tenancy family renters. What's the average tenant stay here, and is there a school-zone premium baked into asking?
- What's the average days-on-market for RENTAL listings here right now (not sales)? A rising rental-DOM trend means longer vacancies and softer asking-rent achievability than the comps imply.
- What's the recent tenant-quality profile in this submarket — average credit score on applications, eviction rate, late-payment / NSF rate, and stable-employment percentage? A property-management company in the area should have these aggregated.
- How much new for-sale + rental construction is in the pipeline within 1–3 miles? Heavy new supply typically softens prices + rents 12–24 months out; constrained supply supports both.
Investment metrics
- 1% rule
- 2.94% ✓
- Cap rate
- 27.08%
- Cash-on-cash
- 74.23%
- DSCR
- 4.30
- GRM
- 2.8
CMA / ARV
- ARV (median comp)
- $66,622
- List price
- $74,500
- Delta
- 11.82%
- Verdict
- OVERPRICED
- Comps
- 6 within 1.0 mi
Show comp detail 5 sales within ~0.75 mi
| Address | Dist | Beds/Ba | Sqft | Sold | Price | $/sf | Match |
|---|---|---|---|---|---|---|---|
| 1519 Alonda Ln NE | 0.02mi | 2/2.0 | 1,152 (+11%) | 8mo | $60,000 | $52 | 74 |
| 1417 Alonda Ln NE | 0.03mi | 2/1.5 | 960 (-8%) | 13mo | $65,000 | $68 | 73 |
| 1350 Alonda Ln NE | 0.07mi | 2/2.0 | 1,152 (+11%) | 7mo | $50,000 | $43 | 73 |
| 4611 17th Ln NE #17 | 0.18mi | 2/1.0 | 1,056 (+2%) | 22mo | $142,500 | $135 | 66 |
| 2005 Alonda Ln NE | 0.07mi | 2/1.0 | 960 (-8%) | 23mo | $49,500 | $52 | 61 |
Match score weights: distance 35% · size 25% · config 20% · recency 20%. Top-matched comps best support the ARV.
Projected returns pro-forma
-3.0% appreciation · 3.75% rent growth · sell at horizon
- IRR
- 74.8%
- Equity multiple
- 4.44×
- Total profit
- $71,764
- Equity at exit
- $11,108
- IRR
- 78.8%
- Equity multiple
- 9.40×
- Total profit
- $175,202
- Equity at exit
- $6,441
Cash invested: $20,860 (down + closing). Projections, not guarantees.
Landlord ↔ Tenant lean methodology
- Overall (STATE)
- 28 Tenant-Leaning
- State Washington
- 28 Tenant-Leaning · D+8
- County
- — inherits STATE
- City
- — inherits STATE
ZIP-level market 98516
- Rents YoY
- 3.8%
- Active inventory
- 218
- Price-to-rent
- 2.8×
Monthly cashflow live
- Estimated rent
- $2,191 high interval (Pro) →
- Mortgage (P&I)
- −$391
- Tax from tax record
- −$18 /mo · $222/yr
- Insurance
- −$31
- HOA
- −$0
- Vacancy / Maint / Mgmt
- −$460
- Net cashflow
- $1,290
Break-even live
UW: 25.0% down · 7.5% · 30yr · 1.5% tax · 5.0% vac · 8.0% maint · 8.0% mgmt
Financing live
Cash to close
- Down payment
- $18,625
- Closing costs
- $2,235
- Reserves months
- —
- Total cash needed
- —
Loan-product check · same deal, 3 products live
Conventional
25% down · 7.5% · 30yr
- Down + closing
- —
- Monthly P&I
- —
- Monthly cashflow
- —
- DSCR
- —
- Eligible?
- —
Personal DTI + credit; lowest rate.
DSCR
20% down · 8.5% · 30yr
- Down + closing
- —
- Monthly P&I
- —
- Monthly cashflow
- —
- DSCR
- —
- Eligible?
- —
No personal income docs; deal must DSCR.
Hard money
10% down · 12.0% · 12mo
- Down + closing
- —
- Monthly P&I
- —
- Monthly cashflow
- —
- DSCR
- —
- Eligible?
- —
Short-term bridge; refi at stabilization.
Rent comps 13 comps
| Address | Beds | Baths | Sqft | Rent | $/sqft | DOM | Units | Dist |
|---|---|---|---|---|---|---|---|---|
| 927 College Ln NE Unit A Lacey, WA | 3.0 | 2.5 | 1390 | $2,300 | $1.65 | 43d | 1 | 0.26mi |
| 925 Bradley St NE Olympia, WA | 3.0 | 2.0 | 1403 | $2,650 | $1.89 | 43d | 1 | 0.30mi |
| 5224 15th Ave NE Olympia, WA | 1.0–3.0 | 1.0–2.0 | 881 | $2,165 | $2.46 | 13d | 258 | 0.55mi |
| 1848 Mapleview Ct NE Olympia, WA | 3.0 | 2.0 | 1489 | $3,000 | $2.01 | 43d | 1 | 0.64mi |
| 5499 15th Ave NE Lacey, WA | 1.0–3.0 | 1.0–2.0 | 904 | $2,106 | $2.33 | 13d | 26 | 0.71mi |
| 606 Lilly Rd NE Olympia, WA | 1.0–2.0 | 1.0–2.0 | 966 | $2,725 | $2.82 | 13d | 7 | 0.76mi |
| 522 Lilly Rd NE Olympia, WA | 1.0–2.0 | 1.0 | 781 | $1,550 | $1.98 | 13d | 6 | 0.82mi |
| 3724 Ensign Rd NE Olympia, WA | 2.0 | 1.0–2.0 | 920 | $1,849 | $2.01 | 13d | 5 | 0.98mi |
| 801 Lilly Rd NE Apt 123 Olympia, WA | 1.0 | 1.0 | 762 | $1,700 | $2.23 | 43d | 1 | 1.04mi |
| 4410 6th Ave SE Lacey, WA | 1.0–3.0 | 1.0–2.0 | 980 | $2,010 | $2.05 | 13d | 14 | 1.12mi |
| 122 Lilly Rd NE Unit 507 Olympia, WA | 3.0 | 1.0 | 800 | $1,900 | $2.38 | 21d | 1 | 1.14mi |
| 122 Lilly Rd NE Unit 104 Olympia, WA | 2.0 | 1.0 | 750 | $1,700 | $2.27 | 21d | 1 | 1.14mi |
| 501 Franz Anderson Rd SE Olympia, WA | 1.0 | 1.0 | 720 | $1,598 | $2.22 | 13d | 3 | 1.46mi |
Listing history 19 events
-
2026-06-18days on market $74,500 Active 71 DOM
-
2026-06-17days on market $74,500 Active 70 DOM
-
2026-06-16days on market $74,500 Active 69 DOM
-
2026-06-15days on market $74,500 Active 68 DOM
-
2026-06-14days on market $74,500 Active 66 DOM
-
2026-06-13days on market $74,500 Active 65 DOM
-
2026-06-10days on market $74,500 Active 63 DOM
-
2026-06-09days on market $74,500 Active 62 DOM
-
2026-06-08days on market $74,500 Active 61 DOM
-
2026-06-07pricedays on market $74,500 Active 60 DOM
-
2026-06-03days on market $79,000 Active 56 DOM
-
2026-06-02days on market $79,000 Active 55 DOM
-
2026-06-01days on market $79,000 Active 54 DOM
-
2026-05-31days on market $79,000 Active 53 DOM
-
2026-05-30days on market $79,000 Active 52 DOM
-
2026-04-28price $79,000
-
2025-04-08$84,500 Active
-
2005-05-10soldstatus $7,500
-
2005-02-01$12,500
ⓘ Source: listings_history table (triggers on properties + properties_extension) + one-shot
backfill from property_details.listing_events for pre-trigger history.
Tax reassessment forecast WA · Resets to sale price
- Current annual tax
- $222 · $18/mo
- Projected year-2 tax
- $730 · $61/mo
- Expected delta
- +$508/yr (+$42/mo · 228.9%)
ⓘ Screening estimate from a state-policy table — verify with the county assessor before closing.
Nearby sold comps map
Loading sold comps map…
Walkable amenities ~0.75 mi
Loading nearby amenities…
Taxation est. · year 1
- Rental income
- $26,287
- − Mortgage interest
- −$4,173
- − Property taxes
- −$222
- − Insurance
- −$372
- − Repairs & maintenance
- −$2,103
- − Management
- −$2,103
- − Depreciation
- −$2,167
- Taxable income
- $15,146
- Est. tax owed @ 24.0%
- −$3,635
- After-tax cash flow
- $11,849/yr
For passive investors: Depreciation is non-cash, so a rental often shows a tax loss while cash-flowing — sheltering income. Rental losses are passive: they offset passive income freely, and up to $25,000/yr can offset ordinary (W-2) income if you actively participate and your MAGI is under $100k (phasing out to $0 by $150k); unused losses carry forward. On sale, claimed depreciation is recaptured at up to 25%, and gains may owe capital-gains tax (a 1031 exchange can defer both). Figures are a year-1 estimate at your 24.0% rate — not tax advice; consult a CPA.
Schools (NCES district)
- District
- North Thurston Public Schools
- NCES district ID
- 5305850
- Math proficiency
- 51% ▬ 0.00%
- Reading proficiency
- 62% ▬ 0.00%
- Median HH income
- $62,338
- Composite
- 51.09/100
- National rank
- #3798
- State rank
- #80 of 291 in WA
Livability — Lacey
- Score
- 85/100
- State rank
- #33
- US rank
- #581
Category grades
Schools grade is shown separately in the Schools card above.
Census & demographics
- County
- Thurston County · 269,345 people
- City population
- 108,850
- Metro
- Olympia-Lacey-Tumwater, WA
- Population (ZIP)
- 29,177
- Household income
- $98,892
- Rent vs Own
- Severe rent burden
- 1202.0
Population outlook (Thurston County) Hauer SSP2
- Today (2025)
- 308,239 people
- By 2030
- 326,483 · +5.9%
- By 2040
- 359,890 · +16.8%
- By 2050
- 391,800 · +27.1%
- By 2075
- 468,024 · +51.8%
- By 2100
- 519,890 · +68.7%
Race, ethnicity, and origin ACS 2023
- Neighborhood character
- Diverse neighborhood (Simpson 0.58)
- Race & ethnicity
- White 62% Two or more races 14% Asian 11% Hispanic / Latino 10% Black 4% Pacific Islander 1%
- Hispanic origin (detail)
- Mexican 6%
- Common ancestry
- Portuguese 3% Lithuanian 2% Iranian 2%
- Foreign-born
- 14% · Canada, Vietnam, South Korea
- Languages at home
- 81% English-only · Spanish 7% Other Asian/Pacific 3% Tagalog/Filipino 2%
Political lean MEDSL · Thurston
- 2024 margin
- Strong D (+20.4) · D 58.5% · R 38.1% · Other 3.5%
- 2008→2024 swing
- -1.3pp toward R · 2008: 21.7pp · 2024: 20.4pp
- All cycles
- 2024: D+20.4 2020: D+18.6 2016: D+15.4 2012: D+19.0 2008: D+21.7
Not yet ingested
- Civics
- —
Market trends
- HPI YoY
- ▼ -203.16%
- Current HPI
- 323.7121
- Rent YoY
- ▲ 3.75%
- Metro
- Olympia-Lacey-Tumwater, WA
- State GDP YoY
- ▲ 4.65%
- F500 in state
- 22
Industry mix (Fortune 500 HQ in WA)
| Industry | F500 HQs | Revenue |
|---|---|---|
| Retail | 2 | $269B |
|
||
| Technology / Retail | 1 | $638B |
|
||
| Technology | 1 | $245B |
|
||
| Telecommunications | 1 | $38B |
|
||
| Food / Beverage | 1 | $36B |
|
||
| Automotive / Trucks | 1 | $34B |
|
||
Price history
+532.0% since first listed4 events — show timeline
- 2026-04-28 Price Changed $79,000 NWMLS as Distributed by MLS Grid
- 2025-04-08 Listed $84,500 NWMLS as Distributed by MLS Grid
- 2005-05-10 Sold (MLS) $7,500 NWMLS as Distributed by MLS Grid
- 2005-02-01 Listed $12,500 NWMLS as Distributed by MLS Grid
Property tax history
+6.5%/yrLatest (2026): $222 · -3.5% YoY. Source: county tax records.
Cash-flow waterfall
monthlySold comps — $/sqft
last 12 mo · ≤1 miLoading sold comps…