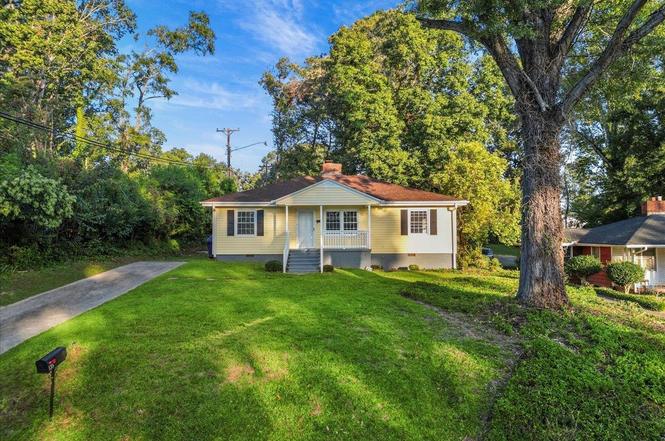
135 Overbrook Cir · Spartanburg, SC
Flood risk 1/10 · Minimal
- FEMA flood zone
- X (unshaded)
- Chance of flooding over 30 yrs
- 0.0%
- Est. flood insurance / yr
- $507 – $1,088
Fire risk 1/10 · Minimal
- Est. fire insurance / yr
- $783 – $1,453
Heat risk 6/10 · Moderate
- Hot days now (above 105°F)
- 7 days/yr
- Hot days in 30 yrs
- 16 days/yr
Wind risk 2/10 · Minimal
- Chance of severe wind over 30 yrs
- 2.0%
Air-quality risk 4/10 · Minor
- Unhealthy air days now
- 4 days/yr
- Unhealthy air days in 30 yrs
- 4 days/yr
Risk factors via First Street. Map © Google.
Why this score? — see what drove the D- grade
The composite is a weighted blend of 9 inputs, each scored 0–100. Each bar is that input's sub-score; the figure is the points it added to the 100-point composite (weight × sub-score).
- Cash flow +12.2/30.0
- ARV discount +7.0/15.0
- Livability +3.8/5.0
- DSCR +3.6/10.0
- Rent growth +3.4/5.0
- 1% rule +3.2/10.0
- Schools +3.1/10.0
- Condition / age +2.5/5.0
- Appreciation +0.0/10.0
$185,000
🖨 Deal sheet (PDF) 📄 Offer letter ✓ Due diligence
Listing remarks
135 Overbrook Circle is a great opportunity for comfortable living at an affordable price and no HOA. The living room and separate dining room provide space for both relaxation and entertaining. It features a renovated kitchen with new appliances. It includes three sizable bedrooms and a renovated bathroom. The flex room offers endless possibilities – use it as a flex space, office, or 4th bedroom to suit your needs. The home includes new lvp flooring throughout, new roof (2024), water heater (2024), new split unit for added comfort. Conveniently located near shopping and everyday amenities. You’ll be just minutes from Hatcher Garden & Woodland Preserve and Spartanburg&rsq
Key facts
- Renovated bathroom
- New water heater
- Renovated kitchen
Tags
Property features AI
Exterior
- Parking: Driveway
- Utilities: Public water; Public sewer
- Home design: Single-family residence; One level
- Construction: Vinyl siding; Built above grade (finished area listed)
- Exterior features: Patio; Porch; Sloped, level and wooded yard
Interior
- Kitchen: Microwave; Electric range / Free-standing range; Gas water heater
- Bedrooms: 4 bedrooms on the main level
- Bathrooms: 1 full bathroom on the main level
- Heating & cooling: Heat pump with electric and ductless heating options; Central electric air conditioning
- Interior features: Storm windows; Fireplace (1)
- Laundry & utility: Main-level laundry closet with washer and electric dryer hookups
Neighborhood map
What this means for you Summary
Snapshot
- This is a 3-bed/1.0-bath single-family listed at $185k.
Deal economics
- At list price, monthly cash flow is $-36 ($-429/yr) — negative.
- To cash-flow at today's rent, offer at most $179k (3.4% below list).
- To meet the 1% rule (rent ≥ 1% of price), the offer needs to be $151k (18.2% below list).
- Recommended offer: $151k (18.2% below list) — sets the bar for 1% rule.
- Cap rate 6.1% vs local median 3.9% in Spartanburg — top-decile yield for the area; either an underpriced asset or a hidden risk that comps aren't pricing in. Stress-test before assuming the spread holds.
Location & tenants
- Location reads 76/100 on livability (#24 in SC, #3,679 nationally) — a middle-class / working-renter tenant base. Strengths: amenities A+, commute A+, cost of living A+; Watch: crime F, employment F.
- Spartanburg 07 (urban): math 34% / reading 41% proficiency, ranked #39 of 80 in SC (top 49%) — families likely to look elsewhere, expect single-tenant / working-renter base with shorter leases; 62% free/reduced lunch — lower-income household profile, screen leases tightly.
- Zoned schools: Mary H. Wright Elementary (math 22% / reading 22%, grade F, #475 of 597 statewide, top 81%, 455 students, 100% FRL); Carver Middle (math 14% / reading 21%, grade F, #189 of 229 statewide, top 83%, 683 students, 100% FRL); Spartanburg High (math 67% / reading 79%, grade B+, #44 of 196 statewide, top 23%, 2,056 students, 85% FRL) — zoned schools average 95% FRL vs 62% district-wide (33 pts higher); higher-poverty schools than district average — tighter screening recommended.
- Market conditions: Rents rising (+3.5%/yr); 236 active listings in the ZIP; 8 comparable units currently listed for rent nearby; rentals at typical pace (median 23d on market — plan ~3-4 weeks tenant-placement turnaround); lower-income renter base — watch delinquency; 3,129 units permitted in Spartanburg County in 2024 (40 in 5+ unit buildings).
- This rent runs 44% of the median local income ($41k/yr) — at the standard rent-burdened threshold; future hikes will face affordability resistance.
Forward outlook
- Local home prices are declining (-3.0%/yr); year-one equity from $1k of loan paydown is wiped out by about $6k of value loss. Plan a longer hold.
- Spartanburg County population projected at +18% by 2050 — long-run rental-demand tailwind backs the buy-and-hold thesis.
Negotiation context
- It's been on market 68 days — a 6% lower offer ($174k) is reasonable based on typical stale-listing flexibility.
- 5 sale attempts since 19y ago; this cycle's ask has dropped $10k (5%) from the opening price — seller is motivated, your offer sets the floor, not the list.
- Current owner paid $36k; list at $185k implies a 414% gain — meaningful room to come down on a strong offer.
Risks & watch-outs
- Watch-outs: built in 1952 — expect roof / HVAC / electrical / plumbing capex.
- Climate carrying-cost: extreme-heat days projected 7→16/yr by 2055 (HVAC capex compounding) — expect insurance premiums to compound above CPI over the hold.
Questions for the listing agent
- What do current leases actually rent for vs. the listed asking? Can we see a recent rent roll and the last 12 months of T-12 income?
- It's been on market 68 days. Have you received any prior offers? Is the seller open to a 18% concession, seller financing, or rate buy-down credit?
- Built in 1952 — when were the roof, HVAC, electrical panel, plumbing, and water heater last replaced?
- Why hasn't it sold? Are there any deal-killer items the seller is aware of (foundation, flood, title, zoning, code violations)?
- Is there a deadline driving the sale (1031 exchange, divorce, estate, relocation)? That informs how much negotiation room exists.
- Schools are D-rated, which usually means shorter tenancies and higher turnover. Who's the typical renter profile here, and what's been the actual vacancy rate?
- Crime grade is F in this area — have there been break-ins, vandalism, or insurance claims at this property in the last 3 years? What carrier currently insures it and at what premium?
- The area grade is low — what's the realistic commute time and amenity access for the typical tenant pool here? Any planned neighborhood developments (good or bad) we should know about?
- What's the average days-on-market for RENTAL listings here right now (not sales)? A rising rental-DOM trend means longer vacancies and softer asking-rent achievability than the comps imply.
- What's the recent tenant-quality profile in this submarket — average credit score on applications, eviction rate, late-payment / NSF rate, and stable-employment percentage? A property-management company in the area should have these aggregated.
- How much new for-sale + rental construction is in the pipeline within 1–3 miles? Heavy new supply typically softens prices + rents 12–24 months out; constrained supply supports both.
Investment metrics
- 1% rule
- 0.82% ✗
- Cap rate
- 6.06%
- Cash-on-cash
- -0.83%
- DSCR
- 0.96
- GRM
- 10.2
CMA / ARV
- ARV (on-the-fly)
- $182,784
- Comps found
- 11
Show comp detail 11 sales within ~0.75 mi
| Address | Dist | Beds/Ba | Sqft | Sold | Price | $/sf | Match |
|---|---|---|---|---|---|---|---|
| 135 Overbrook Cir | 0.00mi | 4/1.0 (+1) | 1,632 (0%) | 0mo | $183,000 | $112 | 95 |
| 304 Westview Blvd | 0.16mi | 3/2.0 | 1,497 (-8%) | 6mo | $199,900 | $134 | 69 |
| 423 Bethlehem Dr | 0.52mi | 4/2.0 (+1) | 1,541 (-6%) | 6mo | $165,000 | $107 | 52 |
| 701 Ridgedale Drive Dr | 0.72mi | 3/2.0 | 1,636 (+0%) | 13mo | $97,000 | $59 | 51 |
| 275 S Highpoint Rd | 0.62mi | 3/2.5 | 1,644 (+1%) | 18mo | $240,000 | $146 | 49 |
| 321 Ammons Rd | 0.54mi | 3/2.5 | 1,470 (-10%) | 5mo | $137,500 | $94 | 48 |
| 295 S Highpoint Rd | 0.60mi | 3/2.5 | 1,726 (+6%) | 13mo | $233,500 | $135 | 46 |
| 413 Concord Ave | 0.44mi | 3/2.0 | 1,395 (-14%) | 14mo | $221,500 | $159 | 40 |
| 417 Bethlehem Dr | 0.55mi | 4/2.0 (+1) | 1,702 (+4%) | 22mo | $169,000 | $99 | 40 |
| 145 Marlboro Rd | 0.71mi | 3/2.0 | 1,426 (-13%) | 13mo | $205,000 | $144 | 31 |
| 166 Edwards Ave | 0.75mi | 3/1.0 | 1,400 (-14%) | 12mo | $90,000 | $64 | 31 |
Match score weights: distance 35% · size 25% · config 20% · recency 20%. Top-matched comps best support the ARV.
Projected returns pro-forma
-3.0% appreciation · 3.46% rent growth · sell at horizon
- IRR
- -17.2%
- Equity multiple
- 0.39×
- Total profit
- $-31,558
- Equity at exit
- $27,584
- IRR
- -8.3%
- Equity multiple
- 0.47×
- Total profit
- $-27,521
- Equity at exit
- $15,995
Cash invested: $51,800 (down + closing). Projections, not guarantees.
Landlord ↔ Tenant lean methodology
- Overall (STATE)
- 90 Strongly Landlord-Friendly
- State South Carolina
- 90 Strongly Landlord-Friendly · R+6
- County
- — inherits STATE
- City
- — inherits STATE
ZIP-level market 29306
- Home prices YoY
- -29.9%
- Rents YoY
- 3.5%
- Active inventory
- 236
- Price-to-rent
- 10.2×
Monthly cashflow live
- Estimated rent
- $1,514 high interval (Pro) →
- Mortgage (P&I)
- −$970
- Tax from tax record
- −$185 /mo · $2,217/yr
- Insurance
- −$77
- HOA
- −$0
- Vacancy / Maint / Mgmt
- −$318
- Net cashflow
- $-36
Break-even live
Sensitivity live
| Price | -10% $69 | -5% $17 | +0% $-36 | +5% $-88 | +10% $-140 |
|---|---|---|---|---|---|
| Rent | -10% $-155 | -5% $-96 | +0% $-36 | +5% $24 | +10% $84 |
| Rate | -1.0pp $57 | -0.5pp $11 | base $-36 | +0.5pp $-84 | +1.0pp $-132 |
UW: 25.0% down · 7.5% · 30yr · 1.5% tax · 5.0% vac · 8.0% maint · 8.0% mgmt
Financing live
Cash to close
- Down payment
- $46,250
- Closing costs
- $5,550
- Reserves months
- —
- Total cash needed
- —
Loan-product check · same deal, 3 products live
Conventional
25% down · 7.5% · 30yr
- Down + closing
- —
- Monthly P&I
- —
- Monthly cashflow
- —
- DSCR
- —
- Eligible?
- —
Personal DTI + credit; lowest rate.
DSCR
20% down · 8.5% · 30yr
- Down + closing
- —
- Monthly P&I
- —
- Monthly cashflow
- —
- DSCR
- —
- Eligible?
- —
No personal income docs; deal must DSCR.
Hard money
10% down · 12.0% · 12mo
- Down + closing
- —
- Monthly P&I
- —
- Monthly cashflow
- —
- DSCR
- —
- Eligible?
- —
Short-term bridge; refi at stabilization.
Rent comps 8 comps
| Address | Beds | Baths | Sqft | Rent | $/sqft | DOM | Units | Dist |
|---|---|---|---|---|---|---|---|---|
| 522 Pennwood Dr Spartanburg, SC | 3.0 | 1.0 | 1153 | $1,400 | $1.21 | 23d | 1 | 0.12mi |
| 111 Timothy St Spartanburg, SC | 2.0 | 1.0 | 1100 | $1,600 | $1.45 | 23d | 1 | 0.71mi |
| 275 Vanderbilt Spartanburg, SC | 3.0 | 2.5 | 1300 | $1,495 | $1.15 | 15d | 1 | 1.19mi |
| 267 Vanderbilt Rd Spartanburg, SC | 3.0 | 2.5 | 1300 | $1,795 | $1.38 | 23d | 1 | 1.19mi |
| 235 Vanderbilt Rd Spartanburg, SC | 3.0 | 2.5 | 1300 | $1,844 | $1.42 | 23d | 1 | 1.22mi |
| 458 Arch St Spartanburg, SC | 4.0 | 1.5 | 1380 | $1,325 | $0.96 | 23d | 1 | 1.32mi |
| 249 E Hampton Ave Spartanburg, SC | 3.0 | 2.0 | 1450 | $1,475 | $1.02 | 23d | 1 | 1.45mi |
| 488 Brawley St Unit B Spartanburg, SC | 3.0 | 2.5 | 1200 | $1,300 | $1.08 | 15d | 1 | 1.45mi |
Listing history 17 events
-
2026-05-13status Pending
-
2026-05-08price $185,000
-
2026-04-21price $189,000
-
2026-04-13price $193,000
-
2026-03-06$195,000 Active
-
2025-12-17status Pending
-
2025-12-17historical
-
2025-12-08status Active
-
2025-11-13status Pending
-
2025-10-10price $195,000
-
2025-09-14$200,000 Active
-
2009-01-22historical
-
2008-07-21$70,000
-
2008-07-16historical
-
2007-12-31$70,000
-
1995-10-01soldstatus $36,000
-
1990-07-01soldstatus $19,500
ⓘ Source: listings_history table (triggers on properties + properties_extension) + one-shot
backfill from property_details.listing_events for pre-trigger history.
Tax reassessment forecast SC · Resets to sale price
- Current annual tax
- $2,217 · $185/mo
- Projected year-2 tax
- $2,217 · $185/mo
- Expected delta
- $0/yr ($0/mo · 0.0%)
ⓘ Screening estimate from a state-policy table — verify with the county assessor before closing.
Climate risk First Street
- Flood 1/10 Low FEMA zone X (unshaded) · 0% chance over 30 yrs
- Wildfire 1/10 Low
- Heat 6/10 Major 7 d/yr ≥105°F today · 16 d/yr by 30 yrs out
- Wind 2/10 Low 2% chance of damaging wind over 30 yrs
- Air quality 4/10 Moderate 4 unhealthy d/yr today · 4 by 30 yrs out
Nearby sold comps map
Loading sold comps map…
Walkable amenities ~0.75 mi
Loading nearby amenities…
Taxation est. · year 1
- Rental income
- $18,170
- − Mortgage interest
- −$10,363
- − Property taxes
- −$2,217
- − Insurance
- −$925
- − Repairs & maintenance
- −$1,454
- − Management
- −$1,454
- − Depreciation
- −$5,382
- Taxable loss
- −$3,623
- Est. tax savings @ 24.0%
- +$870
- After-tax cash flow
- $440/yr
For passive investors: Depreciation is non-cash, so a rental often shows a tax loss while cash-flowing — sheltering income. Rental losses are passive: they offset passive income freely, and up to $25,000/yr can offset ordinary (W-2) income if you actively participate and your MAGI is under $100k (phasing out to $0 by $150k); unused losses carry forward. On sale, claimed depreciation is recaptured at up to 25%, and gains may owe capital-gains tax (a 1031 exchange can defer both). Figures are a year-1 estimate at your 24.0% rate — not tax advice; consult a CPA.
Schools (NCES district)
- District
- Spartanburg 07
- NCES district ID
- 4503660
- Math proficiency
- 34% ▼ -1.00%
- Reading proficiency
- 41% ▼ -1.00%
- Median HH income
- $35,825
- Composite
- 31.04/100
- National rank
- #6087
- State rank
- #39 of 80 in SC
Livability — Spartanburg
- Score
- 76/100
- State rank
- #24
- US rank
- #3679
Category grades
Schools grade is shown separately in the Schools card above.
Census & demographics
- Census place
- Spartanburg, SC
- County
- Spartanburg County · 258,607 people
- City population
- 120,406
- Metro
- Spartanburg, SC
- Population (ZIP)
- 16,714
- Household income
- $41,356
- Rent vs Own
- Severe rent burden
- 1064.0
Population outlook (Spartanburg County) Hauer SSP2
- Today (2025)
- 325,495 people
- By 2030
- 338,800 · +4.1%
- By 2040
- 363,471 · +11.7%
- By 2050
- 384,156 · +18.0%
- By 2075
- 430,137 · +32.1%
- By 2100
- 442,733 · +36.0%
Race, ethnicity, and origin ACS 2023
- Neighborhood character
- Diverse neighborhood (Simpson 0.61)
- Race & ethnicity
- Black 50% White 36% Hispanic / Latino 10% Two or more races 9% Asian 1%
- Hispanic origin (detail)
- Mexican 7% Puerto Rican 2%
- Common ancestry
- Slovak 1% Serbian 1% Iranian 1%
- Foreign-born
- 7% · Canada
- Languages at home
- 90% English-only · Spanish 7% Other Indo-European 2%
Political lean MEDSL · Spartanburg
- 2024 margin
- Solid R (+33.6) · D 32.6% · R 66.2% · Other 1.2%
- 2008→2024 swing
- -12.0pp toward R · 2008: -21.6pp · 2024: -33.6pp
- All cycles
- 2024: R+33.6 2020: R+27.3 2016: R+30.0 2012: R+23.1 2008: R+21.6
Not yet ingested
- Civics
- —
Market trends
- HPI YoY
- ▼ -90.67%
- Current HPI
- 213.1266
- Rent YoY
- ▲ 3.46%
- Metro
- Spartanburg, SC
- State GDP YoY
- ▲ 4.51%
- F500 in state
- 2
Industry mix (Fortune 500 HQ in SC)
| Industry | F500 HQs | Revenue |
|---|---|---|
| Packaging | 1 | $7B |
|
||
Price history
+848.7% since first listed17 events — show timeline
- 2026-05-13 Pending — SPMLS
- 2026-05-08 Price Changed $185,000 SPMLS
- 2026-04-21 Price Changed $189,000 SPMLS
- 2026-04-13 Price Changed $193,000 SPMLS
- 2026-03-06 Listed $195,000 SPMLS
- 2025-12-17 Pending — Greater Greenville MLS
- 2025-12-17 Listing Removed — Greater Greenville MLS
- 2025-12-08 Relisted — Greater Greenville MLS
- 2025-11-13 Pending — Greater Greenville MLS
- 2025-10-10 Price Changed $195,000 Greater Greenville MLS
- 2025-09-14 Listed $200,000 Greater Greenville MLS
- 2009-01-22 Listing Removed — Greater Greenville MLS
- 2008-07-21 Listed $70,000 Greater Greenville MLS
- 2008-07-16 Listing Removed — Greater Greenville MLS
- 2007-12-31 Listed $70,000 Greater Greenville MLS
- 1995-10-01 Sold (Public Records) $36,000 Public Records
- 1990-07-01 Sold (Public Records) $19,500 Public Records
Property tax history
+2.2%/yrLatest (2025): $2,217 · +0.6% YoY. Source: county tax records.
Cash-flow waterfall
monthlySold comps — $/sqft
last 12 mo · ≤1 miLoading sold comps…