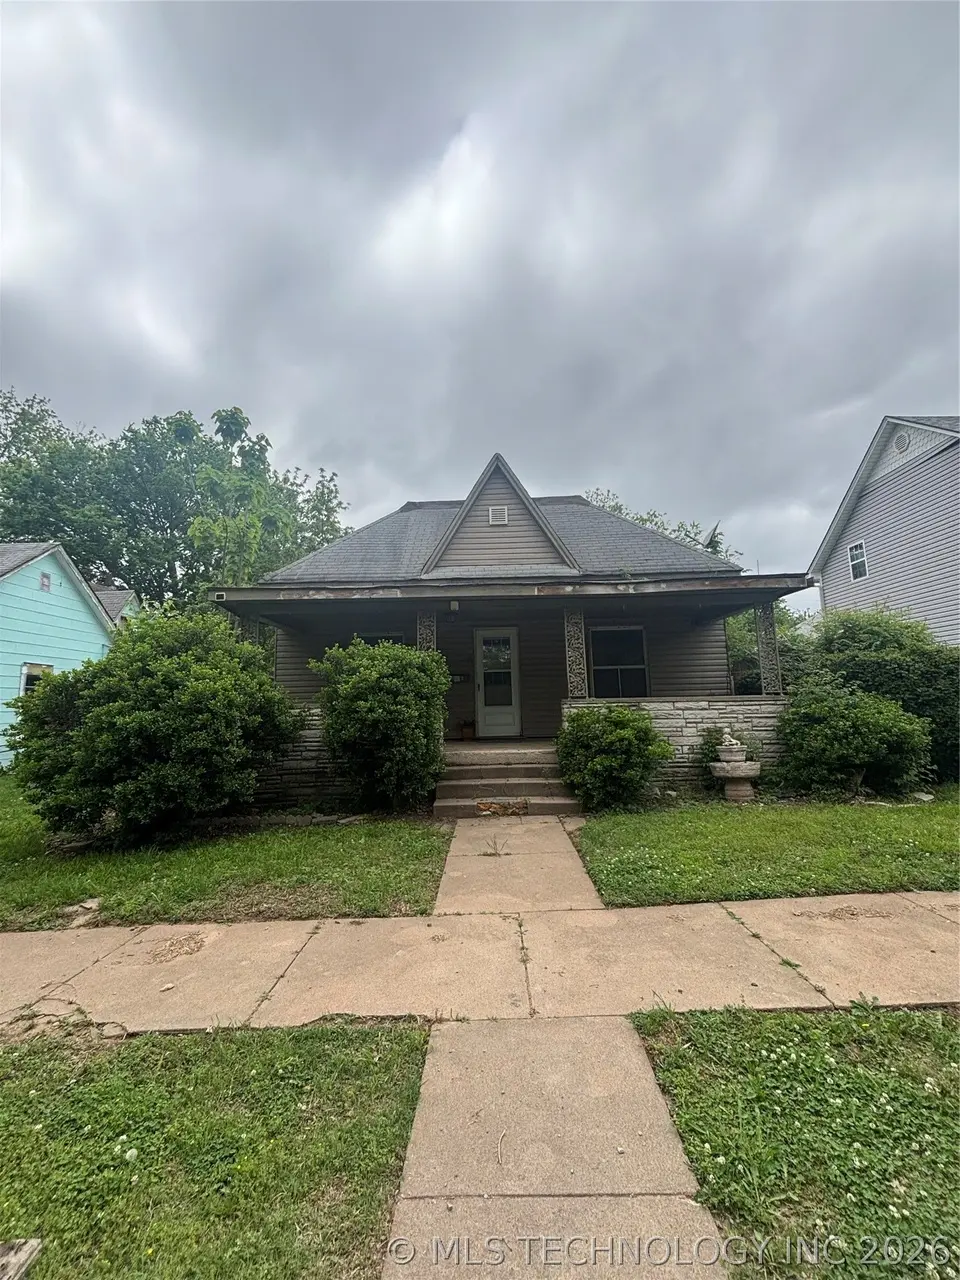
206 N Vine Ave · Cleveland, OK
Flood risk 1/10 · Minimal
- FEMA flood zone
- —
- Chance of flooding over 30 yrs
- 0.0%
- Est. flood insurance / yr
- —
Fire risk 5/10 · Moderate
- Est. fire insurance / yr
- $2,463 – $4,575
Heat risk 6/10 · Moderate
- Hot days now (above 110°F)
- 7 days/yr
- Hot days in 30 yrs
- 20 days/yr
Wind risk 2/10 · Minimal
- Chance of severe wind over 30 yrs
- 4.0%
Air-quality risk 2/10 · Minimal
- Unhealthy air days now
- 0 days/yr
- Unhealthy air days in 30 yrs
- 1 days/yr
Risk factors via First Street. Map © Google.
Why this score? — see what drove the B+ grade
The composite is a weighted blend of 9 inputs, each scored 0–100. Each bar is that input's sub-score; the figure is the points it added to the 100-point composite (weight × sub-score).
- Cash flow +30.0/30.0
- 1% rule +10.0/10.0
- DSCR +10.0/10.0
- Appreciation +10.0/10.0
- ARV discount +7.5/15.0
- Livability +3.4/5.0
- Rent growth +2.5/5.0
- Condition / age +2.5/5.0
- Schools +1.8/10.0
$74,500
🖨 Deal sheet (PDF) 📄 Offer letter ✓ Due diligence
Key facts
- 6,382 sq ft lot
- Garage
- Built 1930
Property features AI
Finance
- Financial info: Pets allowed
- HOA & community: Sidewalks
Exterior
- Parking: Detached garage with 1 garage space; RV access/parking; Boat parking; Garage includes shelves, storage and a workshop
- Security: Storm shelter
- Utilities: Electricity available; Natural gas available; Public water; Public sewer
- Home design: Single-story home; Faces west; Entry level: first floor
- Construction: Concrete foundation (crawlspace and slab); Vinyl siding; Asphalt/fiberglass roof; Year built from public records
- Exterior features: Covered porch; Gravel driveway; Privacy fencing; Storm shelter; Less than 10 miles to water (Keystone Lake nearby)
Interior
- Kitchen: Country-style kitchen; Gas range connection
- Bedrooms: Master bedroom with walk-in closet (first floor); Additional bedroom with walk-in closet (first floor); Two more bedrooms (first floor); All bedrooms on the first floor
- Flooring: Carpet; Vinyl
- Bathrooms: Master full bathroom with shower (first floor); Hall full bathroom with bathtub (first floor)
- Heating & cooling: Central heating (electric); Central air conditioning; Gas water heater
- Interior features: Aluminum window frames; Storm door(s); Accessible doors; High ceilings; Ceiling fan(s); Gas range and oven connections
- Laundry & utility: Washer hookup; Electric dryer hookup; Gas dryer hookup; Utility room inside (first floor)
Neighborhood map
What this means for you Summary
Snapshot
- This is a 3-bed/2.0-bath single-family listed at $74k.
Deal economics
- At list price, monthly cash flow is $870 ($10k/yr) — positive.
- The deal already cash-flows at list — no discount required.
- Meets the 1% rule at list price ($2k rent vs $74k).
- Recommended offer: $72k (3.0% below list) — sets the bar for market timing.
- Cap rate 20.3% vs local median 6.4% in Cleveland — top-decile yield for the area; either an underpriced asset or a hidden risk that comps aren't pricing in. Stress-test before assuming the spread holds.
Location & tenants
- Location reads 67/100 on livability (#93 in OK) — a middle-class / working-renter tenant base. Strengths: cost of living A+, housing A+; Watch: crime C-, employment C-, schools D-.
- Cleveland (town): math 21% / reading 19% proficiency, ranked #169 of 270 in OK (top 63%) — low school quality limits family demand, transient renter base, plan for 1-2y turnover.
- Market conditions: 86 active listings in the ZIP; 3 units permitted in Pawnee County in 2024 (0 in 5+ unit buildings).
Forward outlook
- In year one you build about $8k of equity ($515 loan paydown + $7k appreciation (10.0% local appreciation)).
- Pawnee County population projected to shrink 4% by 2050 — rents likely to lag national; underwrite the cash flow, not the appreciation.
- At projected returns (10.0% appreciation + 3.0% rent growth), your $21k cash investment doubles in ~2 years — after that, you're playing with house money.
- By year 5, paydown + projected appreciation supports a ~$37k cash-out refi (75% LTV) — recoverable capital for the next deal without selling this one.
Negotiation context
- It's been on market 59 days — a 3% lower offer ($72k) is reasonable based on typical stale-listing flexibility.
- 4 sale attempts since 13y ago; this cycle's ask has dropped $13k (15%) from the opening price — seller is motivated, your offer sets the floor, not the list.
Risks & watch-outs
- Watch-outs: built in 1930 — expect roof / HVAC / electrical / plumbing capex.
- Climate carrying-cost: moderate wildfire risk; extreme-heat days projected 7→20/yr by 2055 (HVAC capex compounding) — expect insurance premiums to compound above CPI over the hold.
Questions for the listing agent
- It's been on market 59 days. Have you received any prior offers? Is the seller open to a 3% concession, seller financing, or rate buy-down credit?
- Built in 1930 — when were the roof, HVAC, electrical panel, plumbing, and water heater last replaced?
- Is there a deadline driving the sale (1031 exchange, divorce, estate, relocation)? That informs how much negotiation room exists.
- Schools are D-rated, which usually means shorter tenancies and higher turnover. Who's the typical renter profile here, and what's been the actual vacancy rate?
- What's the average days-on-market for RENTAL listings here right now (not sales)? A rising rental-DOM trend means longer vacancies and softer asking-rent achievability than the comps imply.
- What's the recent tenant-quality profile in this submarket — average credit score on applications, eviction rate, late-payment / NSF rate, and stable-employment percentage? A property-management company in the area should have these aggregated.
- How much new for-sale + rental construction is in the pipeline within 1–3 miles? Heavy new supply typically softens prices + rents 12–24 months out; constrained supply supports both.
Investment metrics
- 1% rule
- 2.28% ✓
- Cap rate
- 20.31%
- Cash-on-cash
- 50.05%
- DSCR
- 3.23
- GRM
- 3.7
CMA / ARV
- ARV (on-the-fly)
- $196,680
- Comps found
- 12
Show comp detail 12 sales within ~0.75 mi
| Address | Dist | Beds/Ba | Sqft | Sold | Price | $/sf | Match |
|---|---|---|---|---|---|---|---|
| 605 E Caddo St | 0.37mi | 4/2.0 (+1) | 1,710 (-4%) | 1mo | $118,000 | $69 | 70 |
| 300 E Miami Ave | 0.15mi | 3/2.0 | 1,704 (-5%) | 20mo | $155,000 | $91 | 68 |
| 200 S Vine Ave | 0.21mi | 4/1.5 (+1) | 1,714 (-4%) | 11mo | $198,000 | $116 | 67 |
| 205 E Cherokee St | 0.20mi | 4/2.0 (+1) | 1,804 (+1%) | 21mo | $60,000 | $33 | 67 |
| 514 W Wichita Ave | 0.58mi | 3/1.5 | 1,824 (+2%) | 7mo | $92,000 | $50 | 62 |
| 711 N Broadway St | 0.41mi | 3/2.0 | 1,901 (+6%) | 12mo | $198,000 | $104 | 60 |
| 309 W Kaw Ave | 0.57mi | 3/2.0 | 1,862 (+4%) | 11mo | $220,000 | $118 | 57 |
| 500 W Delaware St | 0.52mi | 3/2.5 | 1,860 (+4%) | 13mo | $205,000 | $110 | 56 |
| 601 Miami St NW | 0.70mi | 3/2.0 | 1,755 (-2%) | 12mo | $195,000 | $111 | 54 |
| 305 N 7th Ave | 0.67mi | 3/2.0 | 1,560 (-13%) | 3mo | $178,000 | $114 | 45 |
| 604 N D Ave | 0.58mi | 3/2.0 | 1,923 (+8%) | 20mo | $208,500 | $108 | 43 |
| 401 South Dr | 0.66mi | 4/2.5 (+1) | 1,527 (-15%) | 13mo | $210,000 | $138 | 27 |
Match score weights: distance 35% · size 25% · config 20% · recency 20%. Top-matched comps best support the ARV.
Projected returns pro-forma
10.0% appreciation · 3.0% rent growth · sell at horizon
- IRR
- 63.6%
- Equity multiple
- 5.60×
- Total profit
- $95,985
- Equity at exit
- $67,116
- IRR
- 57.2%
- Equity multiple
- 12.46×
- Total profit
- $239,079
- Equity at exit
- $144,737
Cash invested: $20,860 (down + closing). Projections, not guarantees.
Landlord ↔ Tenant lean methodology
- Overall (STATE)
- 83 Strongly Landlord-Friendly
- State Oklahoma
- 83 Strongly Landlord-Friendly · R+20
- County
- — inherits STATE
- City
- — inherits STATE
ZIP-level market 74020
- Home prices YoY
- 6.9%
- Active inventory
- 86
- Price-to-rent
- 3.7×
Monthly cashflow live
- Estimated rent
- $1,695 medium interval (Pro) →
- Mortgage (P&I)
- −$391
- Tax from tax record
- −$47 /mo · $568/yr
- Insurance
- −$31
- HOA
- −$0
- Vacancy / Maint / Mgmt
- −$356
- Net cashflow
- $870
Break-even live
Sensitivity live
| Price | -10% $912 | -5% $891 | +0% $870 | +5% $849 | +10% $828 |
|---|---|---|---|---|---|
| Rent | -10% $736 | -5% $803 | +0% $870 | +5% $937 | +10% $1,004 |
| Rate | -1.0pp $908 | -0.5pp $889 | base $870 | +0.5pp $851 | +1.0pp $831 |
UW: 25.0% down · 7.5% · 30yr · 1.5% tax · 5.0% vac · 8.0% maint · 8.0% mgmt
Financing live
Cash to close
- Down payment
- $18,625
- Closing costs
- $2,235
- Reserves months
- —
- Total cash needed
- —
Loan-product check · same deal, 3 products live
Conventional
25% down · 7.5% · 30yr
- Down + closing
- —
- Monthly P&I
- —
- Monthly cashflow
- —
- DSCR
- —
- Eligible?
- —
Personal DTI + credit; lowest rate.
DSCR
20% down · 8.5% · 30yr
- Down + closing
- —
- Monthly P&I
- —
- Monthly cashflow
- —
- DSCR
- —
- Eligible?
- —
No personal income docs; deal must DSCR.
Hard money
10% down · 12.0% · 12mo
- Down + closing
- —
- Monthly P&I
- —
- Monthly cashflow
- —
- DSCR
- —
- Eligible?
- —
Short-term bridge; refi at stabilization.
Listing history 32 events
-
2026-06-18days on market $74,500 Active 59 DOM
-
2026-06-17days on market $74,500 Active 58 DOM
-
2026-06-16days on market $74,500 Active 57 DOM
-
2026-06-15days on market $74,500 Active 56 DOM
-
2026-06-13days on market $74,500 Active 54 DOM
-
2026-06-10days on market $74,500 Active 51 DOM
-
2026-06-09days on market $74,500 Active 50 DOM
-
2026-06-08days on market $74,500 Active 49 DOM
-
2026-06-07days on market $74,500 Active 48 DOM
-
2026-06-03days on market $74,500 Active 44 DOM
-
2026-06-02days on market $74,500 Active 43 DOM
-
2026-06-01days on market $74,500 Active 42 DOM
-
2026-05-31days on market $74,500 Active 41 DOM
-
2026-04-20$87,500 Active
-
2026-03-10historical
-
2026-03-04price $65,000
-
2025-12-18price $83,000
-
2025-11-20price $87,000
-
2025-11-10price $93,000
-
2025-09-15$100,000 Active
-
2025-09-06historical
-
2025-08-28price $87,500
-
2025-06-27price $92,500
-
2025-04-27price $108,000
-
2025-03-26price $114,500
-
2025-01-25price $119,500
-
2025-01-02price $134,500
-
2024-12-29price $139,500
-
2024-11-04$145,000 Active
-
2013-10-08soldstatus $67,500
-
2013-07-29$79,900
-
1996-08-22soldstatus $18,000
ⓘ Source: listings_history table (triggers on properties + properties_extension) + one-shot
backfill from property_details.listing_events for pre-trigger history.
Tax reassessment forecast OK · Resets to sale price
- Current annual tax
- $568 · $47/mo
- Projected year-2 tax
- $670 · $56/mo
- Expected delta
- +$102/yr (+$9/mo · 18.0%)
ⓘ Screening estimate from a state-policy table — verify with the county assessor before closing.
Climate risk First Street
- Flood 1/10 Low 0% chance over 30 yrs
- Wildfire 5/10 Major
- Heat 6/10 Major 7 d/yr ≥110°F today · 20 d/yr by 30 yrs out
- Wind 2/10 Low 4% chance of damaging wind over 30 yrs
- Air quality 2/10 Low 0 unhealthy d/yr today · 1 by 30 yrs out
Nearby sold comps map
Loading sold comps map…
Walkable amenities ~0.75 mi
Loading nearby amenities…
Taxation est. · year 1
- Rental income
- $20,341
- − Mortgage interest
- −$4,173
- − Property taxes
- −$568
- − Insurance
- −$372
- − Repairs & maintenance
- −$1,627
- − Management
- −$1,627
- − Depreciation
- −$2,167
- Taxable income
- $9,805
- Est. tax owed @ 24.0%
- −$2,353
- After-tax cash flow
- $8,087/yr
For passive investors: Depreciation is non-cash, so a rental often shows a tax loss while cash-flowing — sheltering income. Rental losses are passive: they offset passive income freely, and up to $25,000/yr can offset ordinary (W-2) income if you actively participate and your MAGI is under $100k (phasing out to $0 by $150k); unused losses carry forward. On sale, claimed depreciation is recaptured at up to 25%, and gains may owe capital-gains tax (a 1031 exchange can defer both). Figures are a year-1 estimate at your 24.0% rate — not tax advice; consult a CPA.
Schools (NCES district)
- District
- Cleveland
- NCES district ID
- 4008040
- Math proficiency
- 21% ▼ -6.00%
- Reading proficiency
- 19% ▼ -11.00%
- Median HH income
- $45,642
- Composite
- 17.52/100
- National rank
- #9049
- State rank
- #169 of 270 in OK
Livability — Cleveland
- Score
- 67/100
- State rank
- #93
- US rank
- #10844
Category grades
Schools grade is shown separately in the Schools card above.
Census & demographics
- Census place
- Cleveland, OK
- Population (ZIP)
- 7,365
Population outlook (Pawnee County) Hauer SSP2
- Today (2025)
- 16,219 people
- By 2030
- 16,028 · -1.2%
- By 2040
- 15,724 · -3.1%
- By 2050
- 15,563 · -4.0%
- By 2075
- 15,905 · -1.9%
- By 2100
- 16,058 · -1.0%
Race, ethnicity, and origin ACS 2023
- Neighborhood character
- Predominantly White (77%)
- Race & ethnicity
- White 77% Two or more races 12% Native American 6% Hispanic / Latino 4% Black 1%
- Common ancestry
- Slovak 2% Lithuanian 2% Iranian 1%
- Foreign-born
- 1% · Canada
- Languages at home
- 96% English-only · Spanish 2% Other Asian/Pacific 1%
Political lean MEDSL · Pawnee
- 2024 margin
- Solid R (+58.9) · D 19.7% · R 78.6% · Other 1.7%
- 2008→2024 swing
- -21.4pp toward R · 2008: -37.4pp · 2024: -58.9pp
- All cycles
- 2024: R+58.9 2020: R+57.5 2016: R+53.2 2012: R+40.0 2008: R+37.4
Not yet ingested
- Civics
- —
Market trends
- HPI YoY
- ▲ 14.01%
- Current HPI
- 218.04
- Rent YoY
- —
- Metro
- —
- State GDP YoY
- ▲ 1.55%
- F500 in state
- 6
Industry mix (Fortune 500 HQ in OK)
| Industry | F500 HQs | Revenue |
|---|---|---|
| Energy | 3 | $48B |
|
||
Price history
+386.1% since first listed19 events — show timeline
- 2026-04-20 Listed $87,500 MLS Technology, Inc.
- 2026-03-10 Listing Removed — MLS Technology, Inc.
- 2026-03-04 Price Changed $65,000 MLS Technology, Inc.
- 2025-12-18 Price Changed $83,000 MLS Technology, Inc.
- 2025-11-20 Price Changed $87,000 MLS Technology, Inc.
- 2025-11-10 Price Changed $93,000 MLS Technology, Inc.
- 2025-09-15 Listed $100,000 MLS Technology, Inc.
- 2025-09-06 Listing Removed — MLS Technology, Inc.
- 2025-08-28 Price Changed $87,500 MLS Technology, Inc.
- 2025-06-27 Price Changed $92,500 MLS Technology, Inc.
- 2025-04-27 Price Changed $108,000 MLS Technology, Inc.
- 2025-03-26 Price Changed $114,500 MLS Technology, Inc.
- 2025-01-25 Price Changed $119,500 MLS Technology, Inc.
- 2025-01-02 Price Changed $134,500 MLS Technology, Inc.
- 2024-12-29 Price Changed $139,500 MLS Technology, Inc.
- 2024-11-04 Listed $145,000 MLS Technology, Inc.
- 2013-10-08 Sold (MLS) $67,500 MLS Technology, Inc.
- 2013-07-29 Listed $79,900 MLS Technology, Inc.
- 1996-08-22 Sold (Public Records) $18,000 Public Records
Property tax history
-2.6%/yrLatest (2025): $568 · +1.1% YoY. Source: county tax records.
Cash-flow waterfall
monthlySold comps — $/sqft
last 12 mo · ≤1 miLoading sold comps…