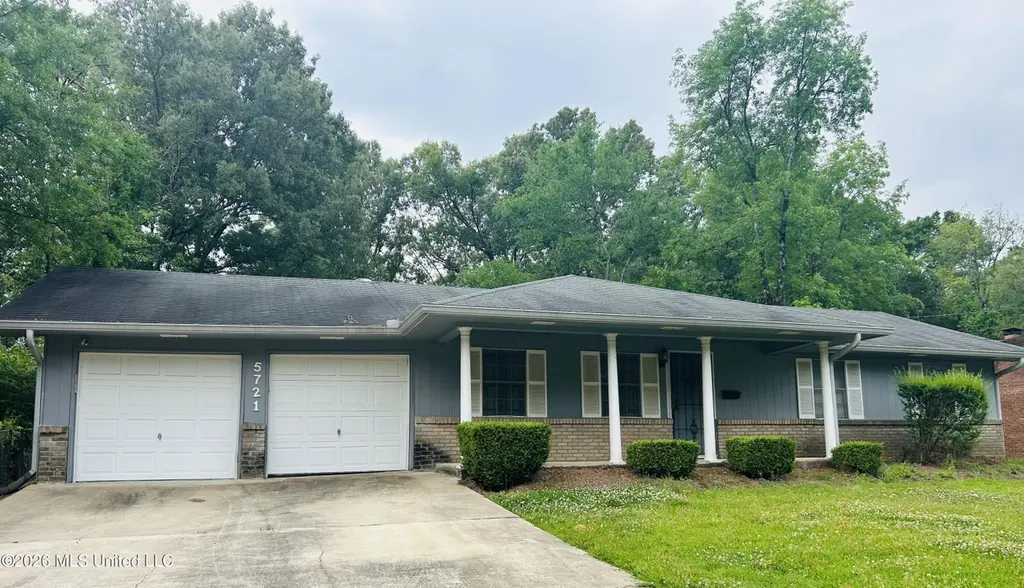
5721 Magnolia Dr · Jackson, MS
Flood risk 1/10 · Minimal
- FEMA flood zone
- X (unshaded)
- Chance of flooding over 30 yrs
- 0.0%
- Est. flood insurance / yr
- $507 – $1,088
Fire risk 3/10 · Minor
- Est. fire insurance / yr
- $1,241 – $2,305
Heat risk 6/10 · Moderate
- Hot days now (above 109°F)
- 7 days/yr
- Hot days in 30 yrs
- 18 days/yr
Wind risk 8/10 · Major
- Chance of severe wind over 30 yrs
- 80.0%
Air-quality risk 1/10 · Minimal
- Unhealthy air days now
- 0 days/yr
- Unhealthy air days in 30 yrs
- 0 days/yr
Risk factors via First Street. Map © Google.
Why this score? — see what drove the B grade
The composite is a weighted blend of 9 inputs, each scored 0–100. Each bar is that input's sub-score; the figure is the points it added to the 100-point composite (weight × sub-score).
- Cash flow +30.0/30.0
- 1% rule +10.0/10.0
- DSCR +10.0/10.0
- Appreciation +10.0/10.0
- Livability +3.4/5.0
- Rent growth +2.5/5.0
- Condition / age +2.5/5.0
- ARV discount +1.9/15.0
- Schools +1.1/10.0
$70,000
🖨 Deal sheet (PDF) 📄 Offer letter ✓ Due diligence
Listing remarks
Welcome to 5721 Magnolia Drive! Perfect blend of comfort and convenience. Enjoy a bright and inviting living area, a nice kitchen and generously sized bedrooms. Step outside to a large backyard perfect for relaxing or hosting gatherings. Just minutes away from the city of Clinton. Conveniently located near shopping, dining, and local amenities. Call your favorite Realtor to schedule your showing today!
Key facts
- Bright living area
- Nice kitchen
- Large backyard
Tags
Property features AI
Finance
- Other: Approximately 0.28 acres lot
Exterior
- Parking: 2-car garage
- Utilities: Public water; Cable available; Electricity available; Phone available; Water available
- Home design: Single-family house; One story; Fixer condition
- Construction: Brick construction; Slab foundation; Built in public-record year (year built from public records)
- Exterior features: Architectural asphalt shingle roof
Interior
- Kitchen: Cooktop; Dishwasher; Microwave
- Flooring: Laminate
- Bathrooms: 2 full bathrooms
- Heating & cooling: Central heating; Central air; Ceiling fans
- Interior features: Storm windows; Laminate flooring
- Laundry & utility: Washer hookup; Electric dryer hookup
Neighborhood map
What this means for you Summary
Snapshot
- This is a 3-bed/2.0-bath single-family listed at $70k.
Deal economics
- At list price, monthly cash flow is $510 ($6k/yr) — positive.
- The deal already cash-flows at list — no discount required.
- Meets the 1% rule at list price ($1k rent vs $70k).
- Recommended offer: $69k (1.5% below list) — sets the bar for market timing.
- Cap rate 15.0% vs local median 9.9% in Jackson — top-decile yield for the area; either an underpriced asset or a hidden risk that comps aren't pricing in. Stress-test before assuming the spread holds.
Location & tenants
- Location reads 68/100 on livability (#66 in MS) — a middle-class / working-renter tenant base. Strengths: commute A+, cost of living A+, housing A+; Watch: amenities F, employment F, health & safety F.
- Jackson Public School District (urban): math 9% / reading 18% proficiency, ranked #112 of 130 in MS (top 86%) — low school quality limits family demand, transient renter base, plan for 1-2y turnover; 88% free/reduced lunch — lower-income household profile, screen leases tightly.
- Zoned schools: John Hopkins Elementary School (math 2% / reading 12%, grade F, #337 of 375 statewide, top 94%, 280 students, 100% FRL); Bailey Middle Apac School (math 46% / reading 62%, grade B-, #18 of 179 statewide, top 10%, 247 students, 100% FRL); Provine High School (math 4% / reading 15%, grade F, #179 of 197 statewide, top 92%, 774 students, 100% FRL).
- Market conditions: 165 active listings in the ZIP; 6 comparable units currently listed for rent nearby; rentals at typical pace (median 23d on market — plan ~3-4 weeks tenant-placement turnaround); lower-income renter base — watch delinquency; 167 units permitted in Hinds County in 2024 (0 in 5+ unit buildings).
- This rent runs 42% of the median local income ($36k/yr) — at the standard rent-burdened threshold; future hikes will face affordability resistance.
Forward outlook
- In year one you build about $7k of equity ($484 loan paydown + $7k appreciation (10.0% local appreciation)).
- Hinds County population projected to shrink 6% by 2050 — rents likely to lag national; underwrite the cash flow, not the appreciation.
- At projected returns (10.0% appreciation + 3.0% rent growth), your $20k cash investment doubles in ~2 years — after that, you're playing with house money.
- By year 5, paydown + projected appreciation supports a ~$35k cash-out refi (75% LTV) — recoverable capital for the next deal without selling this one.
Negotiation context
- It's been on market 21 days — a 2% lower offer ($69k) is reasonable based on typical stale-listing flexibility.
Risks & watch-outs
- Climate carrying-cost: severe wind risk, 80% chance of damaging wind over 30y; extreme-heat days projected 7→18/yr by 2055 (HVAC capex compounding) — expect insurance premiums to compound above CPI over the hold.
Questions for the listing agent
- Built in 1963 — when were the roof, HVAC, electrical panel, plumbing, and water heater last replaced?
- Is there a deadline driving the sale (1031 exchange, divorce, estate, relocation)? That informs how much negotiation room exists.
- Schools are F-rated, which usually means shorter tenancies and higher turnover. Who's the typical renter profile here, and what's been the actual vacancy rate?
- What's the average days-on-market for RENTAL listings here right now (not sales)? A rising rental-DOM trend means longer vacancies and softer asking-rent achievability than the comps imply.
- What's the recent tenant-quality profile in this submarket — average credit score on applications, eviction rate, late-payment / NSF rate, and stable-employment percentage? A property-management company in the area should have these aggregated.
- How much new for-sale + rental construction is in the pipeline within 1–3 miles? Heavy new supply typically softens prices + rents 12–24 months out; constrained supply supports both.
Investment metrics
- 1% rule
- 1.80% ✓
- Cap rate
- 15.03%
- Cash-on-cash
- 31.21%
- DSCR
- 2.39
- GRM
- 4.6
CMA / ARV
- ARV (median comp)
- $62,192
- List price
- $70,000
- Delta
- 12.56%
- Verdict
- OVERPRICED
- Comps
- 20 within 1.0 mi
Show comp detail 12 sales within ~0.75 mi
| Address | Dist | Beds/Ba | Sqft | Sold | Price | $/sf | Match |
|---|---|---|---|---|---|---|---|
| 5717 Wildflower Dr | 0.06mi | 3/2.0 | 1,283 (+2%) | 8mo | $119,000 | $93 | 87 |
| 151 Queen Joanna Ln | 0.23mi | 3/2.0 | 1,248 (-1%) | 6mo | $52,900 | $42 | 83 |
| 135 Queen Anne Ln | 0.35mi | 3/2.0 | 1,248 (-1%) | 5mo | $64,900 | $52 | 78 |
| 344 Queen Margaret Ln | 0.37mi | 3/2.0 | 1,300 (+4%) | 1mo | $74,900 | $58 | 76 |
| 5746 Magnolia Dr | 0.06mi | 3/2.0 | 1,161 (-8%) | 14mo | $105,000 | $90 | 73 |
| 5629 Queen Mary Ln | 0.36mi | 4/2.0 (+1) | 1,272 (+1%) | 6mo | $90,000 | $71 | 71 |
| 237 Queen Anne Ln | 0.31mi | 3/1.5 | 1,300 (+4%) | 8mo | $44,500 | $34 | 71 |
| 131 Queen Joanna Ln | 0.26mi | 3/2.0 | 1,376 (+10%) | 6mo | $68,000 | $49 | 67 |
| 5770 Queen Mary Ln | 0.51mi | 3/1.5 | 1,184 (-6%) | 1mo | $74,900 | $63 | 64 |
| 506 Lowder Dr | 0.54mi | 3/1.5 | 1,318 (+5%) | 4mo | $62,500 | $47 | 61 |
| 5665 Queen Mary Ln | 0.44mi | 3/2.0 | 1,192 (-5%) | 15mo | $67,000 | $56 | 59 |
| 5585 Queen Eleanor Ln | 0.54mi | 3/1.5 | 1,348 (+7%) | 12mo | $95,000 | $70 | 51 |
Match score weights: distance 35% · size 25% · config 20% · recency 20%. Top-matched comps best support the ARV.
Projected returns pro-forma
10.0% appreciation · 3.0% rent growth · sell at horizon
- IRR
- 48.1%
- Equity multiple
- 4.60×
- Total profit
- $70,606
- Equity at exit
- $63,062
- IRR
- 41.9%
- Equity multiple
- 10.31×
- Total profit
- $182,432
- Equity at exit
- $135,995
Cash invested: $19,600 (down + closing). Projections, not guarantees.
Landlord ↔ Tenant lean methodology
- Overall (STATE)
- 90 Strongly Landlord-Friendly
- State Mississippi
- 90 Strongly Landlord-Friendly · R+11
- County
- — inherits STATE
- City
- — inherits STATE
ZIP-level market 39209
- Home prices YoY
- 7.7%
- Active inventory
- 165
- Price-to-rent
- 4.6×
Monthly cashflow live
- Estimated rent
- $1,258 high interval (Pro) →
- Mortgage (P&I)
- −$367
- Tax est. 1.5%
- −$88 /mo · $1,050/yr
- Insurance
- −$29
- HOA
- −$0
- Vacancy / Maint / Mgmt
- −$264
- Net cashflow
- $510
Break-even live
Sensitivity live
| Price | -10% $558 | -5% $534 | +0% $510 | +5% $486 | +10% $461 |
|---|---|---|---|---|---|
| Rent | -10% $410 | -5% $460 | +0% $510 | +5% $559 | +10% $609 |
| Rate | -1.0pp $545 | -0.5pp $528 | base $510 | +0.5pp $492 | +1.0pp $473 |
UW: 25.0% down · 7.5% · 30yr · 1.5% tax · 5.0% vac · 8.0% maint · 8.0% mgmt
Financing live
Cash to close
- Down payment
- $17,500
- Closing costs
- $2,100
- Reserves months
- —
- Total cash needed
- —
Loan-product check · same deal, 3 products live
Conventional
25% down · 7.5% · 30yr
- Down + closing
- —
- Monthly P&I
- —
- Monthly cashflow
- —
- DSCR
- —
- Eligible?
- —
Personal DTI + credit; lowest rate.
DSCR
20% down · 8.5% · 30yr
- Down + closing
- —
- Monthly P&I
- —
- Monthly cashflow
- —
- DSCR
- —
- Eligible?
- —
No personal income docs; deal must DSCR.
Hard money
10% down · 12.0% · 12mo
- Down + closing
- —
- Monthly P&I
- —
- Monthly cashflow
- —
- DSCR
- —
- Eligible?
- —
Short-term bridge; refi at stabilization.
Rent comps 6 comps
| Address | Beds | Baths | Sqft | Rent | $/sqft | DOM | Units | Dist |
|---|---|---|---|---|---|---|---|---|
| 5629 Queen Mary Ln Jackson, MS | 3.0 | 2.0 | 1272 | $1,395 | $1.10 | 16d | 1 | 0.38mi |
| 5301 Queen Mary Ln Jackson, MS | 4.0 | 2.0 | 1100 | $1,338 | $1.22 | 16d | 1 | 0.65mi |
| 127 Barbara Ave Jackson, MS | 3.0 | 1.0 | 1584 | $850 | $0.54 | 23d | 1 | 1.11mi |
| 5501 US-80 Jackson, MS | 2.0 | 2.0 | 1089 | $1,073 | $0.99 | 45d | 1 | 1.42mi |
| 5501 US-80 Jackson, MS | 3.0 | 2.0 | 1349 | $1,231 | $0.91 | 16d | 1 | 1.42mi |
| 5501 US-80 Jackson, MS | 3.0 | 2.0 | 1349 | $1,231 | $0.91 | 46d | 1 | 1.42mi |
Listing history 3 events
-
2026-05-13status Pending 405-char remark
-
2026-04-22$70,000 Active 405-char remark
-
1978-08-14soldstatus
ⓘ Source: listings_history table (triggers on properties + properties_extension) + one-shot
backfill from property_details.listing_events for pre-trigger history.
Climate risk First Street
- Flood 1/10 Low FEMA zone X (unshaded) · 0% chance over 30 yrs
- Wildfire 3/10 Moderate
- Heat 6/10 Major 7 d/yr ≥109°F today · 18 d/yr by 30 yrs out
- Wind 8/10 Severe 80% chance of damaging wind over 30 yrs
- Air quality 1/10 Low 0 unhealthy d/yr today · 0 by 30 yrs out
Nearby sold comps map
Loading sold comps map…
Walkable amenities ~0.75 mi
Loading nearby amenities…
Taxation est. · year 1
- Rental income
- $15,090
- − Mortgage interest
- −$3,921
- − Property taxes
- −$1,050
- − Insurance
- −$350
- − Repairs & maintenance
- −$1,207
- − Management
- −$1,207
- − Depreciation
- −$2,036
- Taxable income
- $5,319
- Est. tax owed @ 24.0%
- −$1,276
- After-tax cash flow
- $4,840/yr
For passive investors: Depreciation is non-cash, so a rental often shows a tax loss while cash-flowing — sheltering income. Rental losses are passive: they offset passive income freely, and up to $25,000/yr can offset ordinary (W-2) income if you actively participate and your MAGI is under $100k (phasing out to $0 by $150k); unused losses carry forward. On sale, claimed depreciation is recaptured at up to 25%, and gains may owe capital-gains tax (a 1031 exchange can defer both). Figures are a year-1 estimate at your 24.0% rate — not tax advice; consult a CPA.
Schools (NCES district)
- District
- Jackson Public School District
- NCES district ID
- 2802190
- Math proficiency
- 9% ▼ -14.00%
- Reading proficiency
- 18% ▼ -7.00%
- Median HH income
- $33,234
- Composite
- 10.89/100
- National rank
- #9755
- State rank
- #112 of 130 in MS
Livability — Jackson
- Score
- 68/100
- State rank
- #66
- US rank
- #9695
Category grades
Schools grade is shown separately in the Schools card above.
Census & demographics
- Census place
- Jackson, MS
- County
- Hinds County · 167,040 people
- City population
- 140,204
- Metro
- Jackson, MS
- Population (ZIP)
- 25,776
- Household income
- $36,344
- Rent vs Own
- Severe rent burden
- 1627.0
Population outlook (Hinds County) Hauer SSP2
- Today (2025)
- 242,528 people
- By 2030
- 241,113 · -0.6%
- By 2040
- 235,557 · -2.9%
- By 2050
- 226,946 · -6.4%
- By 2075
- 199,995 · -17.5%
- By 2100
- 164,165 · -32.3%
Race, ethnicity, and origin ACS 2023
- Neighborhood character
- Predominantly Black (90%)
- Race & ethnicity
- Black 90% White 7% Two or more races 2% Hispanic / Latino 1%
- Foreign-born
- 1% · Canada
- Languages at home
- 98% English-only · Spanish 2%
Political lean MEDSL · Hinds
- 2024 margin
- Solid D (+46.1) · D 72.4% · R 26.3% · Other 1.4%
- 2008→2024 swing
- +7.1pp toward D · 2008: 39.0pp · 2024: 46.1pp
- All cycles
- 2024: D+46.1 2020: D+48.3 2016: D+43.7 2012: D+45.1 2008: D+39.0
Not yet ingested
- Civics
- —
Market trends
- HPI YoY
- ▲ 22.28%
- Current HPI
- 312.6754
- Rent YoY
- —
- Metro
- Jackson, MS
- State GDP YoY
- —
- F500 in state
- 0
Price history
4 events — show timeline
- 2026-06-09 Sold (MLS) — MLSU
- 2026-05-13 Pending — MLSU
- 2026-04-22 Listed $70,000 MLSU
- 1978-08-14 Sold (Public Records) — Public Records
Cash-flow waterfall
monthlySold comps — $/sqft
last 12 mo · ≤1 miLoading sold comps…