 🌊 Lakefront
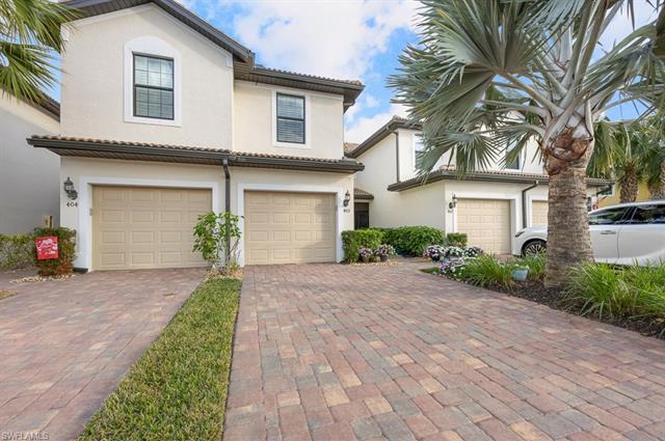
5698 Mayflower Way #403 · Ave Maria, FL
Flood risk 1/10 · Minimal
- FEMA flood zone
- X (unshaded)
- Chance of flooding over 30 yrs
- 0.0%
- Est. flood insurance / yr
- $507 – $1,088
Fire risk 5/10 · Moderate
- Est. fire insurance / yr
- $947 – $1,759
Heat risk 10/10 · Severe
- Hot days now (above 111°F)
- 7 days/yr
- Hot days in 30 yrs
- 28 days/yr
Wind risk 10/10 · Severe
- Chance of severe wind over 30 yrs
- 99.0%
Air-quality risk 2/10 · Minimal
- Unhealthy air days now
- 0 days/yr
- Unhealthy air days in 30 yrs
- 1 days/yr
Risk factors via First Street. Map © Google.
Why this score? — see what drove the C grade
The composite is a weighted blend of 9 inputs, each scored 0–100. Each bar is that input's sub-score; the figure is the points it added to the 100-point composite (weight × sub-score).
- Cash flow +16.9/30.0
- 1% rule +8.6/10.0
- ARV discount +7.5/15.0
- DSCR +5.2/10.0
- Schools +5.0/10.0
- Appreciation +4.5/10.0
- Rent growth +3.2/5.0
- Livability +2.5/5.0
- Condition / age +2.5/5.0
$264,900
🖨 Deal sheet 📄 Offer letter ✓ Due diligence
Listing remarks
A SUPER-GREAT VALUE here at this 55+ Active LifeStyle Community Condominium --TASTEFULLY DECORATED>> GOLF COURSE & WATER VIEWS! - (RARELY AVAILABLE---> GUEST BATHROOM HAS A TUB/SHOWER Combo) FURNISHED TURNKEY! - 1st Floor HERON Model Carriage Home; AS-IS, Move-In Ready! Water, Cable TV & High Speed Internet INCLUDED in Condo fees! Features 3 Bedrooms, 2 Full Bathrooms, Accordian Style Hurricane Shutters Providing Maximum Storm Protection. Screened Lanai w/ Fabric Roll Down Protection, Tiled in Main Areas, Luxury Vinyl Tile in Bedrooms, Plantation Shutters, Breakfast Nook. Screened Entry w/ added Glass Insert in Front Door. East Exposure Provides Premium Year Round Sunr
Key facts
- Water views
- Plantation shutters
- Screened lanai
Tags
Property features AI
Finance
- Other: Complex has 24 units; building has 8 units; single unit per floor; one floor in building
- Financial info: Total annual recurring fees $9,672; Total one-time fees $1,795; One-time special assessment fee $1,250
- HOA & community: Mandatory HOA; Quarterly master HOA fee $203; Quarterly HOA fee $859.80; Quarterly condo fee $1,355; Professional management; Maintenance covers cable, insurance, internet/WiFi, lawn/land maintenance, legal/accounting, manager, exterior pest control, and reserves; Community amenities include clubhouse, community pool, golf course, bike and jog paths, pickleball, dog park, business center, restaurant, shopping, billiards, beauty salon, community park, streetlights
Exterior
- Parking: Attached 1-car garage; Paved driveway
- Security: Gated community; Entry keypad
- Utilities: Central water (assessment unpaid); Central sewer (assessment unpaid); Cable available
- Home design: Residential property; Low-rise building (1-3 stories); Carriage/Coach style; Built in 2018; Rear exposure facing east; Located in a gated, golf-course community (Ave Maria / Del Webb)
- Construction: Concrete block construction
- Exterior features: Tile roof; Stone exterior finish; Impact resistant windows; Single-hung windows; Shutters (screens/fabric); Automatic sprinkler system (central); Freshwater lake frontage; Golf course and lake views; Cul-de-sac lot; Paved road access
Interior
- Kitchen: Dishwasher; Disposal; Microwave; Refrigerator/ice maker; Self-cleaning oven; Pantry; Eat-in kitchen
- Bedrooms: 3 bedrooms; Master bedroom on ground level
- Flooring: Laminate; Tile
- Bathrooms: 2 full bathrooms; Master bath with dual sinks and shower (no tub)
- Heating & cooling: Central electric heat; Central electric cooling; Ceiling fans
- Interior features: French doors; High-speed internet available; Smoke detectors; Turnkey furnished; Screened lanai/porch; Eat-in kitchen; Pantry; Approximately 1457 living area; Four ceiling fans
- Laundry & utility: Washer and dryer in residence; Auto garage door
Neighborhood map
What this means for you Summary
Snapshot
- This is a 3-bed/2.0-bath condo listed at $265k.
Deal economics
- At list price, monthly cash flow is $173 ($2k/yr) — positive.
- The deal already cash-flows at list — no discount required.
- Meets the 1% rule at list price ($4k rent vs $265k).
- Recommended offer: $233k (12.0% below list) — sets the bar for market timing.
Location & tenants
- Location reads: area grade C — affects rentability + tenant quality, not the cash-flow math above.
- Collier (suburban): math 60% / reading 56% proficiency, ranked #16 of 73 in FL (top 22%) — acceptable for families but not a draw, mixed tenant base, ~2y average lease.
- Zoned schools: Estates Elementary School (math 70% / reading 67%, grade B+, #409 of 2,144 statewide, top 20%, 862 students, 53% FRL); Palmetto Ridge High School (math 43% / reading 51%, grade D-, #207 of 667 statewide, top 32%, 2,347 students, 38% FRL).
- Market conditions: Rents rising (+3.0%/yr); 449 active listings in the ZIP; 40 comparable units currently listed for rent nearby; rentals at typical pace (median 23d on market — plan ~3-4 weeks tenant-placement turnaround); 3,520 units permitted in Collier County in 2024 (959 in 5+ unit buildings).
- At $3,604/mo this rent would consume 69% of the median local household income ($62k/yr) (locally 1093% of renters already pay >50% of income on rent) — very limited rent-growth headroom before tenants either downsize or default.
Forward outlook
- Local home prices are declining (-1.1%/yr); year-one equity from $2k of loan paydown is wiped out by about $3k of value loss. Plan a longer hold.
- Collier County population projected at +30% by 2050 — long-run rental-demand tailwind backs the buy-and-hold thesis.
Negotiation context
- It's been on market 161 days — a 12% lower offer ($233k) is reasonable based on typical stale-listing flexibility.
- 5 sale attempts since 7y ago; this cycle's ask has dropped $50k (16%) from the opening price — seller is motivated, your offer sets the floor, not the list.
- Current owner paid $187k; 42% above their basis — modest negotiation headroom, anchor on the comps not their cost.
Risks & watch-outs
- Watch-outs: HOA is 22% of rent.
- Climate carrying-cost: severe wind risk, 99% chance of damaging wind over 30y; moderate wildfire risk; extreme-heat days projected 7→28/yr by 2055 (HVAC capex compounding) — expect insurance premiums to compound above CPI over the hold.
Questions for the listing agent
- It's been on market 161 days. Have you received any prior offers? Is the seller open to a 12% concession, seller financing, or rate buy-down credit?
- What does the HOA fee cover, when was the last increase, and are there any pending special assessments or reserve-fund shortfalls?
- Any open or pending special assessments — roof, HVAC, plumbing, elevator, façade? What's the per-unit balance and payoff schedule, and is the seller paying it off at close or rolling it to the buyer?
- Why hasn't it sold? Are there any deal-killer items the seller is aware of (foundation, flood, title, zoning, code violations)?
- Is there a deadline driving the sale (1031 exchange, divorce, estate, relocation)? That informs how much negotiation room exists.
- This sits on a lake — are riparian / water-frontage rights deeded with the parcel? Any dock permits, shoreline easements, or HOA water-use restrictions?
- What's the documented flood / surge / shoreline-erosion history here (FEMA AND non-FEMA — e.g., storm surge, creek backup, septic-field saturation)?
- Any water-quality or seasonal algae-bloom issues that affect tenant satisfaction or short-term-rental demand?
- What's the average days-on-market for RENTAL listings here right now (not sales)? A rising rental-DOM trend means longer vacancies and softer asking-rent achievability than the comps imply.
- What's the recent tenant-quality profile in this submarket — average credit score on applications, eviction rate, late-payment / NSF rate, and stable-employment percentage? A property-management company in the area should have these aggregated.
- How much new apartment / multifamily construction is in the pipeline within 1–3 miles? Heavy new supply (>2% of stock underway) typically softens rents 12–24 months out; light construction supports rent growth.
Investment metrics
- 1% rule
- 1.36% ✓
- Cap rate
- 7.07%
- Cash-on-cash
- 2.79%
- DSCR
- 1.12
- GRM
- 6.1
CMA / ARV
No comps found within radius.
Projected returns pro-forma
-1.05% appreciation · 2.95% rent growth · sell at horizon
- IRR
- -2.8%
- Equity multiple
- 0.88×
- Total profit
- $-9,141
- Equity at exit
- $63,331
- IRR
- 4.1%
- Equity multiple
- 1.39×
- Total profit
- $28,760
- Equity at exit
- $65,981
Cash invested: $74,172 (down + closing). Projections, not guarantees.
Landlord ↔ Tenant lean methodology
- Overall (STATE)
- 87 Strongly Landlord-Friendly
- State Florida
- 87 Strongly Landlord-Friendly · R+3
- County
- — inherits STATE
- City
- — inherits STATE
ZIP-level market 34142
- Home prices YoY
- -0.5%
- Rents YoY
- 3.0%
- Active inventory
- 449
- Price-to-rent
- 6.1×
Monthly cashflow live
- Estimated rent
- $3,604 high interval (Pro) →
- Mortgage (P&I)
- −$1,389
- Tax from tax record
- −$369 /mo · $4,433/yr
- Insurance
- −$110
- HOA
- −$806
- Vacancy / Maint / Mgmt
- −$757
- Net cashflow
- $173
Break-even live
UW: 25.0% down · 7.5% · 30yr · 1.5% tax · 5.0% vac · 8.0% maint · 8.0% mgmt
Financing live
Cash to close
- Down payment
- $66,225
- Closing costs
- $7,947
- Reserves months
- —
- Total cash needed
- —
Loan-product check · same deal, 3 products live
Conventional
25% down · 7.5% · 30yr
- Down + closing
- —
- Monthly P&I
- —
- Monthly cashflow
- —
- DSCR
- —
- Eligible?
- —
Personal DTI + credit; lowest rate.
DSCR
20% down · 8.5% · 30yr
- Down + closing
- —
- Monthly P&I
- —
- Monthly cashflow
- —
- DSCR
- —
- Eligible?
- —
No personal income docs; deal must DSCR.
Hard money
10% down · 12.0% · 12mo
- Down + closing
- —
- Monthly P&I
- —
- Monthly cashflow
- —
- DSCR
- —
- Eligible?
- —
Short-term bridge; refi at stabilization.
Rent comps 40 comps
| Address | Beds | Baths | Sqft | Rent | $/sqft | DOM | Units | Dist |
|---|---|---|---|---|---|---|---|---|
| 5697 Mayflower Way Ave Maria, FL | 2.0 | 2.0 | 1538 | $2,495 | $1.62 | 23d | 1 | 0.05mi |
| 5705 Mayflower Way #1407 Ave Maria, FL | 2.0 | 2.0 | 1536 | $2,250 | $1.46 | 23d | 1 | 0.06mi |
| 5690 Mayflower Way #601 Ave Maria, FL | 3.0 | 2.0 | 1815 | $5,500 | $3.03 | 23d | 1 | 0.07mi |
| 5690 Mayflower Way Ave Maria, FL | 3.0 | 2.0 | 1815 | $3,295 | $1.82 | 23d | 1 | 0.07mi |
| 5769 Mayflower Way Ave Maria, FL | 2.0 | 2.0 | 1554 | $4,000 | $2.57 | 23d | 1 | 0.19mi |
| 5935 Mayflower Way Ave Maria, FL | 2.0 | 2.0 | 1460 | $2,550 | $1.75 | 23d | 1 | 0.45mi |
| 5988 Mayflower Way Ave Maria, FL | 2.0 | 2.0 | 1602 | $5,200 | $3.25 | 23d | 1 | 0.49mi |
| 5360 Brin Way Ave Maria, FL | 4.0 | 2.5 | 1088 | $2,495 | $2.29 | 23d | 1 | 0.57mi |
| 5538 Useppa Dr Ave Maria, FL | 2.0 | 2.5 | 1850 | $10,995 | $5.94 | 23d | 1 | 0.68mi |
| 5435 Pikewood Ct Ave Maria, FL | 2.0 | 2.5 | 1850 | $3,695 | $2.00 | 21d | 1 | 0.77mi |
| 6168 Harmony Dr Immokalee, FL | 3.0 | 2.0 | 1570 | $5,495 | $3.50 | 13d | 1 | 0.88mi |
| 8010 Helena Ct Ave Maria, FL | 2.0 | 2.0 | 1554 | $2,500 | $1.61 | 21d | 1 | 0.90mi |
| 6441 Liberty St Ave Maria, FL | 3.0 | 2.0 | 1685 | $5,795 | $3.44 | 23d | 1 | 0.90mi |
| 6189 Harmony Dr Immokalee, FL | 3.0 | 2.0 | 1558 | $6,295 | $4.04 | 23d | 1 | 0.93mi |
| 6205 Harmony Dr Immokalee, FL | 3.0 | 2.0 | 1558 | $5,000 | $3.21 | 23d | 1 | 0.96mi |
| 5574 Cassidy Ln Ave Maria, FL | 3.0 | 2.0 | 1630 | $2,250 | $1.38 | 21d | 1 | 0.97mi |
| 5478 Double Eagle Cir #3521 Ave Maria, FL | 2.0 | 2.0 | 1569 | $4,995 | $3.18 | 23d | 1 | 1.02mi |
| 5639 Argento Dr Ave Maria, FL | 3.0 | 2.5 | 1400 | $2,500 | $1.79 | 23d | 1 | 1.04mi |
| 5454 Double Eagle Cir #3325 Ave Maria, FL | 2.0 | 2.0 | 1355 | $2,495 | $1.84 | 23d | 1 | 1.05mi |
| 5688 Cassidy Ln Ave Maria, FL | 2.0 | 2.0 | 1366 | $2,500 | $1.83 | 13d | 1 | 1.05mi |
| 5466 Double Eagle Cir #3425 Ave Maria, FL | 2.0 | 2.0 | 1355 | $5,995 | $4.42 | 23d | 1 | 1.05mi |
| 5629 Double Eagle Cir #4223 Ave Maria, FL | 2.0 | 2.0 | 1154 | $2,395 | $2.08 | 23d | 1 | 1.06mi |
| 6039 Ellerston WAY #2017 Ave Maria, FL | 2.0 | 2.0 | 1355 | $6,295 | $4.65 | 23d | 1 | 1.06mi |
| 5710 Melbourne Ct #6511 Ave Maria, FL | 3.0 | 2.0 | 1741 | $7,295 | $4.19 | 23d | 1 | 1.06mi |
| 5651 Double Eagle Cir #4316 Ave Maria, FL | 2.0 | 2.0 | 1154 | $5,495 | $4.76 | 23d | 1 | 1.06mi |
| 5651 Double Eagle Cir #4338 Ave Maria, FL | 2.0 | 2.0 | 1301 | $6,295 | $4.84 | 23d | 1 | 1.06mi |
| 5629 Double Eagle Cir #4217 Ave Maria, FL | 2.0 | 2.0 | 1154 | $5,795 | $5.02 | 23d | 1 | 1.06mi |
| 5445 Double Eagle Cir #3011 Ave Maria, FL | 2.0 | 2.0 | 1569 | $2,495 | $1.59 | 23d | 1 | 1.06mi |
| 5835 Double Eagle Cir #4726 Ave Maria, FL | 2.0 | 2.0 | 1154 | $2,095 | $1.82 | 13d | 1 | 1.06mi |
| 5715 Double Eagle Cir #4416 Ave Maria, FL | 2.0 | 2.0 | 1154 | $2,100 | $1.82 | 23d | 1 | 1.06mi |
| 5704 Melbourne Ct #6712 Ave Maria, FL | 3.0 | 2.0 | 1741 | $7,295 | $4.19 | 23d | 1 | 1.06mi |
| 6036 Ellerston WAY #1311 Ave Maria, FL | 3.0 | 2.0 | 1741 | $4,490 | $2.58 | 23d | 1 | 1.06mi |
| 5629 Double Eagle Cir #4218 Ave Maria, FL | 3.0 | 2.0 | 1301 | $6,295 | $4.84 | 23d | 1 | 1.06mi |
| 5835 Double Eagle CIR #4714 Ave Maria, FL | 2.0 | 2.0 | 1120 | $1,895 | $1.69 | 23d | 1 | 1.06mi |
| 5909 Berwick Ln Ave Maria, FL | 2.0 | 2.0 | 1850 | $10,995 | $5.94 | 23d | 1 | 1.08mi |
| 5479 Double Eagle Cir #3626 Ave Maria, FL | 2.0 | 2.0 | 1154 | $2,200 | $1.91 | 13d | 1 | 1.09mi |
| 5433 Double Eagle Cir Ave Maria, FL | 2.0 | 2.0 | 1366 | $3,295 | $2.41 | 23d | 1 | 1.11mi |
| 5433 Double Eagle Cir #2915 Ave Maria, FL | 2.0 | 2.0 | 1366 | $6,295 | $4.61 | 21d | 1 | 1.11mi |
| 5478 Double Eagle Cir #3515 Ave Maria, FL | 2.0 | 2.0 | 1355 | $2,395 | $1.77 | 23d | 1 | 1.12mi |
| 5491 Double Eagle Cir #3728 Ave Maria, FL | 3.0 | 2.0 | 1301 | $2,195 | $1.69 | 13d | 1 | 1.12mi |
HOA detail condo
- Monthly dues
- $806 · $9,672/yr
- Likely covers
- waterinternetcable
- Assessments
- None detected in remarks — confirm with the listing agent.
Listing history 37 events
-
2026-06-18days on market $264,900 Active 161 DOM
-
2026-06-17days on market $264,900 Active 160 DOM
-
2026-06-16days on market $264,900 Active 159 DOM
-
2026-06-15days on market $264,900 Active 158 DOM
-
2026-06-14days on market $264,900 Active 156 DOM
-
2026-06-10days on market $264,900 Active 153 DOM
-
2026-06-09days on market $264,900 Active 152 DOM
-
2026-06-09price $264,900 Active 151 DOM
-
2026-06-08days on market $284,900 Active 151 DOM
-
2026-06-07days on market $284,900 Active 150 DOM
-
2026-06-03days on market $284,900 Active 146 DOM
-
2026-06-02days on market $284,900 Active 145 DOM
-
2026-06-01days on market $284,900 Active 144 DOM
-
2026-05-31days on market $284,900 Active 143 DOM
-
2026-05-30days on market $284,900 Active 142 DOM
-
2026-03-29price $284,900
-
2026-02-23price $294,900
-
2026-01-08$314,900 Active
-
2025-09-30historical
-
2025-09-05price $299,899
-
2025-04-18price $299,900
-
2025-03-10price $312,900
-
2025-01-30price $314,900
-
2024-11-30$324,500 Active
-
2024-09-30historical
-
2024-09-30historical
-
2024-06-13price $324,500
-
2024-06-13price $324,500
-
2024-04-02price $343,500
-
2024-04-02price $343,500
-
2024-03-14price $353,900
-
2024-03-12price $353,900
-
2024-02-15$359,900 Active
-
2024-02-15$359,900 Active
-
2019-08-19soldstatus $187,000 Sold
-
2019-07-12status Pending
-
2019-02-07$194,114 Active
ⓘ Source: listings_history table (triggers on properties + properties_extension) + one-shot
backfill from property_details.listing_events for pre-trigger history.
Tax reassessment forecast FL · Resets to sale price
- Current annual tax
- $4,433 · $369/mo
- Projected year-2 tax
- $4,433 · $369/mo
- Expected delta
- $0/yr ($0/mo · 0.0%)
ⓘ Screening estimate from a state-policy table — verify with the county assessor before closing.
Climate risk First Street
- Flood 1/10 Low FEMA zone X (unshaded) · 0% chance over 30 yrs
- Wildfire 5/10 Major
- Heat 10/10 Extreme 7 d/yr ≥111°F today · 28 d/yr by 30 yrs out
- Wind 10/10 Extreme 99% chance of damaging wind over 30 yrs
- Air quality 2/10 Low 0 unhealthy d/yr today · 1 by 30 yrs out
Nearby sold comps map
Loading sold comps map…
Walkable amenities ~0.75 mi
Loading nearby amenities…
Taxation est. · year 1
- Rental income
- $43,253
- − Mortgage interest
- −$14,839
- − Property taxes
- −$4,433
- − Insurance
- −$1,324
- − Repairs & maintenance
- −$3,460
- − Management
- −$3,460
- − HOA
- −$9,672
- − Depreciation
- −$7,706
- Taxable loss
- −$1,642
- Est. tax savings @ 24.0%
- +$394
- After-tax cash flow
- $2,464/yr
For passive investors: Depreciation is non-cash, so a rental often shows a tax loss while cash-flowing — sheltering income. Rental losses are passive: they offset passive income freely, and up to $25,000/yr can offset ordinary (W-2) income if you actively participate and your MAGI is under $100k (phasing out to $0 by $150k); unused losses carry forward. On sale, claimed depreciation is recaptured at up to 25%, and gains may owe capital-gains tax (a 1031 exchange can defer both). Figures are a year-1 estimate at your 24.0% rate — not tax advice; consult a CPA.
Schools (NCES district)
- District
- Collier
- NCES district ID
- 1200330
- Math proficiency
- 60% ▼ -4.00%
- Reading proficiency
- 56% ▼ -2.00%
- Median HH income
- $58,275
- Composite
- 50.23/100
- National rank
- #1892
- State rank
- #16 of 73 in FL
Livability — Ave Maria
No livability data for this city. (Only ~50 U.S. cities are tracked.)
Census & demographics
- Census place
- Ave Maria, FL
- County
- Collier County · 396,295 people
- Metro
- Naples-Marco Island, FL
- Population (ZIP)
- 35,149
- Household income
- $62,333
- Rent vs Own
- Severe rent burden
- 1093.0
Population outlook (Collier County) Hauer SSP2
- Today (2025)
- 420,858 people
- By 2030
- 450,054 · +6.9%
- By 2040
- 502,232 · +19.3%
- By 2050
- 544,932 · +29.5%
- By 2075
- 627,203 · +49.0%
- By 2100
- 659,015 · +56.6%
Race, ethnicity, and origin ACS 2023
- Neighborhood character
- Majority Hispanic (63%)
- Race & ethnicity
- Hispanic / Latino 63% Two or more races 39% Black 19% White 16% Native American 7%
- Hispanic origin (detail)
- Mexican 43% Puerto Rican 3% Cuban 2% Dominican 1%
- Common ancestry
- Hispanic 8% Slovak 1% Serbian 1%
- Foreign-born
- 32% · Canada, Jamaica
- Languages at home
- 34% English-only · Spanish 53% French/Haitian/Cajun 12%
Political lean MEDSL · Collier
- 2024 margin
- Solid R (+33.1) · D 33.1% · R 66.2%
- 2008→2024 swing
- -10.6pp toward R · 2008: -22.5pp · 2024: -33.1pp
- All cycles
- 2024: R+33.1 2020: R+24.7 2016: R+26.0 2012: R+30.1 2008: R+22.5
Not yet ingested
- Civics
- —
Market trends
- HPI YoY
- ▼ -1.05%
- Current HPI
- 226.9105
- Rent YoY
- ▲ 2.95%
- Metro
- Naples-Marco Island, FL
- State GDP YoY
- ▲ 3.28%
- F500 in state
- 36
Industry mix (Fortune 500 HQ in FL)
| Industry | F500 HQs | Revenue |
|---|---|---|
| Industrial Technology | 2 | $29B |
|
||
| Insurance | 2 | $17B |
|
||
| Retail | 1 | $60B |
|
||
| Technology Distribution | 1 | $58B |
|
||
| Homebuilding | 1 | $35B |
|
||
| Technology Manufacturing | 1 | $35B |
|
||
Price history
+46.8% since first listed22 events — show timeline
- 2026-03-29 Price Changed $284,900 NAPLESMLS
- 2026-02-23 Price Changed $294,900 NAPLESMLS
- 2026-01-08 Listed $314,900 NAPLESMLS
- 2025-09-30 Listing Removed — NAPLESMLS
- 2025-09-05 Price Changed $299,899 NAPLESMLS
- 2025-04-18 Price Changed $299,900 NAPLESMLS
- 2025-03-10 Price Changed $312,900 NAPLESMLS
- 2025-01-30 Price Changed $314,900 NAPLESMLS
- 2024-11-30 Listed $324,500 NAPLESMLS
- 2024-09-30 Listing Removed — NAPLESMLS
- 2024-09-30 Listing Removed — MARMLS
- 2024-06-13 Price Changed $324,500 NAPLESMLS
- 2024-06-13 Price Changed $324,500 MARMLS
- 2024-04-02 Price Changed $343,500 NAPLESMLS
- 2024-04-02 Price Changed $343,500 MARMLS
- 2024-03-14 Price Changed $353,900 MARMLS
- 2024-03-12 Price Changed $353,900 NAPLESMLS
- 2024-02-15 Listed $359,900 NAPLESMLS
- 2024-02-15 Listed $359,900 MARMLS
- 2019-08-19 Sold (MLS) $187,000 FORTMLS
- 2019-07-12 Pending — FORTMLS
- 2019-02-07 Listed $194,114 FORTMLS
Property tax history
+5.1%/yrLatest (2025): $4,433 · +8.5% YoY. Source: county tax records.
Cash-flow waterfall
monthlySold comps — $/sqft
last 12 mo · ≤1 miLoading sold comps…