4117 North Bend Rd #3 · Cheviot, OH
Flood risk 1/10 · Minimal
- FEMA flood zone
- X (unshaded)
- Chance of flooding over 30 yrs
- 0.0%
- Est. flood insurance / yr
- $507 – $1,088
Fire risk 1/10 · Minimal
- Est. fire insurance / yr
- $713 – $1,323
Heat risk 4/10 · Minor
- Hot days now (above 102°F)
- 7 days/yr
- Hot days in 30 yrs
- 19 days/yr
Wind risk 2/10 · Minimal
- Chance of severe wind over 30 yrs
- 1.0%
Air-quality risk 2/10 · Minimal
- Unhealthy air days now
- 1 days/yr
- Unhealthy air days in 30 yrs
- 1 days/yr
Risk factors via First Street. Map © Google.
Why this score? — see what drove the C- grade
The composite is a weighted blend of 9 inputs, each scored 0–100. Each bar is that input's sub-score; the figure is the points it added to the 100-point composite (weight × sub-score).
- Cash flow +18.7/30.0
- 1% rule +10.0/10.0
- ARV discount +7.5/15.0
- DSCR +5.9/10.0
- Livability +3.9/5.0
- Rent growth +3.4/5.0
- Schools +2.5/10.0
- Condition / age +2.5/5.0
- Appreciation +0.0/10.0
$65,000
🖨 Deal sheet 📄 Offer letter ✓ Due diligence
Listing remarks MLS
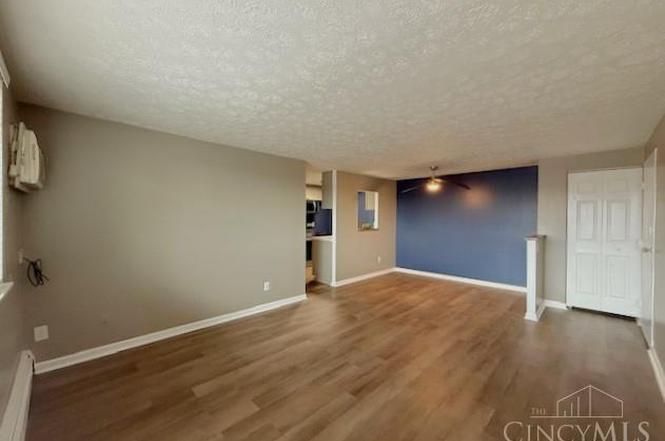
2 Bed, 1 Bath condo. Currently being rented for $700 a month. Tenant occupied. 24 hour notice. Cash offer only.
Key facts
- Fully remodeled
- Extra storage
- Walk in closet
Tags
Property features AI
Finance
- Other: Residential zoning; Public transportation nearby; City street access
- HOA & community: Homeowners association present; owner pays HOA; HOA fee $300 monthly; HOA covers exterior maintenance, sewer, trash, water, heat, landscaping, association dues and other items
Exterior
- Parking: One assigned off-street parking space
- Utilities: Public water; Public sewer; Natural gas; Gas water heater
- Home design: Transitional architectural style; Unit entry level 2 (unit is one level); One-level unit in a four-story building; Common hallway entry
- Construction: Poured foundation; Brick construction; Membrane roof
- Exterior features: Brick exterior; Membrane roof; Slider windows; Double-pane insulated vinyl windows; Pets allowed; Laundry in common area
Interior
- Kitchen: Galley kitchen with wood cabinets; Vinyl flooring in kitchen; Microwave, Oven/Range, Warming Drawer
- Bedrooms: Two bedrooms total; Primary bedroom on level 1 (15 x 10); Second bedroom on level 1 (10 x 10)
- Flooring: Vinyl flooring (entry and kitchen); Laminate flooring in dining area
- Bathrooms: One full bathroom on level 1; Primary bathroom: other
- Heating & cooling: Baseboard heating; Ductless heating; Hot water heating; Program thermostat; Ceiling fans; Wall unit cooling
- Interior features: Multi-panel doors; Closet in entry/foyer; Window treatments; Common hallway entry; Smoke alarm
- Laundry & utility: Coin laundry / common area laundry
Neighborhood map
What this means for you Summary
Snapshot
- This is a 2-bed/1.0-bath condo listed at $65k.
Deal economics
- At list price, monthly cash flow is $65 ($774/yr) — positive.
- The deal already cash-flows at list — no discount required.
- Meets the 1% rule at list price ($998 rent vs $65k).
- Recommended offer: $57k (12.0% below list) — sets the bar for market timing.
- Cap rate 7.5% vs local median 5.1% in Cheviot — top-decile yield for the area; either an underpriced asset or a hidden risk that comps aren't pricing in. Stress-test before assuming the spread holds.
Location & tenants
- Location reads 78/100 on livability (#163 in OH, #2,446 nationally) — a middle-class / working-renter tenant base. Strengths: commute A+, cost of living A+, housing A+; Watch: crime C-, amenities D, employment F.
- Cincinnati Public Schools (urban): math 25% / reading 36% proficiency, ranked #581 of 656 in OH (top 89%) — families likely to look elsewhere, expect single-tenant / working-renter base with shorter leases; 70% free/reduced lunch — lower-income household profile, screen leases tightly.
- Market conditions: Rents rising (+3.6%/yr); 82 active listings in the ZIP; 21 comparable units currently listed for rent nearby; rentals at typical pace (median 24d on market — plan ~3-4 weeks tenant-placement turnaround); 801 units permitted in Hamilton County in 2024 (190 in 5+ unit buildings).
Forward outlook
- Local home prices are declining (-3.0%/yr); year-one equity from $449 of loan paydown is wiped out by about $2k of value loss. Plan a longer hold.
Negotiation context
- It's been on market 125 days — a 12% lower offer ($57k) is reasonable based on typical stale-listing flexibility.
- 11 sale attempts since 20y ago; this cycle's ask has dropped $10k (13%) from the opening price — seller is motivated, your offer sets the floor, not the list.
- Current owner paid $30k; list at $65k implies a 117% gain — meaningful room to come down on a strong offer.
Risks & watch-outs
- Watch-outs: HOA is 30% of rent.
Questions for the listing agent
- It's been on market 125 days. Have you received any prior offers? Is the seller open to a 12% concession, seller financing, or rate buy-down credit?
- Built in 1973 — when were the roof, HVAC, electrical panel, plumbing, and water heater last replaced?
- What does the HOA fee cover, when was the last increase, and are there any pending special assessments or reserve-fund shortfalls?
- Any open or pending special assessments — roof, HVAC, plumbing, elevator, façade? What's the per-unit balance and payoff schedule, and is the seller paying it off at close or rolling it to the buyer?
- Why hasn't it sold? Are there any deal-killer items the seller is aware of (foundation, flood, title, zoning, code violations)?
- Is there a deadline driving the sale (1031 exchange, divorce, estate, relocation)? That informs how much negotiation room exists.
- What's the average days-on-market for RENTAL listings here right now (not sales)? A rising rental-DOM trend means longer vacancies and softer asking-rent achievability than the comps imply.
- What's the recent tenant-quality profile in this submarket — average credit score on applications, eviction rate, late-payment / NSF rate, and stable-employment percentage? A property-management company in the area should have these aggregated.
- How much new apartment / multifamily construction is in the pipeline within 1–3 miles? Heavy new supply (>2% of stock underway) typically softens rents 12–24 months out; light construction supports rent growth.
Investment metrics
- 1% rule
- 1.54% ✓
- Cap rate
- 7.48%
- Cash-on-cash
- 4.25%
- DSCR
- 1.19
- GRM
- 5.4
CMA / ARV
No comps found within radius.
Projected returns pro-forma
-3.0% appreciation · 3.64% rent growth · sell at horizon
- IRR
- -8.3%
- Equity multiple
- 0.69×
- Total profit
- $-5,594
- Equity at exit
- $9,692
- IRR
- 2.8%
- Equity multiple
- 1.21×
- Total profit
- $3,856
- Equity at exit
- $5,620
Cash invested: $18,200 (down + closing). Projections, not guarantees.
Landlord ↔ Tenant lean methodology
- Overall (STATE)
- 73 Landlord-Friendly
- State Ohio
- 73 Landlord-Friendly · R+6
- County
- — inherits STATE
- City
- — inherits STATE
ZIP-level market 45211
- Home prices YoY
- -32.0%
- Rents YoY
- 3.6%
- Active inventory
- 82
- Price-to-rent
- 5.4×
Monthly cashflow live
- Estimated rent
- $998 high interval (Pro) →
- Mortgage (P&I)
- −$341
- Tax from tax record
- −$56 /mo · $674/yr
- Insurance
- −$27
- HOA
- −$300
- Vacancy / Maint / Mgmt
- −$210
- Net cashflow
- $65
Break-even live
UW: 25.0% down · 7.5% · 30yr · 1.5% tax · 5.0% vac · 8.0% maint · 8.0% mgmt
Financing live
Cash to close
- Down payment
- $16,250
- Closing costs
- $1,950
- Reserves months
- —
- Total cash needed
- —
Loan-product check · same deal, 3 products live
Conventional
25% down · 7.5% · 30yr
- Down + closing
- —
- Monthly P&I
- —
- Monthly cashflow
- —
- DSCR
- —
- Eligible?
- —
Personal DTI + credit; lowest rate.
DSCR
20% down · 8.5% · 30yr
- Down + closing
- —
- Monthly P&I
- —
- Monthly cashflow
- —
- DSCR
- —
- Eligible?
- —
No personal income docs; deal must DSCR.
Hard money
10% down · 12.0% · 12mo
- Down + closing
- —
- Monthly P&I
- —
- Monthly cashflow
- —
- DSCR
- —
- Eligible?
- —
Short-term bridge; refi at stabilization.
Rent comps 21 comps
| Address | Beds | Baths | Sqft | Rent | $/sqft | DOM | Units | Dist |
|---|---|---|---|---|---|---|---|---|
| 4117 N Bend Rd Cheviot, OH | 2.0 | 1.0 | 720 | $1,095 | $1.52 | 1d | 1 | 0.01mi |
| 3318 Camvic Ter Unit 10 Cheviot, OH | 1.0 | 1.0 | 600 | $800 | $1.33 | 23d | 1 | 0.20mi |
| 3302 Camvic Ter Cincinnati, OH | 1.0 | 1.0 | 600 | $750 | $1.25 | 23d | 1 | 0.24mi |
| 3001 Westwood Northern Blvd Unit 3009-1 Cincinnati, OH | 1.0 | 1.0 | 750 | $900 | $1.20 | 17d | 1 | 0.70mi |
| 3724 Lovell Ave Unit 5 Cincinnati, OH | 1.0 | 1.0 | 500 | $750 | $1.50 | 23d | 1 | 0.73mi |
| 3206 Mozart Ave Cincinnati, OH | 1.0 | 1.0 | 650 | $1,025 | $1.58 | 23d | 1 | 0.75mi |
| 3204 Mozart Ave Cincinnati, OH | 1.0 | 1.0 | 650 | $1,025 | $1.58 | 23d | 1 | 0.75mi |
| 3653 Mozart Ave Cincinnati, OH | 1.0 | 1.0 | 750 | $995 | $1.33 | 23d | 1 | 0.78mi |
| 3771 Robb Ave Unit 3779-66 Cincinnati, OH | 1.0 | 1.0 | 601 | $1,000 | $1.66 | 23d | 1 | 0.92mi |
| 3771 Robb Ave Cincinnati, OH | 1.0–2.0 | 1.0 | 720 | $1,100 | $1.53 | 16d | 2 | 0.92mi |
| 3771 Robb Ave Unit 3779-64 Cincinnati, OH | 1.0 | 1.0 | 601 | $950 | $1.58 | 3d | 1 | 0.92mi |
| 4364 Marsue Ln Unit 4364 7 Cincinnati, OH | 1.0 | 1.0 | 750 | $895 | $1.19 | 14d | 1 | 1.06mi |
| 3725 Dina Ave Unit 1 Cheviot, OH | 1.0 | 1.0 | 650 | $800 | $1.23 | 23d | 1 | 1.12mi |
| 3727 Dina Ave Unit 10 Cheviot, OH | 1.0 | 1.0 | 650 | $800 | $1.23 | 23d | 1 | 1.12mi |
| 3801 Dina Ave Cheviot, OH | 2.0 | 1.0–1.5 | 774 | $1,232 | $1.59 | 1d | 6 | 1.17mi |
| 3339 Epworth Ave Unit 17 Cincinnati, OH | 1.0 | 1.0 | 500 | $799 | $1.60 | 3d | 1 | 1.22mi |
| 3339 Epworth Ave Unit 5 Cincinnati, OH | 1.0 | 1.0 | 500 | $750 | $1.50 | 14d | 1 | 1.22mi |
| 2678 Montana Ave Cincinnati, OH | 1.0–3.0 | 1.0–2.0 | 935 | $1,252 | $1.34 | 1d | 10 | 1.26mi |
| 2660 Montana Ave Cincinnati, OH | 2.0 | 1.0 | 750 | $1,125 | $1.50 | 3d | 4 | 1.39mi |
| 3588 Schwartze Ave Unit 4 Cincinnati, OH | 1.0 | 1.0 | 650 | $950 | $1.46 | 23d | 1 | 1.48mi |
| 2897 Harrison Ave Unit 12 Cincinnati, OH | 1.0 | 1.0 | 650 | $800 | $1.23 | 23d | 1 | 1.49mi |
HOA detail condo
- Monthly dues
- $300 · $3,600/yr
- Assessments
- None detected in remarks — confirm with the listing agent.
Listing history 35 events
-
2026-05-06status Active
-
2026-05-04historical Contingency Pending
-
2026-04-23price $65,000
-
2026-03-04price $70,000
-
2026-01-21$75,000 Active
-
2022-01-24soldstatus $30,000
-
2022-01-20soldstatus $30,000 Sold 111-char remark
Show marketing remark (111 chars)
2 Bed, 1 Bath condo. Currently being rented for $700 a month. Tenant occupied. 24 hour notice. Cash offer only.
-
2021-12-13historical Contingency Pending 111-char remark
Show marketing remark (111 chars)
2 Bed, 1 Bath condo. Currently being rented for $700 a month. Tenant occupied. 24 hour notice. Cash offer only.
-
2021-11-30price $33,000 111-char remark
Show marketing remark (111 chars)
2 Bed, 1 Bath condo. Currently being rented for $700 a month. Tenant occupied. 24 hour notice. Cash offer only.
-
2021-11-04$40,000 Active 111-char remark
Show marketing remark (111 chars)
2 Bed, 1 Bath condo. Currently being rented for $700 a month. Tenant occupied. 24 hour notice. Cash offer only.
-
2021-09-14historical
-
2021-08-27price $35,000
-
2021-07-20$40,000 Active
-
2020-11-20historical
-
2020-11-02price $43,000
-
2020-10-15$45,000 Active
-
2020-09-04soldstatus $40,000
-
2020-08-28soldstatus $40,000 Sold
-
2020-08-13historical Contingency Pending
-
2020-08-12$40,000 Active
-
2019-05-21soldstatus $33,000
-
2019-05-14soldstatus $33,000 Sold
-
2019-04-18historical Accept Backup Offers
-
2019-04-16status Active
-
2019-03-22historical Accept Backup Offers
-
2019-02-14status Active
-
2019-02-13historical
-
2019-02-11$35,000 Active
-
2019-01-18historical
-
2018-12-12price $28,900
-
2018-10-09price $33,900
-
2018-09-28$35,000 Active
-
2006-03-21soldstatus $47,500
-
2006-03-03soldstatus $47,500
-
2006-01-02$49,900
ⓘ Source: listings_history table (triggers on properties + properties_extension) + one-shot
backfill from property_details.listing_events for pre-trigger history.
Tax reassessment forecast OH · Partial reset (capped growth)
- Current annual tax
- $674 · $56/mo
- Projected year-2 tax
- $844 · $70/mo
- Expected delta
- +$170/yr (+$14/mo · 25.2%)
ⓘ Screening estimate from a state-policy table — verify with the county assessor before closing.
Climate risk First Street
- Flood 1/10 Low FEMA zone X (unshaded) · 0% chance over 30 yrs
- Wildfire 1/10 Low
- Heat 4/10 Moderate 7 d/yr ≥102°F today · 19 d/yr by 30 yrs out
- Wind 2/10 Low 100% chance of damaging wind over 30 yrs
- Air quality 2/10 Low 1 unhealthy d/yr today · 1 by 30 yrs out
Nearby sold comps map
Loading sold comps map…
Walkable amenities ~0.75 mi
Loading nearby amenities…
Taxation est. · year 1
- Rental income
- $11,979
- − Mortgage interest
- −$3,641
- − Property taxes
- −$674
- − Insurance
- −$325
- − Repairs & maintenance
- −$958
- − Management
- −$958
- − HOA
- −$3,600
- − Depreciation
- −$1,891
- Taxable loss
- −$69
- Est. tax savings @ 24.0%
- +$16
- After-tax cash flow
- $790/yr
For passive investors: Depreciation is non-cash, so a rental often shows a tax loss while cash-flowing — sheltering income. Rental losses are passive: they offset passive income freely, and up to $25,000/yr can offset ordinary (W-2) income if you actively participate and your MAGI is under $100k (phasing out to $0 by $150k); unused losses carry forward. On sale, claimed depreciation is recaptured at up to 25%, and gains may owe capital-gains tax (a 1031 exchange can defer both). Figures are a year-1 estimate at your 24.0% rate — not tax advice; consult a CPA.
Schools (NCES district)
- District
- Cincinnati Public Schools
- NCES district ID
- 3904375
- Math proficiency
- 25% ▼ -19.00%
- Reading proficiency
- 36% ▼ -14.00%
- Median HH income
- $35,743
- Composite
- 25.21/100
- National rank
- #7508
- State rank
- #581 of 656 in OH
Livability — Cheviot
- Score
- 78/100
- State rank
- #163
- US rank
- #2446
Category grades
Schools grade is shown separately in the Schools card above.
Census & demographics
- Census place
- Cheviot, OH
- County
- Hamilton County · 701,295 people
- Metro
- Cincinnati, OH-KY-IN
- Population (ZIP)
- 38,049
- Household income
- $53,868
- Rent vs Own
- Severe rent burden
- 1916.0
Population outlook (Hamilton County) Hauer SSP2
- Today (2025)
- 826,054 people
- By 2030
- 830,947 · +0.6%
- By 2040
- 832,319 · +0.8%
- By 2050
- 822,428 · -0.4%
- By 2075
- 788,688 · -4.5%
- By 2100
- 710,674 · -14.0%
Race, ethnicity, and origin ACS 2023
- Neighborhood character
- Diverse neighborhood (Simpson 0.60)
- Race & ethnicity
- White 50% Black 38% Two or more races 8% Hispanic / Latino 6% Asian 2%
- Hispanic origin (detail)
- Mexican 4% Puerto Rican 1%
- Common ancestry
- Lithuanian 2% Italian 1% Romanian 1%
- Foreign-born
- 5% · Canada
- Languages at home
- 91% English-only · Spanish 4% French/Haitian/Cajun 1% Other Indo-European 1%
Political lean MEDSL · Hamilton
- 2024 margin
- D (+14.9) · D 57.0% · R 42.1%
- 2008→2024 swing
- +7.9pp toward D · 2008: 7.0pp · 2024: 14.9pp
- All cycles
- 2024: D+14.9 2020: D+15.9 2016: D+9.5 2012: D+4.9 2008: D+7.0
Not yet ingested
- Civics
- —
Market trends
- HPI YoY
- ▼ -101.15%
- Current HPI
- 215.0659
- Rent YoY
- ▲ 3.64%
- Metro
- Cincinnati, OH-KY-IN
- State GDP YoY
- ▲ 1.98%
- F500 in state
- 48
Industry mix (Fortune 500 HQ in OH)
| Industry | F500 HQs | Revenue |
|---|---|---|
| Insurance | 3 | $145B |
|
||
| Industrial Machinery | 3 | $49B |
|
||
| Financial Services | 3 | $24B |
|
||
| Consumer Goods | 2 | $93B |
|
||
| Aerospace / Defense | 2 | $47B |
|
||
| Utilities | 2 | $33B |
|
||
Price history
+30.3% since first listed35 events — show timeline
- 2026-05-06 Relisted — Cincy MLS
- 2026-05-04 Contingent — Cincy MLS
- 2026-04-23 Price Changed $65,000 Cincy MLS
- 2026-03-04 Price Changed $70,000 Cincy MLS
- 2026-01-21 Listed $75,000 Cincy MLS
- 2022-01-24 Sold (Public Records) $30,000 Public Records
- 2022-01-20 Sold (MLS) $30,000 Cincy MLS
- 2021-12-13 Contingent — Cincy MLS
- 2021-11-30 Price Changed $33,000 Cincy MLS
- 2021-11-04 Listed $40,000 Cincy MLS
- 2021-09-14 Listing Removed — Cincy MLS
- 2021-08-27 Price Changed $35,000 Cincy MLS
- 2021-07-20 Listed $40,000 Cincy MLS
- 2020-11-20 Listing Removed — Cincy MLS
- 2020-11-02 Price Changed $43,000 Cincy MLS
- 2020-10-15 Listed $45,000 Cincy MLS
- 2020-09-04 Sold (Public Records) $40,000 Public Records
- 2020-08-28 Sold (MLS) $40,000 Cincy MLS
- 2020-08-13 Contingent — Cincy MLS
- 2020-08-12 Listed $40,000 Cincy MLS
- 2019-05-21 Sold (Public Records) $33,000 Public Records
- 2019-05-14 Sold (MLS) $33,000 Cincy MLS
- 2019-04-18 Contingent — Cincy MLS
- 2019-04-16 Relisted — Cincy MLS
- 2019-03-22 Contingent — Cincy MLS
- 2019-02-14 Relisted — Cincy MLS
- 2019-02-13 Listing Removed — Cincy MLS
- 2019-02-11 Listed $35,000 Cincy MLS
- 2019-01-18 Listing Removed — Cincy MLS
- 2018-12-12 Price Changed $28,900 Cincy MLS
- 2018-10-09 Price Changed $33,900 Cincy MLS
- 2018-09-28 Listed $35,000 Cincy MLS
- 2006-03-21 Sold (Public Records) $47,500 Public Records
- 2006-03-03 Sold (MLS) $47,500 Cincy MLS
- 2006-01-02 Listed $49,900 Cincy MLS
Property tax history
+2.7%/yrLatest (2025): $674 · +0.1% YoY. Source: county tax records.
Cash-flow waterfall
monthlySold comps — $/sqft
last 12 mo · ≤1 miLoading sold comps…