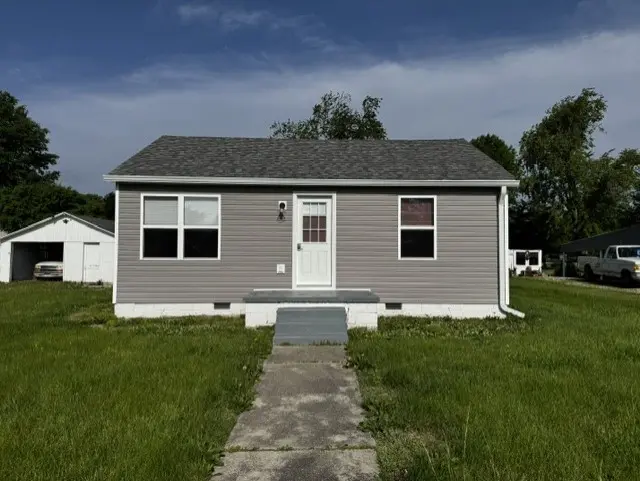
103 Washington St · Ste. Marie, IL
Flood risk No data
- FEMA flood zone
- —
- Chance of flooding over 30 yrs
- —
- Est. flood insurance / yr
- —
Fire risk No data
- Est. fire insurance / yr
- —
Heat risk No data
- Hot days now (above threshold)
- —
- Hot days in 30 yrs
- —
Wind risk No data
- Chance of severe wind over 30 yrs
- —
Air-quality risk No data
- Unhealthy air days now
- —
- Unhealthy air days in 30 yrs
- —
Risk factors via First Street. Map © Google.
Why this score? — see what drove the C- grade
The composite is a weighted blend of 9 inputs, each scored 0–100. Each bar is that input's sub-score; the figure is the points it added to the 100-point composite (weight × sub-score).
- Cash flow +18.4/30.0
- ARV discount +7.5/15.0
- DSCR +5.8/10.0
- Appreciation +5.0/10.0
- 1% rule +4.9/10.0
- Condition / age +4.0/5.0
- Schools +2.6/10.0
- Rent growth +2.5/5.0
- Livability +2.5/5.0
$82,000
🖨 Deal sheet 📄 Offer letter ✓ Due diligence
Listing remarks
Charming and move-in ready in the peaceful community of Ste. Marie! This beautifully updated 2-bedroom, 1-bath home offers comfortable small-town living with modern touches throughout. Remodeled in 2022, the home features an efficient layout, inviting living spaces, and easy maintenance—perfect for first-time buyers, downsizers, or anyone looking for a cozy retreat. Situated in a quiet neighborhood, this property delivers both comfort and convenience in a manageable 616 square feet. Schedule your private showing today! 24-hour notice required for all appointments.
Key facts
- Move-in ready
- Easy maintenance
- Updated
Tags
Property features AI
Finance
- Other: Zoned R-1
Exterior
- Parking: Detached 1-car garage
- Utilities: Public water; Public sewer
- Home design: Single-family residence; One story
- Construction: Vinyl siding; Shingle roof; Built on crawl space
- Exterior features: Gravel road access; Subdivision: Joseph Picquets North West Add
Interior
- Bathrooms: 1 full bathroom
- Heating & cooling: Forced air heating; Central air conditioning
- Interior features: Electric water heater; Crawl space basement
- Laundry & utility: Washer and dryer included; Laundry on main level
Neighborhood map
What this means for you Summary
Snapshot
- This is a 2-bed/1.0-bath single-family listed at $82k. Condition is rated good.
Deal economics
- At list price, monthly cash flow is $76 ($910/yr) — positive.
- The deal already cash-flows at list — no discount required.
- To meet the 1% rule (rent ≥ 1% of price), the offer needs to be $81k (0.8% below list).
- Recommended offer: $81k (1.5% below list) — sets the bar for market timing.
Location & tenants
- Location reads: area grade C — affects rentability + tenant quality, not the cash-flow math above.
- Jasper County CUD 1 (town): math 29% / reading 30% proficiency, ranked #253 of 620 in IL (top 41%) — low school quality limits family demand, transient renter base, plan for 1-2y turnover.
- Market conditions: 1 active listings in the ZIP.
Forward outlook
- In year one you build about $3k of equity ($567 loan paydown + $2k appreciation (3.0% local appreciation)).
- Jasper County population projected at -16% by 2050 — secular population decline; favor cash flow + early exit over multi-decade hold.
- At projected returns (3.0% appreciation + 3.0% rent growth), your $23k cash investment doubles in ~6 years — after that, you're playing with house money.
Negotiation context
- It's been on market 30 days — a 2% lower offer ($81k) is reasonable based on typical stale-listing flexibility.
Risks & watch-outs
- Watch-outs: built in 1954 — expect roof / HVAC / electrical / plumbing capex.
Questions for the listing agent
- Built in 1954 — when were the roof, HVAC, electrical panel, plumbing, and water heater last replaced?
- Is there a deadline driving the sale (1031 exchange, divorce, estate, relocation)? That informs how much negotiation room exists.
- What's the average days-on-market for RENTAL listings here right now (not sales)? A rising rental-DOM trend means longer vacancies and softer asking-rent achievability than the comps imply.
- What's the recent tenant-quality profile in this submarket — average credit score on applications, eviction rate, late-payment / NSF rate, and stable-employment percentage? A property-management company in the area should have these aggregated.
- How much new for-sale + rental construction is in the pipeline within 1–3 miles? Heavy new supply typically softens prices + rents 12–24 months out; constrained supply supports both.
Investment metrics
- 1% rule
- 0.99% ✗
- Cap rate
- 7.40%
- Cash-on-cash
- 3.97%
- DSCR
- 1.18
- GRM
- 8.4
CMA / ARV
No comps found within radius.
Projected returns pro-forma
3.0% appreciation · 3.0% rent growth · sell at horizon
- IRR
- 11.2%
- Equity multiple
- 1.64×
- Total profit
- $14,723
- Equity at exit
- $36,871
- IRR
- 13.4%
- Equity multiple
- 2.99×
- Total profit
- $45,669
- Equity at exit
- $56,822
Cash invested: $22,960 (down + closing). Projections, not guarantees.
Landlord ↔ Tenant lean methodology
- Overall (STATE)
- 43 Moderately Tenant-Leaning
- State Illinois
- 43 Moderately Tenant-Leaning · D+7
- County
- — inherits STATE
- City
- — inherits STATE
ZIP-level market 62459
- Active inventory
- 1
- Price-to-rent
- 8.4×
Monthly cashflow live
- Estimated rent
- $813 medium interval (Pro) →
- Mortgage (P&I)
- −$430
- Tax est. 1.5%
- −$102 /mo · $1,230/yr
- Insurance
- −$34
- HOA
- −$0
- Vacancy / Maint / Mgmt
- −$171
- Net cashflow
- $76
Break-even live
UW: 25.0% down · 7.5% · 30yr · 1.5% tax · 5.0% vac · 8.0% maint · 8.0% mgmt
Financing live
Cash to close
- Down payment
- $20,500
- Closing costs
- $2,460
- Reserves months
- —
- Total cash needed
- —
Loan-product check · same deal, 3 products live
Conventional
25% down · 7.5% · 30yr
- Down + closing
- —
- Monthly P&I
- —
- Monthly cashflow
- —
- DSCR
- —
- Eligible?
- —
Personal DTI + credit; lowest rate.
DSCR
20% down · 8.5% · 30yr
- Down + closing
- —
- Monthly P&I
- —
- Monthly cashflow
- —
- DSCR
- —
- Eligible?
- —
No personal income docs; deal must DSCR.
Hard money
10% down · 12.0% · 12mo
- Down + closing
- —
- Monthly P&I
- —
- Monthly cashflow
- —
- DSCR
- —
- Eligible?
- —
Short-term bridge; refi at stabilization.
Listing history 16 events
-
2026-06-18days on market $82,000 Active 30 DOM
-
2026-06-17days on market $82,000 Active 29 DOM
-
2026-06-16days on market $82,000 Active 28 DOM
-
2026-06-15days on market $82,000 Active 27 DOM
-
2026-06-13days on market $82,000 Active 25 DOM
-
2026-06-12days on market $82,000 Active 24 DOM
-
2026-06-09days on market $82,000 Active 21 DOM
-
2026-06-08days on market $82,000 Active 20 DOM
-
2026-06-07days on market $82,000 Active 19 DOM
-
2026-06-05days on market $82,000 Active 17 DOM
-
2026-06-04days on market $82,000 Active 15 DOM
-
2026-06-02days on market $82,000 Active 14 DOM
-
2026-06-01days on market $82,000 Active 13 DOM
-
2026-05-31days on market $82,000 Active 12 DOM
-
2026-05-31days on market $82,000 Active 11 DOM
-
2026-05-19$82,000 Active
ⓘ Source: listings_history table (triggers on properties + properties_extension) + one-shot
backfill from property_details.listing_events for pre-trigger history.
Nearby sold comps map
Loading sold comps map…
Walkable amenities ~0.75 mi
Loading nearby amenities…
Taxation est. · year 1
- Rental income
- $9,760
- − Mortgage interest
- −$4,593
- − Property taxes
- −$1,230
- − Insurance
- −$410
- − Repairs & maintenance
- −$781
- − Management
- −$781
- − Depreciation
- −$2,385
- Taxable loss
- −$420
- Est. tax savings @ 24.0%
- +$101
- After-tax cash flow
- $1,011/yr
For passive investors: Depreciation is non-cash, so a rental often shows a tax loss while cash-flowing — sheltering income. Rental losses are passive: they offset passive income freely, and up to $25,000/yr can offset ordinary (W-2) income if you actively participate and your MAGI is under $100k (phasing out to $0 by $150k); unused losses carry forward. On sale, claimed depreciation is recaptured at up to 25%, and gains may owe capital-gains tax (a 1031 exchange can defer both). Figures are a year-1 estimate at your 24.0% rate — not tax advice; consult a CPA.
Condition & rehab AI · 13 photos
This move-in ready home offers a good condition with updated kitchen and bathroom, and is situated in a quiet neighborhood with good curb appeal.
Value-add opportunities
- Both Painting exterior and interior — Fresh paint enhances curb appeal and interior aesthetics
- Both Landscaping and curb appeal — Well-maintained landscaping improves curb appeal and property value
- Both HVAC maintenance — Regular HVAC maintenance ensures comfort and energy efficiency
Renovation cost estimate screening
Value-add ROI direction
- Both Painting exterior and interior — Fresh paint enhances curb appeal and interior aesthetics ↑
- Both Landscaping and curb appeal — Well-maintained landscaping improves curb appeal and property value ↑
- Both HVAC maintenance — Regular HVAC maintenance ensures comfort and energy efficiency ↑
ⓘ Cost ranges are severity-bucket heuristics (US national rule-of-thumb). Get contractor quotes + a written scope before underwriting a rehab budget.
Schools (NCES district)
- District
- Jasper County CUD 1
- NCES district ID
- 1720380
- Math proficiency
- 29% ▼ -9.00%
- Reading proficiency
- 30% ▼ -8.00%
- Median HH income
- $50,304
- Composite
- 25.82/100
- National rank
- #7358
- State rank
- #253 of 620 in IL
Livability — Ste. Marie
No livability data for this city. (Only ~50 U.S. cities are tracked.)
Census & demographics
- Census place
- Ste. Marie, IL
- City population
- 266
- Population (ZIP)
- 266
Population outlook (Jasper County) Hauer SSP2
- Today (2025)
- 9,203 people
- By 2030
- 8,927 · -3.0%
- By 2040
- 8,350 · -9.3%
- By 2050
- 7,733 · -16.0%
- By 2075
- 6,335 · -31.2%
- By 2100
- 4,960 · -46.1%
Race, ethnicity, and origin ACS 2023
- Neighborhood character
- Predominantly White (100%)
- Race & ethnicity
- White 100%
- Common ancestry
- Lithuanian 11% Romanian 4% Slovak 2%
- Foreign-born
- 1% · Canada
- Languages at home
- 96% English-only · German/W. Germanic 3% Other Indo-European 1%
Political lean MEDSL · Jasper
- 2024 margin
- Solid R (+65.2) · D 16.8% · R 82.1% · Other 1.1%
- 2008→2024 swing
- -47.7pp toward R · 2008: -17.6pp · 2024: -65.2pp
- All cycles
- 2024: R+65.2 2020: R+62.4 2016: R+59.7 2012: R+41.2 2008: R+17.6
Not yet ingested
- Civics
- —
Market trends
- HPI YoY
- —
- Current HPI
- —
- Rent YoY
- —
- Metro
- —
- State GDP YoY
- ▲ 1.59%
- F500 in state
- 60
Industry mix (Fortune 500 HQ in IL)
| Industry | F500 HQs | Revenue |
|---|---|---|
| Insurance | 4 | $201B |
|
||
| Consumer Goods | 4 | $87B |
|
||
| Industrial Machinery | 3 | $64B |
|
||
| Healthcare | 2 | $55B |
|
||
| Retail / Pharmacy | 1 | $148B |
|
||
| Agriculture / Food | 1 | $86B |
|
||
Price history
1 event — show timeline
- 2026-05-19 Listed $82,000 CIBR
Cash-flow waterfall
monthlySold comps — $/sqft
last 12 mo · ≤1 miLoading sold comps…