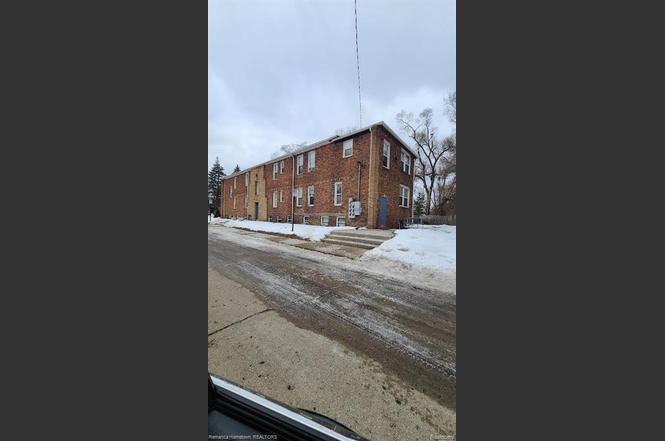
 6-Plex
21304 Ontaga St · Farmington Hills, MI
Flood risk 1/10 · Minimal
- FEMA flood zone
- X (unshaded)
- Chance of flooding over 30 yrs
- 0.0%
- Est. flood insurance / yr
- $507 – $1,088
Fire risk 1/10 · Minimal
- Est. fire insurance / yr
- $784 – $1,456
Heat risk 3/10 · Minor
- Hot days now (above 97°F)
- 7 days/yr
- Hot days in 30 yrs
- 15 days/yr
Wind risk 2/10 · Minimal
- Chance of severe wind over 30 yrs
- —
Air-quality risk 3/10 · Minor
- Unhealthy air days now
- 2 days/yr
- Unhealthy air days in 30 yrs
- 3 days/yr
Risk factors via First Street. Map © Google.
Why this score? — see what drove the C grade
The composite is a weighted blend of 9 inputs, each scored 0–100. Each bar is that input's sub-score; the figure is the points it added to the 100-point composite (weight × sub-score).
- Cash flow +22.2/30.0
- ARV discount +7.5/15.0
- DSCR +7.1/10.0
- 1% rule +5.9/10.0
- Rent growth +5.0/5.0
- Livability +4.0/5.0
- Condition / age +2.5/5.0
- Schools +2.2/10.0
- Appreciation +0.0/10.0
$760,000
🖨 Deal sheet 📄 Offer letter ✓ Due diligence
Multi-family units
County records classify this as Multi-Family (5+ Unit). Listing-text estimate: 6 units. confirmed
5+ unit building — per-unit beds/baths from public records are typically unavailable; the breakdown below (if shown) is an estimate from the listing text.
Listing remarks MLS
24 hour notice to show please! Please don't speak with tenants. Proof of funds or pre-approval only prior to showing, please. Rare 6 unit apartment building. Fully occupied. 4 2bedroom units and 2 3bedroom units. Super investment potential located in Farmington Hills. APOD available , Some units have been refinished, all have kitchen appliances and a common laundry room on site, private on site parking, close to all Farmington has to offer . Nice building with great investment potential.
Key facts
- Kitchen appliances
- Investment potential
- Common laundry room
Tags
Neighborhood map
What this means for you Summary
Snapshot
- This is a 4×2bd/1.0ba + 2×2bd/1.5ba units multifamily listed at $760k.
Deal economics
- At list price, monthly cash flow is $1k ($15k/yr) — positive. Per door: $206/mo.
- The deal already cash-flows at list — no discount required.
- Meets the 1% rule at list price ($8k rent vs $760k).
- Recommended offer: $737k (3.0% below list) — sets the bar for market timing.
- Cap rate 8.2% vs local median 3.5% in Farmington Hills — top-decile yield for the area; either an underpriced asset or a hidden risk that comps aren't pricing in. Stress-test before assuming the spread holds.
Location & tenants
- Location reads 81/100 on livability (#64 in MI, #1,364 nationally) — a professional / high-income tenant draw. Strengths: employment A+, housing A+, crime A; Watch: amenities D, health & safety F.
- Clarenceville School District (urban): math 18% / reading 33% proficiency, ranked #421 of 540 in MI (top 78%) — low school quality limits family demand, transient renter base, plan for 1-2y turnover.
- Market conditions: Rents rising fast (+10.8%/yr); 156 active listings in the ZIP; solid renter incomes; 2,614 units permitted in Oakland County in 2024 (721 in 5+ unit buildings).
- At $8,280/mo this rent would consume 112% of the median local household income ($89k/yr) (locally 733% of renters already pay >50% of income on rent) — very limited rent-growth headroom before tenants either downsize or default.
Forward outlook
- Local home prices are declining (-3.0%/yr); year-one equity from $5k of loan paydown is wiped out by about $23k of value loss. Plan a longer hold.
- Oakland County population projected at +10% by 2050 — modest demand growth; plan on rents tracking national, not racing it.
- At projected returns (-3.0% appreciation + 8.0% rent growth), your $213k cash investment doubles in ~9 years — after that, you're playing with house money.
Negotiation context
- It's been on market 57 days — a 3% lower offer ($737k) is reasonable based on typical stale-listing flexibility.
- 2 sale attempts with the ask held roughly flat each time — persistent listings suggest the price (not the market) is what's stuck; bring a comps-based counter.
- Current owner paid $65k; list at $760k implies a 1069% gain — meaningful room to come down on a strong offer.
Risks & watch-outs
- Watch-outs: built in 1951 — expect roof / HVAC / electrical / plumbing capex.
Questions for the listing agent
- It's been on market 57 days. Have you received any prior offers? Is the seller open to a 3% concession, seller financing, or rate buy-down credit?
- Can we see the unit-by-unit rent roll, current vacancy, and any below-market leases? What's the average tenancy length?
- What capital expenditures (roof, boiler, parking lot, exteriors) have been made in the last 5 years, and what's planned in the next 2?
- Built in 1951 — when were the roof, HVAC, electrical panel, plumbing, and water heater last replaced?
- Is there a deadline driving the sale (1031 exchange, divorce, estate, relocation)? That informs how much negotiation room exists.
- Schools are B-rated — typically a magnet for longer-tenancy family renters. What's the average tenant stay here, and is there a school-zone premium baked into asking?
- What's the average days-on-market for RENTAL listings here right now (not sales)? A rising rental-DOM trend means longer vacancies and softer asking-rent achievability than the comps imply.
- What's the recent tenant-quality profile in this submarket — average credit score on applications, eviction rate, late-payment / NSF rate, and stable-employment percentage? A property-management company in the area should have these aggregated.
- How much new apartment / multifamily construction is in the pipeline within 1–3 miles? Heavy new supply (>2% of stock underway) typically softens rents 12–24 months out; light construction supports rent growth.
Investment metrics
- 1% rule
- 1.09% ✓
- Cap rate
- 8.24%
- Cash-on-cash
- 6.96%
- DSCR
- 1.31
- GRM
- 7.6
CMA / ARV
No comps found within radius.
Projected returns pro-forma
-3.0% appreciation · 8.0% rent growth · sell at horizon
- IRR
- -0.1%
- Equity multiple
- 1.00×
- Total profit
- $-644
- Equity at exit
- $113,318
- IRR
- 14.2%
- Equity multiple
- 2.41×
- Total profit
- $300,444
- Equity at exit
- $65,711
Cash invested: $212,800 (down + closing). Projections, not guarantees.
Landlord ↔ Tenant lean methodology
- Overall (STATE)
- 62 Landlord-Friendly
- State Michigan
- 62 Landlord-Friendly · EVEN
- County
- — inherits STATE
- City
- — inherits STATE
ZIP-level market 48336
- Rents YoY
- 10.8%
- Active inventory
- 156
- Price-to-rent
- 45.9×
Monthly cashflow live
- Estimated rent
- $8,280 high interval (Pro) →
- Mortgage (P&I)
- −$3,986
- Tax from tax record
- −$1,005 /mo · $12,061/yr
- Insurance
- −$317
- HOA
- −$0
- Vacancy / Maint / Mgmt
- −$1,739
- Net cashflow
- $1,234
Break-even live
6-unit breakdown (identical units grouped — click to expand)
| Units | Beds | Baths | Est. rent |
|---|---|---|---|
| 4× units | 2 | 1 | $5,520 |
| #1 | 2 | 1 | $1,380 |
| #2 | 2 | 1 | $1,380 |
| #3 | 2 | 1 | $1,380 |
| #4 | 2 | 1 | $1,380 |
| 2× units | 2 | 1.5 | $2,760 |
| #5 | 2 | 1.5 | $1,380 |
| #6 | 2 | 1.5 | $1,380 |
| Total (6 units) | $8,280 | ||
UW: 25.0% down · 7.5% · 30yr · 1.5% tax · 5.0% vac · 8.0% maint · 8.0% mgmt
Financing live
Cash to close
- Down payment
- $190,000
- Closing costs
- $22,800
- Reserves months
- —
- Total cash needed
- —
Loan-product check · same deal, 3 products live
Conventional
25% down · 7.5% · 30yr
- Down + closing
- —
- Monthly P&I
- —
- Monthly cashflow
- —
- DSCR
- —
- Eligible?
- —
Personal DTI + credit; lowest rate.
DSCR
20% down · 8.5% · 30yr
- Down + closing
- —
- Monthly P&I
- —
- Monthly cashflow
- —
- DSCR
- —
- Eligible?
- —
No personal income docs; deal must DSCR.
Hard money
10% down · 12.0% · 12mo
- Down + closing
- —
- Monthly P&I
- —
- Monthly cashflow
- —
- DSCR
- —
- Eligible?
- —
Short-term bridge; refi at stabilization.
Listing history 5 events
-
2026-04-17status Pending 492-char remark
Show marketing remark (492 chars)
24 hour notice to show please! Please don't speak with tenants. Proof of funds or pre-approval only prior to showing, please. Rare 6 unit apartment building. Fully occupied. 4 2bedroom units and 2 3bedroom units. Super investment potential located in Farmington Hills. APOD available , Some units have been refinished, all have kitchen appliances and a common laundry room on site, private on site parking, close to all Farmington has to offer . Nice building with great investment potential.
-
2026-04-17status Pending
Show marketing remark (492 chars)
24 hour notice to show please! Please don't speak with tenants. Proof of funds or pre-approval only prior to showing, please. Rare 6 unit apartment building. Fully occupied. 4 2bedroom units and 2 3bedroom units. Super investment potential located in Farmington Hills. APOD available , Some units have been refinished, all have kitchen appliances and a common laundry room on site, private on site parking, close to all Farmington has to offer . Nice building with great investment potential.
-
2026-02-19$760,000 Active 492-char remark
Show marketing remark (492 chars)
24 hour notice to show please! Please don't speak with tenants. Proof of funds or pre-approval only prior to showing, please. Rare 6 unit apartment building. Fully occupied. 4 2bedroom units and 2 3bedroom units. Super investment potential located in Farmington Hills. APOD available , Some units have been refinished, all have kitchen appliances and a common laundry room on site, private on site parking, close to all Farmington has to offer . Nice building with great investment potential.
-
2026-02-19$760,000 Active
Show marketing remark (492 chars)
24 hour notice to show please! Please don't speak with tenants. Proof of funds or pre-approval only prior to showing, please. Rare 6 unit apartment building. Fully occupied. 4 2bedroom units and 2 3bedroom units. Super investment potential located in Farmington Hills. APOD available , Some units have been refinished, all have kitchen appliances and a common laundry room on site, private on site parking, close to all Farmington has to offer . Nice building with great investment potential.
-
2018-03-20soldstatus $65,000
ⓘ Source: listings_history table (triggers on properties + properties_extension) + one-shot
backfill from property_details.listing_events for pre-trigger history.
Tax reassessment forecast MI · Partial reset (capped growth)
- Current annual tax
- $12,061 · $1,005/mo
- Projected year-2 tax
- $12,061 · $1,005/mo
- Expected delta
- $0/yr ($0/mo · 0.0%)
ⓘ Screening estimate from a state-policy table — verify with the county assessor before closing.
Climate risk First Street
- Flood 1/10 Low FEMA zone X (unshaded) · 0% chance over 30 yrs
- Wildfire 1/10 Low
- Heat 3/10 Moderate 7 d/yr ≥97°F today · 15 d/yr by 30 yrs out
- Wind 2/10 Low
- Air quality 3/10 Moderate 2 unhealthy d/yr today · 3 by 30 yrs out
Nearby sold comps map
Loading sold comps map…
Walkable amenities ~0.75 mi
Loading nearby amenities…
Taxation est. · year 1
- Rental income
- $99,360
- − Mortgage interest
- −$42,572
- − Property taxes
- −$12,061
- − Insurance
- −$3,800
- − Repairs & maintenance
- −$7,949
- − Management
- −$7,949
- − Depreciation
- −$22,109
- Taxable income
- $2,921
- Est. tax owed @ 24.0%
- −$701
- After-tax cash flow
- $14,107/yr
For passive investors: Depreciation is non-cash, so a rental often shows a tax loss while cash-flowing — sheltering income. Rental losses are passive: they offset passive income freely, and up to $25,000/yr can offset ordinary (W-2) income if you actively participate and your MAGI is under $100k (phasing out to $0 by $150k); unused losses carry forward. On sale, claimed depreciation is recaptured at up to 25%, and gains may owe capital-gains tax (a 1031 exchange can defer both). Figures are a year-1 estimate at your 24.0% rate — not tax advice; consult a CPA.
Schools (NCES district)
- District
- Clarenceville School District
- NCES district ID
- 2609840
- Math proficiency
- 18% ▼ -7.00%
- Reading proficiency
- 33% ▼ -5.00%
- Median HH income
- $42,069
- Composite
- 21.65/100
- National rank
- #8282
- State rank
- #421 of 540 in MI
Livability — Farmington Hills
- Score
- 81/100
- State rank
- #64
- US rank
- #1364
Category grades
Schools grade is shown separately in the Schools card above.
Census & demographics
- Census place
- Farmington Hills, MI
- County
- Oakland County · 1,009,092 people
- City population
- 67,612
- Metro
- Detroit-Warren-Dearborn, MI
- Population (ZIP)
- 26,432
- Household income
- $88,938
- Rent vs Own
- Severe rent burden
- 733.0
Population outlook (Oakland County) Hauer SSP2
- Today (2025)
- 1,335,747 people
- By 2030
- 1,375,100 · +2.9%
- By 2040
- 1,435,385 · +7.5%
- By 2050
- 1,469,250 · +10.0%
- By 2075
- 1,531,946 · +14.7%
- By 2100
- 1,450,485 · +8.6%
Race, ethnicity, and origin ACS 2023
- Neighborhood character
- Predominantly White (71%)
- Race & ethnicity
- White 71% Black 13% Two or more races 7% Asian 6% Hispanic / Latino 4%
- Common ancestry
- Romanian 10% Slovak 3% Lithuanian 3%
- Foreign-born
- 12% · Canada, China, South Korea
- Languages at home
- 85% English-only · Other Indo-European 5% Arabic 2% Spanish 2%
Political lean MEDSL · Oakland
- 2024 margin
- D (+10.6) · D 54.4% · R 43.8% · Other 1.9%
- 2008→2024 swing
- -3.9pp toward R · 2008: 14.5pp · 2024: 10.6pp
- All cycles
- 2024: D+10.6 2020: D+14.1 2016: D+8.1 2012: D+8.1 2008: D+14.5
Not yet ingested
- Civics
- —
Market trends
- HPI YoY
- ▼ -273.86%
- Current HPI
- 177.4299
- Rent YoY
- ▲ 10.83%
- Metro
- Detroit-Warren-Dearborn, MI
- State GDP YoY
- ▲ 1.37%
- F500 in state
- 28
Industry mix (Fortune 500 HQ in MI)
| Industry | F500 HQs | Revenue |
|---|---|---|
| Automotive Parts | 3 | $48B |
|
||
| Automotive | 2 | $372B |
|
||
| Chemicals | 1 | $45B |
|
||
| Automotive Retail | 1 | $29B |
|
||
| Healthcare / Medical Devices | 1 | $23B |
|
||
| Automotive Technology | 1 | $20B |
|
||
Price history
+1069.2% since first listed5 events — show timeline
- 2026-04-17 Pending — MiRealSource-MiMLS
- 2026-04-17 Pending — REALCOMP
- 2026-02-19 Listed $760,000 REALCOMP
- 2026-02-19 Listed $760,000 MiRealSource-MiMLS
- 2018-03-20 Sold (Public Records) $65,000 Public Records
Property tax history
+9.9%/yrLatest (2025): $12,061 · +85.6% YoY. Source: county tax records.
Cash-flow waterfall
monthlySold comps — $/sqft
last 12 mo · ≤1 miLoading sold comps…