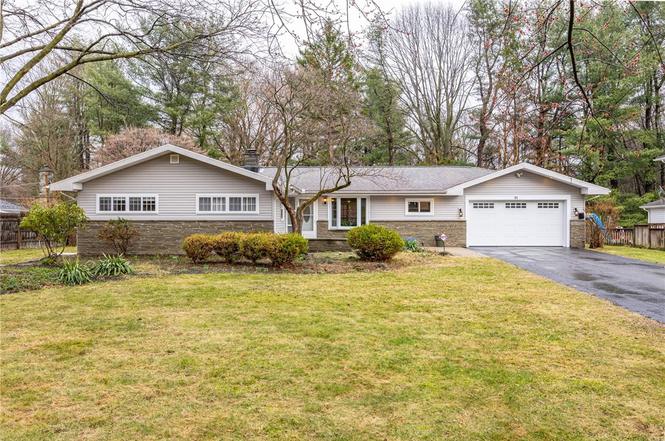
11 Santa Dr · East Rochester, NY
Flood risk 1/10 · Minimal
- FEMA flood zone
- X (unshaded)
- Chance of flooding over 30 yrs
- 0.0%
- Est. flood insurance / yr
- $473 – $860
Fire risk 3/10 · Minor
- Est. fire insurance / yr
- $691 – $1,283
Heat risk 2/10 · Minimal
- Hot days now (above 96°F)
- 7 days/yr
- Hot days in 30 yrs
- 16 days/yr
Wind risk 1/10 · Minimal
- Chance of severe wind over 30 yrs
- —
Air-quality risk 2/10 · Minimal
- Unhealthy air days now
- 1 days/yr
- Unhealthy air days in 30 yrs
- 2 days/yr
Risk factors via First Street. Map © Google.
Why this score? — see what drove the D+ grade
The composite is a weighted blend of 9 inputs, each scored 0–100. Each bar is that input's sub-score; the figure is the points it added to the 100-point composite (weight × sub-score).
- ARV discount +12.4/15.0
- Cash flow +10.5/30.0
- Schools +7.5/10.0
- Livability +3.9/5.0
- 1% rule +3.8/10.0
- DSCR +3.0/10.0
- Rent growth +2.5/5.0
- Condition / age +2.5/5.0
- Appreciation +0.0/10.0
$349,900
🖨 Deal sheet 📄 Offer letter ✓ Due diligence
Listing remarks MLS
Very nice clean rental! Four spacious bedrooms, huge living room, finished basement, updated kitchen, woodburning fireplace, huge all seasons sunroom. Very private park-like backyard! Immaculate condition!
Key facts
- New hardwood floors
- New vinyl siding
- New windows
Tags
Neighborhood map
What this means for you Summary
Snapshot
- This is a 4-bed/2.5-bath single-family listed at $350k.
Deal economics
- At list price, monthly cash flow is $-180 ($-2k/yr) — negative.
- To cash-flow at today's rent, offer at most $318k (9.1% below list).
- To meet the 1% rule (rent ≥ 1% of price), the offer needs to be $307k (12.3% below list).
- Recommended offer: $307k (12.3% below list) — sets the bar for 1% rule.
- Cap rate 5.7% vs local median 4.5% in East Rochester — meaningfully above typical; check what's discounted (condition, days-on-market, listing class) to confirm the premium yield is real.
Location & tenants
- Location reads 78/100 on livability (#155 in NY, #2,400 nationally) — a middle-class / working-renter tenant base. Strengths: amenities A+, cost of living A+, housing A+; Watch: employment D+, crime D.
- Pittsford Central School District (suburban): math 80% / reading 84% proficiency, ranked #34 of 590 in NY (top 6%) — strong family-tenant draw, lease renewals of 3-5y typical; only 2% free/reduced lunch — higher-income household profile.
- Market conditions: 186 active listings in the ZIP; 3 comparable units currently listed for rent nearby; rentals at typical pace (median 14d on market — plan ~3-4 weeks tenant-placement turnaround); high-income renter base; 1,169 units permitted in Monroe County in 2024 (591 in 5+ unit buildings).
Forward outlook
- Local home prices are declining (-3.0%/yr); year-one equity from $2k of loan paydown is wiped out by about $10k of value loss. Plan a longer hold.
- Monroe County population projected to shrink 6% by 2050 — rents likely to lag national; underwrite the cash flow, not the appreciation.
Negotiation context
- Only 7 days on market — expect competitive offers; lowballing is unlikely to land.
- 4 sale attempts since 16y ago with the ask held roughly flat each time — persistent listings suggest the price (not the market) is what's stuck; bring a comps-based counter.
- Current owner paid $2k; list at $350k implies a 21106% gain — meaningful room to come down on a strong offer.
Risks & watch-outs
- Watch-outs: built in 1956 — expect roof / HVAC / electrical / plumbing capex.
Questions for the listing agent
- What do current leases actually rent for vs. the listed asking? Can we see a recent rent roll and the last 12 months of T-12 income?
- Built in 1956 — when were the roof, HVAC, electrical panel, plumbing, and water heater last replaced?
- Is there a deadline driving the sale (1031 exchange, divorce, estate, relocation)? That informs how much negotiation room exists.
- Schools are A-rated — typically a magnet for longer-tenancy family renters. What's the average tenant stay here, and is there a school-zone premium baked into asking?
- Crime grade is D in this area — have there been break-ins, vandalism, or insurance claims at this property in the last 3 years? What carrier currently insures it and at what premium?
- The area grade is low — what's the realistic commute time and amenity access for the typical tenant pool here? Any planned neighborhood developments (good or bad) we should know about?
- What's the average days-on-market for RENTAL listings here right now (not sales)? A rising rental-DOM trend means longer vacancies and softer asking-rent achievability than the comps imply.
- What's the recent tenant-quality profile in this submarket — average credit score on applications, eviction rate, late-payment / NSF rate, and stable-employment percentage? A property-management company in the area should have these aggregated.
- How much new for-sale + rental construction is in the pipeline within 1–3 miles? Heavy new supply typically softens prices + rents 12–24 months out; constrained supply supports both.
Investment metrics
- 1% rule
- 0.88% ✗
- Cap rate
- 5.67%
- Cash-on-cash
- -2.21%
- DSCR
- 0.90
- GRM
- 9.5
CMA / ARV
- ARV (on-the-fly)
- $392,200
- Comps found
- 12
Show comp detail 12 sales within ~0.75 mi
| Address | Dist | Beds/Ba | Sqft | Sold | Price | $/sf | Match |
|---|---|---|---|---|---|---|---|
| 11 Santa Dr | 0.00mi | 4/2.5 | 1,850 (0%) | 2mo | $450,000 | $243 | 99 |
| 20 Kitty Hawk Dr | 0.44mi | 4/2.5 | 1,921 (+4%) | 8mo | $380,000 | $198 | 67 |
| 1 Cypress Cir | 0.66mi | 4/2.5 | 1,883 (+2%) | 5mo | $400,000 | $212 | 62 |
| 75 Brentwood Ln | 0.50mi | 4/1.5 | 1,752 (-5%) | 2mo | $430,000 | $245 | 62 |
| 126 Brentwood Ln | 0.70mi | 4/2.5 | 1,896 (+2%) | 2mo | $410,000 | $216 | 61 |
| 5691 Pittsford Palmyra Rd | 0.46mi | 4/2.0 | 2,052 (+11%) | 10mo | $280,000 | $136 | 50 |
| 24 Countryside Rd | 0.47mi | 3/2.5 (-1) | 2,041 (+10%) | 7mo | $575,000 | $282 | 50 |
| 17 Butternut Dr | 0.41mi | 3/1.5 (-1) | 1,575 (-15%) | 1mo | $400,000 | $254 | 47 |
| 35 Harvest Rd | 0.73mi | 4/2.0 | 1,694 (-8%) | 6mo | $306,000 | $181 | 45 |
| 44 Cullens Run | 0.69mi | 4/2.0 | 1,622 (-12%) | 6mo | $330,000 | $203 | 40 |
| 43 Harvest Rd | 0.74mi | 4/2.0 | 2,080 (+12%) | 9mo | $435,000 | $209 | 35 |
| 28 Little Brook Dr | 0.57mi | 3/2.0 (-1) | 1,582 (-14%) | 10mo | $315,000 | $199 | 34 |
Match score weights: distance 35% · size 25% · config 20% · recency 20%. Top-matched comps best support the ARV.
Projected returns pro-forma
-3.0% appreciation · 3.0% rent growth · sell at horizon
- IRR
- -19.9%
- Equity multiple
- 0.31×
- Total profit
- $-68,017
- Equity at exit
- $52,171
- IRR
- -12.7%
- Equity multiple
- 0.25×
- Total profit
- $-73,355
- Equity at exit
- $30,253
Cash invested: $97,972 (down + closing). Projections, not guarantees.
Landlord ↔ Tenant lean methodology
- Overall (STATE)
- 15 Strongly Tenant-Friendly
- State New York
- 15 Strongly Tenant-Friendly · D+10
- County
- — inherits STATE
- City
- — inherits STATE
ZIP-level market 14534
- Active inventory
- 186
- Price-to-rent
- 9.5×
Monthly cashflow live
- Estimated rent
- $3,069 medium interval (Pro) →
- Mortgage (P&I)
- −$1,835
- Tax from tax record
- −$624 /mo · $7,492/yr
- Insurance
- −$146
- HOA
- −$0
- Vacancy / Maint / Mgmt
- −$645
- Net cashflow
- $-180
Break-even live
UW: 25.0% down · 7.5% · 30yr · 1.5% tax · 5.0% vac · 8.0% maint · 8.0% mgmt
Financing live
Cash to close
- Down payment
- $87,475
- Closing costs
- $10,497
- Reserves months
- —
- Total cash needed
- —
Loan-product check · same deal, 3 products live
Conventional
25% down · 7.5% · 30yr
- Down + closing
- —
- Monthly P&I
- —
- Monthly cashflow
- —
- DSCR
- —
- Eligible?
- —
Personal DTI + credit; lowest rate.
DSCR
20% down · 8.5% · 30yr
- Down + closing
- —
- Monthly P&I
- —
- Monthly cashflow
- —
- DSCR
- —
- Eligible?
- —
No personal income docs; deal must DSCR.
Hard money
10% down · 12.0% · 12mo
- Down + closing
- —
- Monthly P&I
- —
- Monthly cashflow
- —
- DSCR
- —
- Eligible?
- —
Short-term bridge; refi at stabilization.
Rent comps 3 comps
| Address | Beds | Baths | Sqft | Rent | $/sqft | DOM | Units | Dist |
|---|---|---|---|---|---|---|---|---|
| 6 Cullens Run Pittsford, NY | 4.0 | 2.0 | 1300 | $3,000 | $2.31 | 43d | 1 | 0.72mi |
| 20 Boughton Ave Pittsford, NY | 3.0 | 2.5 | 1653 | $3,200 | $1.94 | 14d | 1 | 1.47mi |
| 1253 Fairport Rd Fairport, NY | 3.0 | 2.0 | 2194 | $2,500 | $1.14 | 2d | 1 | 1.49mi |
Listing history 11 events
-
2026-03-20status Pending
-
2026-03-12$349,900 Active
-
2014-10-03$1,850
-
2013-03-15historical 207-char remark
Show marketing remark (207 chars)
Very nice clean rental! Four spacious bedrooms, huge living room, finished basement, updated kitchen, woodburning fireplace, huge all seasons sunroom. Very private park-like backyard! Immaculate condition!
-
2013-03-11soldstatus $1,650 207-char remark
Show marketing remark (207 chars)
Very nice clean rental! Four spacious bedrooms, huge living room, finished basement, updated kitchen, woodburning fireplace, huge all seasons sunroom. Very private park-like backyard! Immaculate condition!
-
2013-02-08$1,650 207-char remark
Show marketing remark (207 chars)
Very nice clean rental! Four spacious bedrooms, huge living room, finished basement, updated kitchen, woodburning fireplace, huge all seasons sunroom. Very private park-like backyard! Immaculate condition!
-
2010-12-06historical
-
2010-12-01soldstatus $1,550
-
2010-10-01$1,550
-
2009-08-31soldstatus $173,000
-
2006-06-08soldstatus $169,900
ⓘ Source: listings_history table (triggers on properties + properties_extension) + one-shot
backfill from property_details.listing_events for pre-trigger history.
Tax reassessment forecast NY · Partial reset (capped growth)
- Current annual tax
- $7,492 · $624/mo
- Projected year-2 tax
- $7,492 · $624/mo
- Expected delta
- $0/yr ($0/mo · 0.0%)
ⓘ Screening estimate from a state-policy table — verify with the county assessor before closing.
Climate risk First Street
- Flood 1/10 Low FEMA zone X (unshaded) · 0% chance over 30 yrs
- Wildfire 3/10 Moderate
- Heat 2/10 Low 7 d/yr ≥96°F today · 16 d/yr by 30 yrs out
- Wind 1/10 Low
- Air quality 2/10 Low 1 unhealthy d/yr today · 2 by 30 yrs out
Nearby sold comps map
Loading sold comps map…
Walkable amenities ~0.75 mi
Loading nearby amenities…
Taxation est. · year 1
- Rental income
- $36,833
- − Mortgage interest
- −$19,600
- − Property taxes
- −$7,492
- − Insurance
- −$1,750
- − Repairs & maintenance
- −$2,947
- − Management
- −$2,947
- − Depreciation
- −$10,179
- Taxable loss
- −$8,081
- Est. tax savings @ 24.0%
- +$1,939
- After-tax cash flow
- $-223/yr
For passive investors: Depreciation is non-cash, so a rental often shows a tax loss while cash-flowing — sheltering income. Rental losses are passive: they offset passive income freely, and up to $25,000/yr can offset ordinary (W-2) income if you actively participate and your MAGI is under $100k (phasing out to $0 by $150k); unused losses carry forward. On sale, claimed depreciation is recaptured at up to 25%, and gains may owe capital-gains tax (a 1031 exchange can defer both). Figures are a year-1 estimate at your 24.0% rate — not tax advice; consult a CPA.
Schools (NCES district)
- District
- Pittsford Central School District
- NCES district ID
- 3623160
- Math proficiency
- 80% ▼ -4.00%
- Reading proficiency
- 84% ▲ 7.00%
- Median HH income
- $106,940
- Composite
- 74.75/100
- National rank
- #151
- State rank
- #34 of 590 in NY
Livability — East Rochester
- Score
- 78/100
- State rank
- #155
- US rank
- #2400
Category grades
Schools grade is shown separately in the Schools card above.
Census & demographics
- County
- Monroe County · 674,131 people
- City population
- 38,703
- Metro
- Rochester, NY
- Population (ZIP)
- 33,230
- Household income
- $143,694
- Rent vs Own
- Severe rent burden
- 398.0
Population outlook (Monroe County) Hauer SSP2
- Today (2025)
- 759,460 people
- By 2030
- 757,154 · -0.3%
- By 2040
- 740,644 · -2.5%
- By 2050
- 714,443 · -5.9%
- By 2075
- 645,883 · -15.0%
- By 2100
- 547,084 · -28.0%
Race, ethnicity, and origin ACS 2023
- Neighborhood character
- Predominantly White (81%)
- Race & ethnicity
- White 81% Asian 8% Two or more races 6% Hispanic / Latino 4% Black 2%
- Common ancestry
- Romanian 5% Italian 4% Lithuanian 3%
- Foreign-born
- 12% · Canada, China, South Korea
- Languages at home
- 87% English-only · Other Indo-European 3% Chinese 2% Spanish 2%
Political lean MEDSL · Monroe
- 2024 margin
- D (+19.1) · D 59.5% · R 40.5%
- 2008→2024 swing
- +1.4pp toward D · 2008: 17.7pp · 2024: 19.1pp
- All cycles
- 2024: D+19.1 2020: D+21.0 2016: D+14.1 2012: D+17.4 2008: D+17.7
Not yet ingested
- Civics
- —
Market trends
- HPI YoY
- ▼ -232.40%
- Current HPI
- 258.0726
- Rent YoY
- —
- Metro
- Rochester, NY
- State GDP YoY
- ▲ 2.60%
- F500 in state
- 92
Industry mix (Fortune 500 HQ in NY)
| Industry | F500 HQs | Revenue |
|---|---|---|
| Financial Services | 10 | $950B |
|
||
| Consumer Goods | 9 | $162B |
|
||
| Insurance | 4 | $225B |
|
||
| Telecommunications | 2 | $144B |
|
||
| Pharmaceuticals | 2 | $112B |
|
||
| Media / Entertainment | 2 | $69B |
|
||
Price history
+105.9% since first listed11 events — show timeline
- 2026-03-20 Pending — UNYREIS
- 2026-03-12 Listed $349,900 UNYREIS
- 2014-10-03 Listed $1,850 UNYREIS
- 2013-03-15 Listing Removed — UNYREIS
- 2013-03-11 Sold (MLS) $1,650 UNYREIS
- 2013-02-08 Listed $1,650 UNYREIS
- 2010-12-06 Listing Removed — UNYREIS
- 2010-12-01 Sold (MLS) $1,550 UNYREIS
- 2010-10-01 Listed $1,550 UNYREIS
- 2009-08-31 Sold (Public Records) $173,000 Public Records
- 2006-06-08 Sold (Public Records) $169,900 Public Records
Property tax history
+1.5%/yrLatest (2025): $7,492 · -1.8% YoY. Source: county tax records.
Cash-flow waterfall
monthlySold comps — $/sqft
last 12 mo · ≤1 miLoading sold comps…