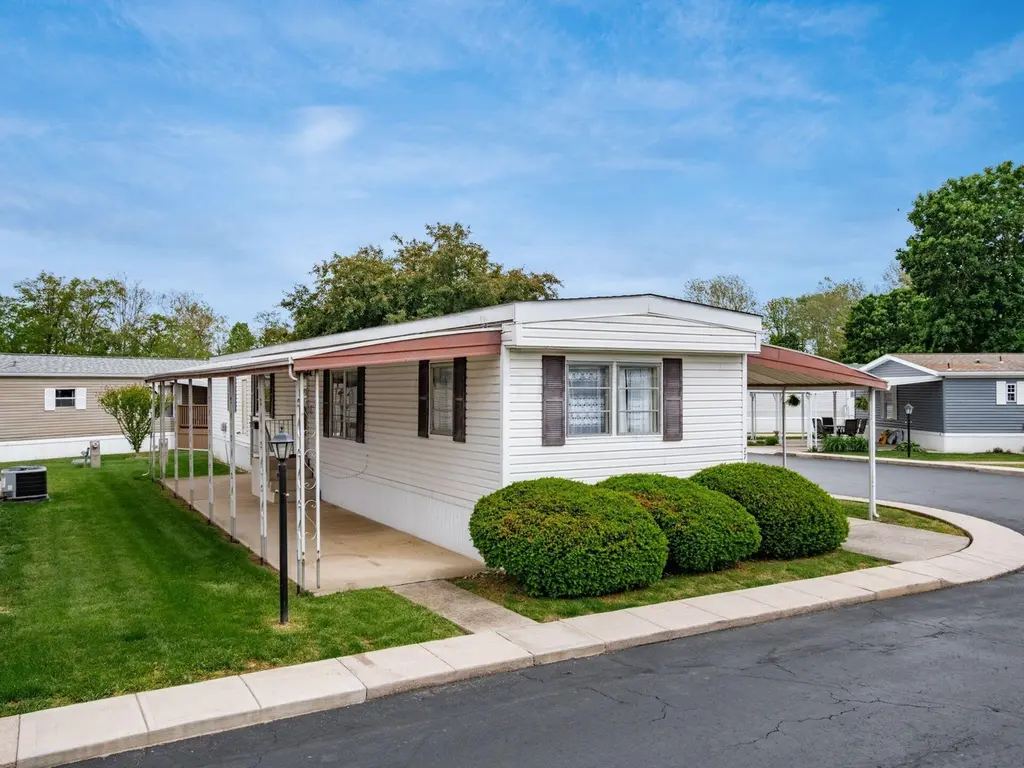
2000 U.s. Highway 23n N #77 · Delaware, OH
Flood risk No data
- FEMA flood zone
- —
- Chance of flooding over 30 yrs
- —
- Est. flood insurance / yr
- —
Fire risk No data
- Est. fire insurance / yr
- —
Heat risk No data
- Hot days now (above threshold)
- —
- Hot days in 30 yrs
- —
Wind risk No data
- Chance of severe wind over 30 yrs
- —
Air-quality risk No data
- Unhealthy air days now
- —
- Unhealthy air days in 30 yrs
- —
Risk factors via First Street. Map © Google.
Why this score? — see what drove the B- grade
The composite is a weighted blend of 9 inputs, each scored 0–100. Each bar is that input's sub-score; the figure is the points it added to the 100-point composite (weight × sub-score).
- Cash flow +30.0/30.0
- 1% rule +10.0/10.0
- DSCR +10.0/10.0
- Schools +4.7/10.0
- Livability +4.0/5.0
- Rent growth +2.9/5.0
- Condition / age +2.5/5.0
- ARV discount +1.9/15.0
- Appreciation +0.0/10.0
$45,000
🖨 Deal sheet 📄 Offer letter ✓ Due diligence
Listing remarks MLS
Buyer must be approved by Park Management. Very well maintained singlewide with Covered patio and car port plus a shed! new furnace and A/C all plumbing has also been updated! No Dogs.
Key facts
- New kitchen
- Shed
- New flooring
Tags
Property features AI
Finance
- Other: Located in a 55+ community
- HOA & community: Homeowners association with monthly fee of $650; HOA fee includes cable/satellite, water, sewer, trash, and snow removal; Community amenities include sidewalks; Association phone available
Exterior
- Parking: Two covered carport spaces
- Utilities: Public water; Public sewer
- Home design: One-story residence; Other residential without deeded land; Built in 1974
- Construction: Other foundation
- Exterior features: Deck; No shared/common walls
Interior
- Bedrooms: Two main-level bedrooms
- Flooring: Carpet; Vinyl; Other flooring
- Bathrooms: One full bathroom; One half bathroom (total 1.5 bathrooms)
- Heating & cooling: Forced air heating; Central air conditioning
- Interior features: Insulated windows throughout; 980 square feet of living area
Neighborhood map
What this means for you Summary
Snapshot
- This is a 2-bed/1.5-bath manufactured listed at $45k.
Deal economics
- At list price, monthly cash flow is $183 ($2k/yr) — positive.
- The deal already cash-flows at list — no discount required.
- Meets the 1% rule at list price ($1k rent vs $45k).
- Recommended offer: $44k (3.0% below list) — sets the bar for market timing.
- Cap rate 11.2% vs local median 2.5% in Delaware — top-decile yield for the area; either an underpriced asset or a hidden risk that comps aren't pricing in. Stress-test before assuming the spread holds.
Location & tenants
- Location reads 80/100 on livability (#116 in OH, #1,717 nationally) — a professional / high-income tenant draw. Strengths: cost of living A+, housing A+, schools A; Watch: amenities C-, commute F.
- Delaware City (suburban): math 47% / reading 63% proficiency, ranked #355 of 656 in OH (top 54%) — acceptable for families but not a draw, mixed tenant base, ~2y average lease.
- Market conditions: Rents rising (+1.4%/yr); 499 active listings in the ZIP; solid renter incomes; 2,233 units permitted in Delaware County in 2024 (304 in 5+ unit buildings).
- This rent is only 16% of the median local income ($105k/yr) — well below the 30% rent-burden line; pricing power to push rent on renewal without tenant pushback.
Forward outlook
- Local home prices are declining (-3.0%/yr); year-one equity from $311 of loan paydown is wiped out by about $1k of value loss. Plan a longer hold.
- Delaware County population projected at +37% by 2050 — long-run rental-demand tailwind backs the buy-and-hold thesis.
- At projected returns (-3.0% appreciation + 1.4% rent growth), your $13k cash investment doubles in ~10 years — after that, you're playing with house money.
Negotiation context
- It's been on market 35 days — a 3% lower offer ($44k) is reasonable based on typical stale-listing flexibility.
- 2 sale attempts since 18y ago with the ask held roughly flat each time — persistent listings suggest the price (not the market) is what's stuck; bring a comps-based counter.
- Current owner paid $4k; list at $45k implies a 1186% gain — meaningful room to come down on a strong offer.
Risks & watch-outs
- Watch-outs: HOA is 45% of rent.
Questions for the listing agent
- It's been on market 35 days. Have you received any prior offers? Is the seller open to a 3% concession, seller financing, or rate buy-down credit?
- Built in 1974 — when were the roof, HVAC, electrical panel, plumbing, and water heater last replaced?
- What does the HOA fee cover, when was the last increase, and are there any pending special assessments or reserve-fund shortfalls?
- Is there a deadline driving the sale (1031 exchange, divorce, estate, relocation)? That informs how much negotiation room exists.
- Schools are A-rated — typically a magnet for longer-tenancy family renters. What's the average tenant stay here, and is there a school-zone premium baked into asking?
- What's the average days-on-market for RENTAL listings here right now (not sales)? A rising rental-DOM trend means longer vacancies and softer asking-rent achievability than the comps imply.
- What's the recent tenant-quality profile in this submarket — average credit score on applications, eviction rate, late-payment / NSF rate, and stable-employment percentage? A property-management company in the area should have these aggregated.
- How much new for-sale + rental construction is in the pipeline within 1–3 miles? Heavy new supply typically softens prices + rents 12–24 months out; constrained supply supports both.
Investment metrics
- 1% rule
- 3.22% ✓
- Cap rate
- 11.16%
- Cash-on-cash
- 17.39%
- DSCR
- 1.77
- GRM
- 2.6
CMA / ARV
- ARV (median comp)
- $40,000
- List price
- $45,000
- Delta
- 12.50%
- Verdict
- OVERPRICED
- Comps
- 13 within 1.0 mi
Projected returns pro-forma
-3.0% appreciation · 1.42% rent growth · sell at horizon
- IRR
- 5.3%
- Equity multiple
- 1.20×
- Total profit
- $2,491
- Equity at exit
- $6,710
- IRR
- 11.6%
- Equity multiple
- 1.78×
- Total profit
- $9,846
- Equity at exit
- $3,891
Cash invested: $12,600 (down + closing). Projections, not guarantees.
Landlord ↔ Tenant lean methodology
- Overall (STATE)
- 73 Landlord-Friendly
- State Ohio
- 73 Landlord-Friendly · R+6
- County
- — inherits STATE
- City
- — inherits STATE
ZIP-level market 43015
- Rents YoY
- 1.4%
- Active inventory
- 499
- Price-to-rent
- 2.6×
Monthly cashflow live
- Estimated rent
- $1,448 medium interval (Pro) →
- Mortgage (P&I)
- −$236
- Tax est. 1.5%
- −$56 /mo · $675/yr
- Insurance
- −$19
- HOA
- −$650
- Vacancy / Maint / Mgmt
- −$304
- Net cashflow
- $183
Break-even live
UW: 25.0% down · 7.5% · 30yr · 1.5% tax · 5.0% vac · 8.0% maint · 8.0% mgmt
Financing live
Cash to close
- Down payment
- $11,250
- Closing costs
- $1,350
- Reserves months
- —
- Total cash needed
- —
Loan-product check · same deal, 3 products live
Conventional
25% down · 7.5% · 30yr
- Down + closing
- —
- Monthly P&I
- —
- Monthly cashflow
- —
- DSCR
- —
- Eligible?
- —
Personal DTI + credit; lowest rate.
DSCR
20% down · 8.5% · 30yr
- Down + closing
- —
- Monthly P&I
- —
- Monthly cashflow
- —
- DSCR
- —
- Eligible?
- —
No personal income docs; deal must DSCR.
Hard money
10% down · 12.0% · 12mo
- Down + closing
- —
- Monthly P&I
- —
- Monthly cashflow
- —
- DSCR
- —
- Eligible?
- —
Short-term bridge; refi at stabilization.
HOA detail
- Monthly dues
- $650 · $7,800/yr
Listing history 16 events
-
2026-06-18days on market $45,000 Active 35 DOM
-
2026-06-17days on market $45,000 Active 34 DOM
-
2026-06-16days on market $45,000 Active 33 DOM
-
2026-06-15days on market $45,000 Active 32 DOM
-
2026-06-13days on market $45,000 Active 30 DOM
-
2026-06-09days on market $45,000 Active 26 DOM
-
2026-06-08days on market $45,000 Active 25 DOM
-
2026-06-07days on market $45,000 Active 24 DOM
-
2026-06-03days on market $45,000 Active 20 DOM
-
2026-06-02days on market $45,000 Active 19 DOM
-
2026-06-01days on market $45,000 Active 18 DOM
-
2026-05-31days on market $45,000 Active 17 DOM
-
2026-05-14$45,000 Active 800-char remark
-
2008-05-16soldstatus $3,500 184-char remark
Show marketing remark (184 chars)
Buyer must be approved by Park Management. Very well maintained singlewide with Covered patio and car port plus a shed! new furnace and A/C all plumbing has also been updated! No Dogs.
-
2008-05-15historical 184-char remark
Show marketing remark (184 chars)
Buyer must be approved by Park Management. Very well maintained singlewide with Covered patio and car port plus a shed! new furnace and A/C all plumbing has also been updated! No Dogs.
-
2008-02-06$9,499 184-char remark
Show marketing remark (184 chars)
Buyer must be approved by Park Management. Very well maintained singlewide with Covered patio and car port plus a shed! new furnace and A/C all plumbing has also been updated! No Dogs.
ⓘ Source: listings_history table (triggers on properties + properties_extension) + one-shot
backfill from property_details.listing_events for pre-trigger history.
Nearby sold comps map
Loading sold comps map…
Walkable amenities ~0.75 mi
Loading nearby amenities…
Taxation est. · year 1
- Rental income
- $17,370
- − Mortgage interest
- −$2,521
- − Property taxes
- −$675
- − Insurance
- −$225
- − Repairs & maintenance
- −$1,390
- − Management
- −$1,390
- − HOA
- −$7,800
- − Depreciation
- −$1,309
- Taxable income
- $2,061
- Est. tax owed @ 24.0%
- −$495
- After-tax cash flow
- $1,696/yr
For passive investors: Depreciation is non-cash, so a rental often shows a tax loss while cash-flowing — sheltering income. Rental losses are passive: they offset passive income freely, and up to $25,000/yr can offset ordinary (W-2) income if you actively participate and your MAGI is under $100k (phasing out to $0 by $150k); unused losses carry forward. On sale, claimed depreciation is recaptured at up to 25%, and gains may owe capital-gains tax (a 1031 exchange can defer both). Figures are a year-1 estimate at your 24.0% rate — not tax advice; consult a CPA.
Schools (NCES district)
- District
- Delaware City
- NCES district ID
- 3904387
- Math proficiency
- 47% ▼ -24.00%
- Reading proficiency
- 63% ▼ -7.00%
- Median HH income
- $55,434
- Composite
- 47.39/100
- National rank
- #2288
- State rank
- #355 of 656 in OH
Livability — Delaware
- Score
- 80/100
- State rank
- #116
- US rank
- #1717
Category grades
Schools grade is shown separately in the Schools card above.
Census & demographics
- County
- Delaware County · 203,207 people
- City population
- 61,401
- Metro
- Columbus, OH
- Population (ZIP)
- 61,401
- Household income
- $105,322
- Rent vs Own
- Severe rent burden
- 965.0
Population outlook (Delaware County) Hauer SSP2
- Today (2025)
- 230,854 people
- By 2030
- 249,294 · +8.0%
- By 2040
- 284,223 · +23.1%
- By 2050
- 315,314 · +36.6%
- By 2075
- 379,462 · +64.4%
- By 2100
- 403,158 · +74.6%
Race, ethnicity, and origin ACS 2023
- Neighborhood character
- Predominantly White (82%)
- Race & ethnicity
- White 82% Two or more races 7% Hispanic / Latino 5% Asian 5% Black 4%
- Common ancestry
- Italian 3% Slovak 3% Romanian 2%
- Foreign-born
- 5% · Canada, China, Vietnam
- Languages at home
- 93% English-only · Spanish 2% Other Asian/Pacific 1% Other Indo-European 1%
Political lean MEDSL · Delaware
- 2024 margin
- Lean R (+6.6) · D 46.2% · R 52.8%
- 2008→2024 swing
- +13.0pp toward D · 2008: -19.6pp · 2024: -6.6pp
- All cycles
- 2024: R+6.6 2020: R+6.8 2016: R+16.1 2012: R+23.7 2008: R+19.6
Not yet ingested
- Civics
- —
Market trends
- HPI YoY
- ▼ -398.47%
- Current HPI
- 233.0634
- Rent YoY
- ▲ 1.42%
- Metro
- Columbus, OH
- State GDP YoY
- ▲ 1.98%
- F500 in state
- 48
Industry mix (Fortune 500 HQ in OH)
| Industry | F500 HQs | Revenue |
|---|---|---|
| Insurance | 3 | $145B |
|
||
| Industrial Machinery | 3 | $49B |
|
||
| Financial Services | 3 | $24B |
|
||
| Consumer Goods | 2 | $93B |
|
||
| Aerospace / Defense | 2 | $47B |
|
||
| Utilities | 2 | $33B |
|
||
Price history
+373.7% since first listed4 events — show timeline
- 2026-05-14 Listed $45,000 CBRMLS
- 2008-05-16 Sold (MLS) $3,500 CBRMLS
- 2008-05-15 Listing Removed — CBRMLS
- 2008-02-06 Listed $9,499 CBRMLS
Cash-flow waterfall
monthlySold comps — $/sqft
last 12 mo · ≤1 miLoading sold comps…