118 E Mid Town Ln · Hayden, ID
Flood risk No data
- FEMA flood zone
- —
- Chance of flooding over 30 yrs
- —
- Est. flood insurance / yr
- —
Fire risk No data
- Est. fire insurance / yr
- —
Heat risk No data
- Hot days now (above threshold)
- —
- Hot days in 30 yrs
- —
Wind risk No data
- Chance of severe wind over 30 yrs
- —
Air-quality risk No data
- Unhealthy air days now
- —
- Unhealthy air days in 30 yrs
- —
Risk factors via First Street. Map © Google.
Why this score? — see what drove the B+ grade
The composite is a weighted blend of 9 inputs, each scored 0–100. Each bar is that input's sub-score; the figure is the points it added to the 100-point composite (weight × sub-score).
- Cash flow +30.0/30.0
- ARV discount +15.0/15.0
- 1% rule +10.0/10.0
- DSCR +10.0/10.0
- Schools +4.4/10.0
- Livability +3.2/5.0
- Rent growth +2.8/5.0
- Condition / age +2.5/5.0
- Appreciation +0.0/10.0
$90,000
🖨 Deal sheet 📄 Offer letter ✓ Due diligence
Listing remarks
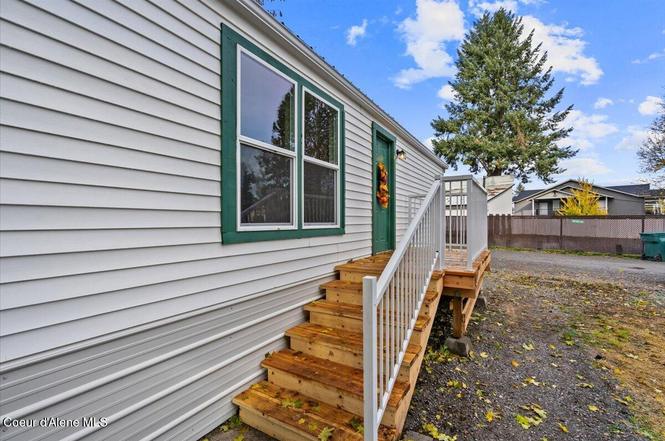
Step inside this beautifully remodeled Hayden home and fall in love with its perfect mix of modern style and North Idaho character. Updated in 2025 with LVP flooring, new windows, and a new AC system, this home is move in ready and full of comfort. Nestled in a peaceful setting close to local shops, restaurants, and parks. it's everything you love about Hayden living, all in one place. Sellers will also consider moving it for buyers that want it at a new location.
Key facts
- New ac system
- Lvp flooring
- New windows
Tags
Property features AI
Exterior
- Utilities: Public water; Public sewer
- Home design: Manufactured home; Single-story; Crawl space foundation; Aluminum roof; Vinyl siding
- Construction: Vinyl siding construction; Aluminum roof; Pillar/post/pier foundation; Built as a manufactured structure
- Exterior features: Lighting; Open porch; Level lot; Paved road access; View
Interior
- Kitchen: Electric range; Refrigerator; Dishwasher
- Bedrooms: 2 main-level bedrooms
- Flooring: LVP
- Bathrooms: 2 main-level bathrooms
- Heating & cooling: Electric forced-air furnace; Central air conditioning
- Interior features: Washer hookup; Open porch; Lighting
- Laundry & utility: Washer; Electric dryer hookup; Electric water heater
Neighborhood map
What this means for you Summary
Snapshot
- This is a 2-bed/2.0-bath single-family listed at $90k.
Deal economics
- At list price, monthly cash flow is $902 ($11k/yr) — positive.
- The deal already cash-flows at list — no discount required.
- Meets the 1% rule at list price ($2k rent vs $90k).
- Recommended offer: $79k (12.0% below list) — sets the bar for market timing.
- Cap rate 18.3% vs local median 2.2% in Hayden — top-decile yield for the area; either an underpriced asset or a hidden risk that comps aren't pricing in. Stress-test before assuming the spread holds.
Location & tenants
- Location reads 64/100 on livability (#150 in ID) — a middle-class / working-renter tenant base. Strengths: crime A+, housing A+; Watch: schools D+, amenities F, commute F.
- Coeur D'Alene District (urban): math 44% / reading 60% proficiency, ranked #23 of 92 in ID (top 25%) — acceptable for families but not a draw, mixed tenant base, ~2y average lease.
- Market conditions: Rents rising (+1.2%/yr); 383 active listings in the ZIP; 2 comparable units currently listed for rent nearby; solid renter incomes; 1,606 units permitted in Kootenai County in 2024 (154 in 5+ unit buildings).
Forward outlook
- Local home prices are declining (-3.0%/yr); year-one equity from $622 of loan paydown is wiped out by about $3k of value loss. Plan a longer hold.
- Kootenai County population projected at +33% by 2050 — long-run rental-demand tailwind backs the buy-and-hold thesis.
- At projected returns (-3.0% appreciation + 1.2% rent growth), your $25k cash investment doubles in ~3 years — after that, you're playing with house money.
Negotiation context
- It's been on market 137 days — a 12% lower offer ($79k) is reasonable based on typical stale-listing flexibility.
- 2 sale attempts; this cycle's ask has dropped $22k (20%) from the opening price — seller is motivated, your offer sets the floor, not the list.
Questions for the listing agent
- It's been on market 137 days. Have you received any prior offers? Is the seller open to a 12% concession, seller financing, or rate buy-down credit?
- Why hasn't it sold? Are there any deal-killer items the seller is aware of (foundation, flood, title, zoning, code violations)?
- Is there a deadline driving the sale (1031 exchange, divorce, estate, relocation)? That informs how much negotiation room exists.
- Schools are D-rated, which usually means shorter tenancies and higher turnover. Who's the typical renter profile here, and what's been the actual vacancy rate?
- What's the average days-on-market for RENTAL listings here right now (not sales)? A rising rental-DOM trend means longer vacancies and softer asking-rent achievability than the comps imply.
- What's the recent tenant-quality profile in this submarket — average credit score on applications, eviction rate, late-payment / NSF rate, and stable-employment percentage? A property-management company in the area should have these aggregated.
- How much new for-sale + rental construction is in the pipeline within 1–3 miles? Heavy new supply typically softens prices + rents 12–24 months out; constrained supply supports both.
Investment metrics
- 1% rule
- 2.14% ✓
- Cap rate
- 18.32%
- Cash-on-cash
- 42.97%
- DSCR
- 2.91
- GRM
- 3.9
CMA / ARV
- ARV (on-the-fly)
- $161,700
- Comps found
- 12
Show comp detail 12 sales within ~0.75 mi
| Address | Dist | Beds/Ba | Sqft | Sold | Price | $/sf | Match |
|---|---|---|---|---|---|---|---|
| 174 E Ryan Dr | 0.13mi | 2/2.0 | 1,011 (+3%) | 12mo | $370,000 | $366 | 79 |
| 9032 N Cuff Rd | 0.28mi | 3/1.5 (+1) | 952 (-3%) | 8mo | $224,900 | $236 | 68 |
| 9156 N Starr Loop | 0.59mi | 2/1.0 | 938 (-4%) | 2mo | $80,000 | $85 | 60 |
| 9231 N Starr Loop | 0.54mi | 2/2.0 | 924 (-6%) | 9mo | $65,000 | $70 | 58 |
| 8603 N Hayden Pines Way | 0.62mi | 2/1.0 | 924 (-6%) | 4mo | $74,900 | $81 | 54 |
| 10293 N Cedar Ct | 0.56mi | 3/1.0 (+1) | 1,004 (+2%) | 8mo | $420,000 | $418 | 54 |
| 10418 N Camp Ct | 0.69mi | 2/1.0 | 936 (-4%) | 4mo | $360,000 | $385 | 53 |
| 8474 N Sunny Ln | 0.65mi | 2/2.0 | 938 (-4%) | 13mo | $95,000 | $101 | 52 |
| 8502 N Sunny Ln | 0.62mi | 3/2.0 (+1) | 938 (-4%) | 8mo | $155,000 | $165 | 52 |
| 8517 N Sunny Ln | 0.61mi | 2/1.0 | 938 (-4%) | 10mo | $110,000 | $117 | 52 |
| 8861 N Starr Loop | 0.69mi | 2/1.0 | 924 (-6%) | 11mo | $85,000 | $92 | 46 |
| 962 W Kyler Ave | 0.72mi | 3/2.0 (+1) | 1,102 (+12%) | 3mo | $429,000 | $389 | 38 |
Match score weights: distance 35% · size 25% · config 20% · recency 20%. Top-matched comps best support the ARV.
Projected returns pro-forma
-3.0% appreciation · 1.16% rent growth · sell at horizon
- IRR
- 37.7%
- Equity multiple
- 2.56×
- Total profit
- $39,409
- Equity at exit
- $13,419
- IRR
- 43.3%
- Equity multiple
- 4.75×
- Total profit
- $94,567
- Equity at exit
- $7,782
Cash invested: $25,200 (down + closing). Projections, not guarantees.
Landlord ↔ Tenant lean methodology
- Overall (STATE)
- 91 Strongly Landlord-Friendly
- State Idaho
- 91 Strongly Landlord-Friendly · R+18
- County
- — inherits STATE
- City
- — inherits STATE
ZIP-level market 83835
- Rents YoY
- 1.2%
- Active inventory
- 383
- Price-to-rent
- 3.9×
Monthly cashflow live
- Estimated rent
- $1,930 medium interval (Pro) →
- Mortgage (P&I)
- −$472
- Tax est. 1.5%
- −$112 /mo · $1,350/yr
- Insurance
- −$38
- HOA
- −$0
- Vacancy / Maint / Mgmt
- −$405
- Net cashflow
- $902
Break-even live
UW: 25.0% down · 7.5% · 30yr · 1.5% tax · 5.0% vac · 8.0% maint · 8.0% mgmt
Financing live
Cash to close
- Down payment
- $22,500
- Closing costs
- $2,700
- Reserves months
- —
- Total cash needed
- —
Loan-product check · same deal, 3 products live
Conventional
25% down · 7.5% · 30yr
- Down + closing
- —
- Monthly P&I
- —
- Monthly cashflow
- —
- DSCR
- —
- Eligible?
- —
Personal DTI + credit; lowest rate.
DSCR
20% down · 8.5% · 30yr
- Down + closing
- —
- Monthly P&I
- —
- Monthly cashflow
- —
- DSCR
- —
- Eligible?
- —
No personal income docs; deal must DSCR.
Hard money
10% down · 12.0% · 12mo
- Down + closing
- —
- Monthly P&I
- —
- Monthly cashflow
- —
- DSCR
- —
- Eligible?
- —
Short-term bridge; refi at stabilization.
Rent comps 2 comps
| Address | Beds | Baths | Sqft | Rent | $/sqft | DOM | Units | Dist |
|---|---|---|---|---|---|---|---|---|
| 705 Shiloh Loop Unit 705-302 Hayden, ID | 2.0 | 2.0 | 1000 | $1,550 | $1.55 | 13d | 1 | 0.95mi |
| 7534 N Culture Way Coeur d'Alene, ID | 2.0–3.0 | 2.0 | 1213 | $1,730 | $1.43 | 13d | 4 | 1.27mi |
Listing history 21 events
-
2026-06-19days on market $90,000 Active 137 DOM
-
2026-06-18days on market $90,000 Active 136 DOM
-
2026-06-17days on market $90,000 Active 135 DOM
-
2026-06-16days on market $90,000 Active 134 DOM
-
2026-06-15days on market $90,000 Active 133 DOM
-
2026-06-14days on market $90,000 Active 131 DOM
-
2026-06-13days on market $90,000 Active 130 DOM
-
2026-06-10days on market $90,000 Active 128 DOM
-
2026-06-09days on market $90,000 Active 127 DOM
-
2026-06-08days on market $90,000 Active 126 DOM
-
2026-06-07days on market $90,000 Active 125 DOM
-
2026-06-03days on market $90,000 Active 121 DOM
-
2026-06-02days on market $90,000 Active 120 DOM
-
2026-06-01days on market $90,000 Active 119 DOM
-
2026-05-31days on market $90,000 Active 118 DOM
-
2026-05-30days on market $90,000 Active 117 DOM
-
2026-03-30price $90,000
-
2026-02-09price $99,000
-
2026-02-02$112,500 Active
-
2025-11-13price $120,000
-
2025-11-03$128,000 Active
ⓘ Source: listings_history table (triggers on properties + properties_extension) + one-shot
backfill from property_details.listing_events for pre-trigger history.
Nearby sold comps map
Loading sold comps map…
Walkable amenities ~0.75 mi
Loading nearby amenities…
Taxation est. · year 1
- Rental income
- $23,154
- − Mortgage interest
- −$5,041
- − Property taxes
- −$1,350
- − Insurance
- −$450
- − Repairs & maintenance
- −$1,852
- − Management
- −$1,852
- − Depreciation
- −$2,618
- Taxable income
- $9,990
- Est. tax owed @ 24.0%
- −$2,398
- After-tax cash flow
- $8,431/yr
For passive investors: Depreciation is non-cash, so a rental often shows a tax loss while cash-flowing — sheltering income. Rental losses are passive: they offset passive income freely, and up to $25,000/yr can offset ordinary (W-2) income if you actively participate and your MAGI is under $100k (phasing out to $0 by $150k); unused losses carry forward. On sale, claimed depreciation is recaptured at up to 25%, and gains may owe capital-gains tax (a 1031 exchange can defer both). Figures are a year-1 estimate at your 24.0% rate — not tax advice; consult a CPA.
Schools (NCES district)
- District
- Coeur D'Alene District
- NCES district ID
- 1600780
- Math proficiency
- 44% ▼ -6.00%
- Reading proficiency
- 60% ▼ -2.00%
- Median HH income
- $47,652
- Composite
- 44.16/100
- National rank
- #2858
- State rank
- #23 of 92 in ID
Livability — Hayden
- Score
- 64/100
- State rank
- #150
- US rank
- #14103
Category grades
Schools grade is shown separately in the Schools card above.
Census & demographics
- Census place
- Hayden, ID
- County
- Kootenai County · 146,553 people
- City population
- 24,238
- Metro
- Coeur d'Alene, ID
- Population (ZIP)
- 24,238
- Household income
- $91,316
- Rent vs Own
- Severe rent burden
- 345.0
Population outlook (Kootenai County) Hauer SSP2
- Today (2025)
- 177,692 people
- By 2030
- 190,689 · +7.3%
- By 2040
- 214,704 · +20.8%
- By 2050
- 236,510 · +33.1%
- By 2075
- 285,984 · +60.9%
- By 2100
- 316,459 · +78.1%
Race, ethnicity, and origin ACS 2023
- Neighborhood character
- Predominantly White (91%)
- Race & ethnicity
- White 91% Two or more races 6% Hispanic / Latino 4%
- Common ancestry
- Portuguese 6% Italian 3% Slovak 3%
- Foreign-born
- 3% · Canada
- Languages at home
- 98% English-only · Spanish 1%
Political lean MEDSL · Kootenai
- 2024 margin
- Solid R (+51.9) · D 22.9% · R 74.8% · Other 2.2%
- 2008→2024 swing
- -25.6pp toward R · 2008: -26.3pp · 2024: -51.9pp
- All cycles
- 2024: R+51.9 2020: R+42.9 2016: R+42.5 2012: R+34.3 2008: R+26.3
Not yet ingested
- Civics
- —
Market trends
- HPI YoY
- ▼ -271.03%
- Current HPI
- 256.927
- Rent YoY
- ▲ 1.16%
- Metro
- Coeur d'Alene, ID
- State GDP YoY
- ▲ 4.51%
- F500 in state
- 6
Industry mix (Fortune 500 HQ in ID)
| Industry | F500 HQs | Revenue |
|---|---|---|
| Retail | 1 | $79B |
|
||
| Technology | 1 | $25B |
|
||
| Food / Agriculture | 1 | $6B |
|
||
Price history
-29.7% since first listed5 events — show timeline
- 2026-03-30 Price Changed $90,000 CDAMLS
- 2026-02-09 Price Changed $99,000 CDAMLS
- 2026-02-02 Listed $112,500 CDAMLS
- 2025-11-13 Price Changed $120,000 CDAMLS
- 2025-11-03 Listed $128,000 CDAMLS
Cash-flow waterfall
monthlySold comps — $/sqft
last 12 mo · ≤1 miLoading sold comps…